Your browser does not fully support modern features. Please upgrade for a smoother experience.

Submitted Successfully!
Thank you for your contribution! You can also upload a video entry or images related to this topic.
For video creation, please contact our Academic Video Service.
| Version | Summary | Created by | Modification | Content Size | Created at | Operation |
|---|---|---|---|---|---|---|
| 1 | Robert Schwarcz | + 1352 word(s) | 1352 | 2022-02-16 09:44:09 | | | |
| 2 | Vivi Li | Meta information modification | 1352 | 2022-03-01 08:12:26 | | |
Video Upload Options
We provide professional Academic Video Service to translate complex research into visually appealing presentations. Would you like to try it?
Cite
If you have any further questions, please contact Encyclopedia Editorial Office.
Schwarcz, R. Kynurenine 3-Monooxygenase. Encyclopedia. Available online: https://encyclopedia.pub/entry/20031 (accessed on 15 January 2026).
Schwarcz R. Kynurenine 3-Monooxygenase. Encyclopedia. Available at: https://encyclopedia.pub/entry/20031. Accessed January 15, 2026.
Schwarcz, Robert. "Kynurenine 3-Monooxygenase" Encyclopedia, https://encyclopedia.pub/entry/20031 (accessed January 15, 2026).
Schwarcz, R. (2022, March 01). Kynurenine 3-Monooxygenase. In Encyclopedia. https://encyclopedia.pub/entry/20031
Schwarcz, Robert. "Kynurenine 3-Monooxygenase." Encyclopedia. Web. 01 March, 2022.
Copy Citation
Kynurenine 3-monooxygenase (KMO), a key player in the kynurenine pathway (KP) of tryptophan degradation, regulates the synthesis of the neuroactive metabolites 3-hydroxykynurenine (3-HK) and kynurenic acid (KYNA). KMO activity has been implicated in several major brain diseases including Huntington’s disease (HD) and schizophrenia. In the brain, KMO is widely believed to be predominantly localized in microglial cells, but verification in vivo has not been provided so far.
astrocyte
Huntington’s disease
kynurenine pathway
microglia
schizophrenia
1. Introduction
Kynurenine 3-monooxygenase (KMO) catalyzes the conversion of L-kynurenine to 3-hydroxykynurenine (3-HK) in the kynurenine pathway (KP), the major route of tryptophan degradation in eukaryotic organisms. While 3-HK is mainly known for generating reactive oxygen species and thereby causing oxidative damage, it is also able to scavenge free radicals and therefore has remarkable antioxidant properties. Importantly, because of its pivotal position in the KP, KMO is not only critical for 3-HK formation but controls the synthesis of several other biologically active KP metabolites, including kynurenic acid (KYNA), xanthurenic acid, 3-hydroxyanthranilic acid, xanthurenic acid, quinolinic acid, picolinic acid and cinnabarinic acid [1]. An NADPH-dependent enzyme located in the outer mitochondrial membrane [2][3][4] and linked to mitochondrial function [5], KMO is widely expressed in peripheral tissues, macrophages and monocytes [6][7]. Notably, as a number of KP metabolites are increasingly perceived to have considerable significance in normal brain function (see [8], for review), impaired KMO activity may play a substantive role in the pathophysiology of several neurological and psychiatric diseases [9][10][11][12]. For both conceptual and translationally relevant reasons, it is therefore essential to have a clear understanding of the cellular localization of KMO in the brain in health and disease.
Based almost entirely on studies of various cell types or immortalized cell lines in vitro, the prevailing view is that KMO in the central nervous system is predominantly localized in microglial cells (Figure 1) [13][14][15], and that inflammatory conditions greatly stimulate enzyme activity in these cells [13][16][17][18][19]. However, the presence of KMO has also been described in neurons and astrocytes in the rat brain [20]. KMO readily converts kynurenine to 3-HK in cultured fetal human neurons [21][22], and both KMO expression and function have been reported to be up-regulated in neurons in a mouse model of neuropathic pain [23]. Unfortunately, since state-of-the-art experimental in vivo tools have not been applied in this context so far, the present dogma that the major proportion of KMO in the mammalian brain is localized in microglial cells should therefore be considered with appropriate caution.
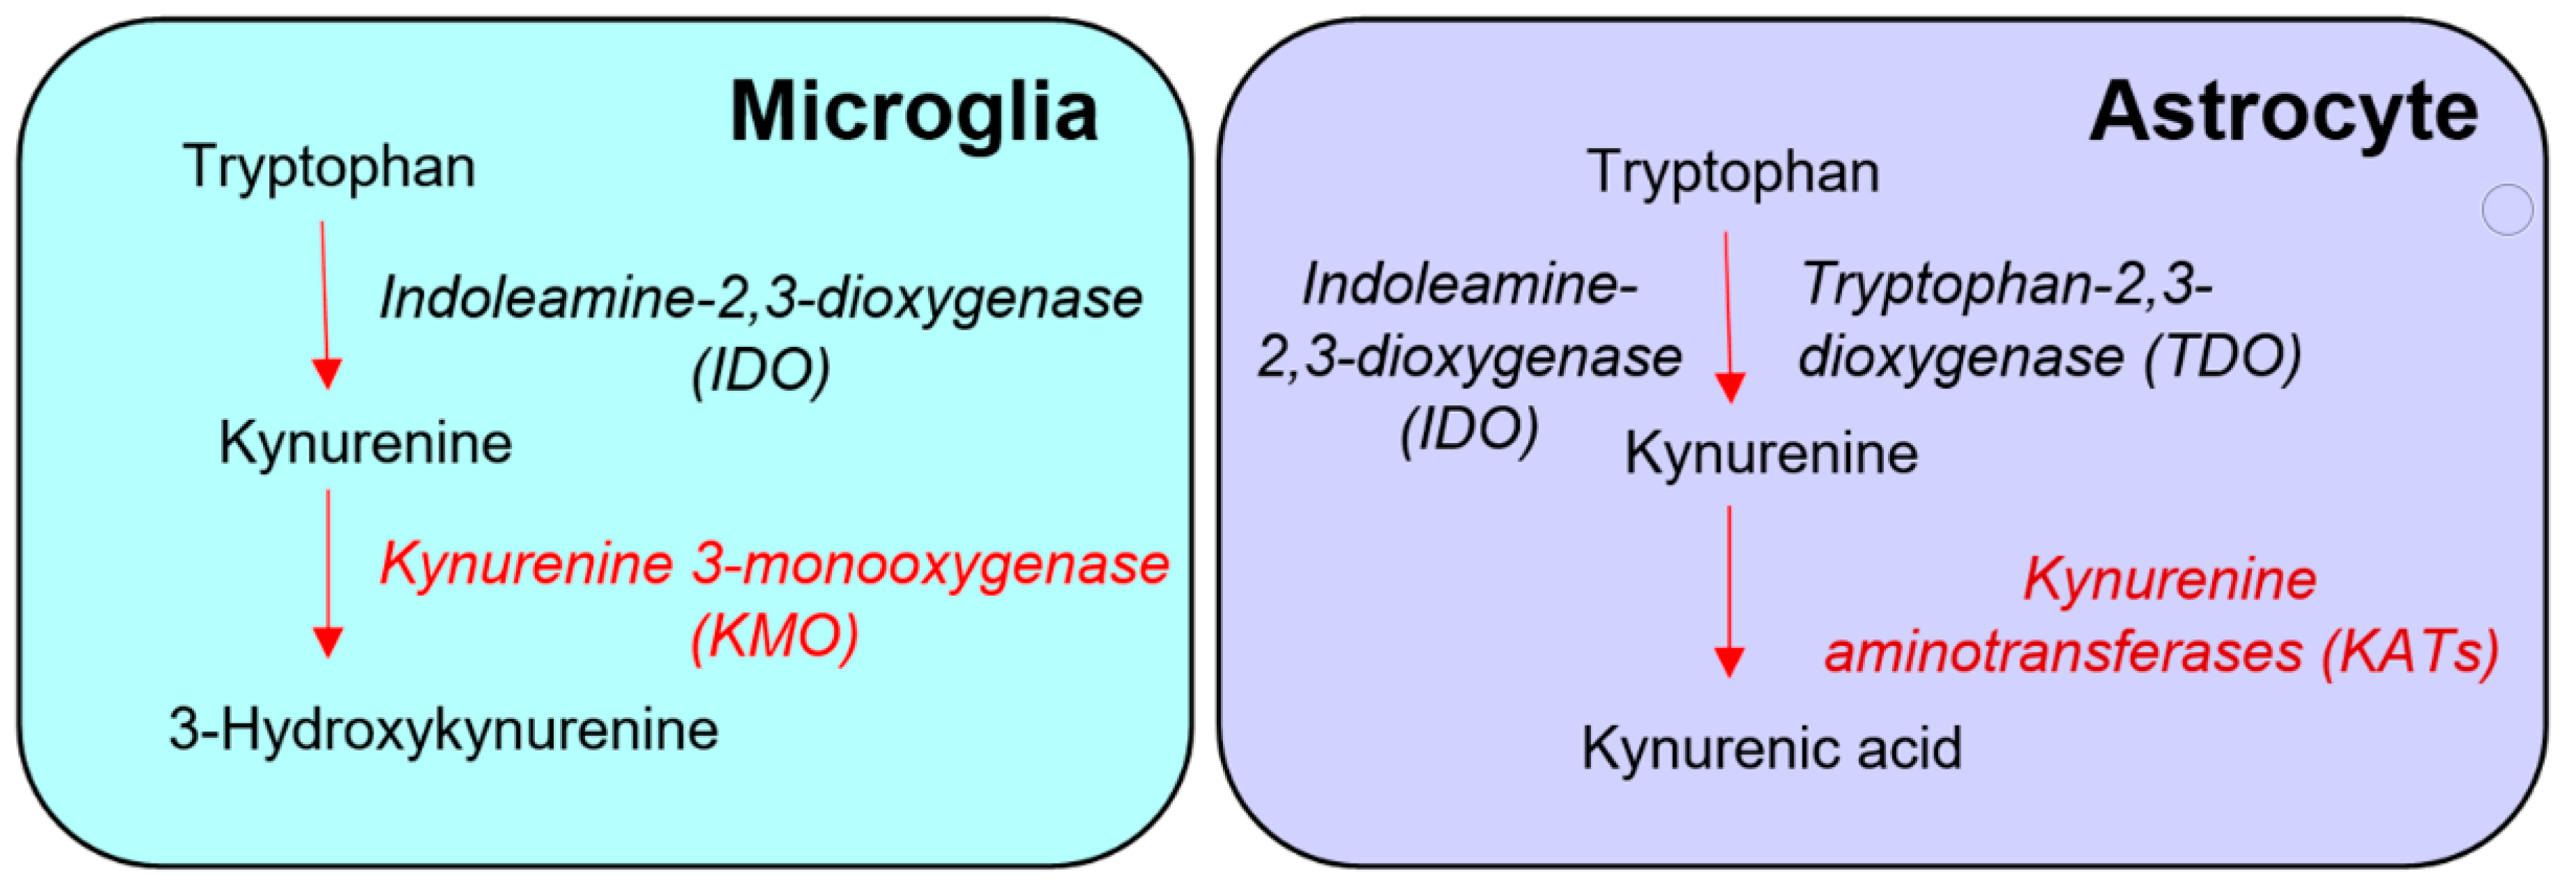
Figure 1. Conventional “glio-centric” view of the distinct de novo formation of 3-hydroxykynurenine and kynurenic acid in microglia and astrocytes, respectively.
2. Effect of PLX5622 Treatment in Healthy Mice
Real time PCR analysis of the microglial marker genes Aif1 (−89%), Csf1r (−97%), Cx3cr1 (−97%), Siglech (−97%) and Tmem119 (−90%) confirmed that daily administration of PLX5622 for 21 days caused the massive depletion of microglial cells in the forebrain of normal mice. However, the expression of these microglial markers was fully recovered 22 days after discontinuation of the treatment (Figure 2).
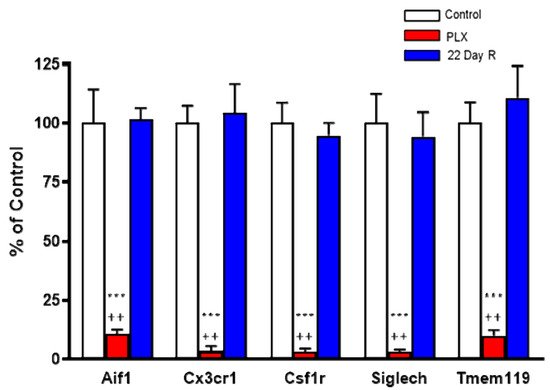
Figure 2. Effect of PLX5622 (PLX) treatment on microglial marker genes. Wild-type controls and PLX5622: n = 6 each; 22-day recovery (R): n = 3. Data (mean ± SEM) are expressed as a percentage of control values. See text for experimental details. *** p < 0.01 vs. control, ++ p < 0.05 vs. 22-day recovery (Kruskal–Wallis test with Dunn’s test for multiple pairwise comparisons).
In the same animals, neither Kmo expression nor KMO activity were significantly changed in the forebrain immediately after the treatment with PLX5622 or after a 22-day recovery period (Figure 3A,B). Forebrain 3-HK and KYNA levels, too, were not significantly affected by PLX5622 immediately after the treatment was terminated or 22 days later (Figure 3C,D).
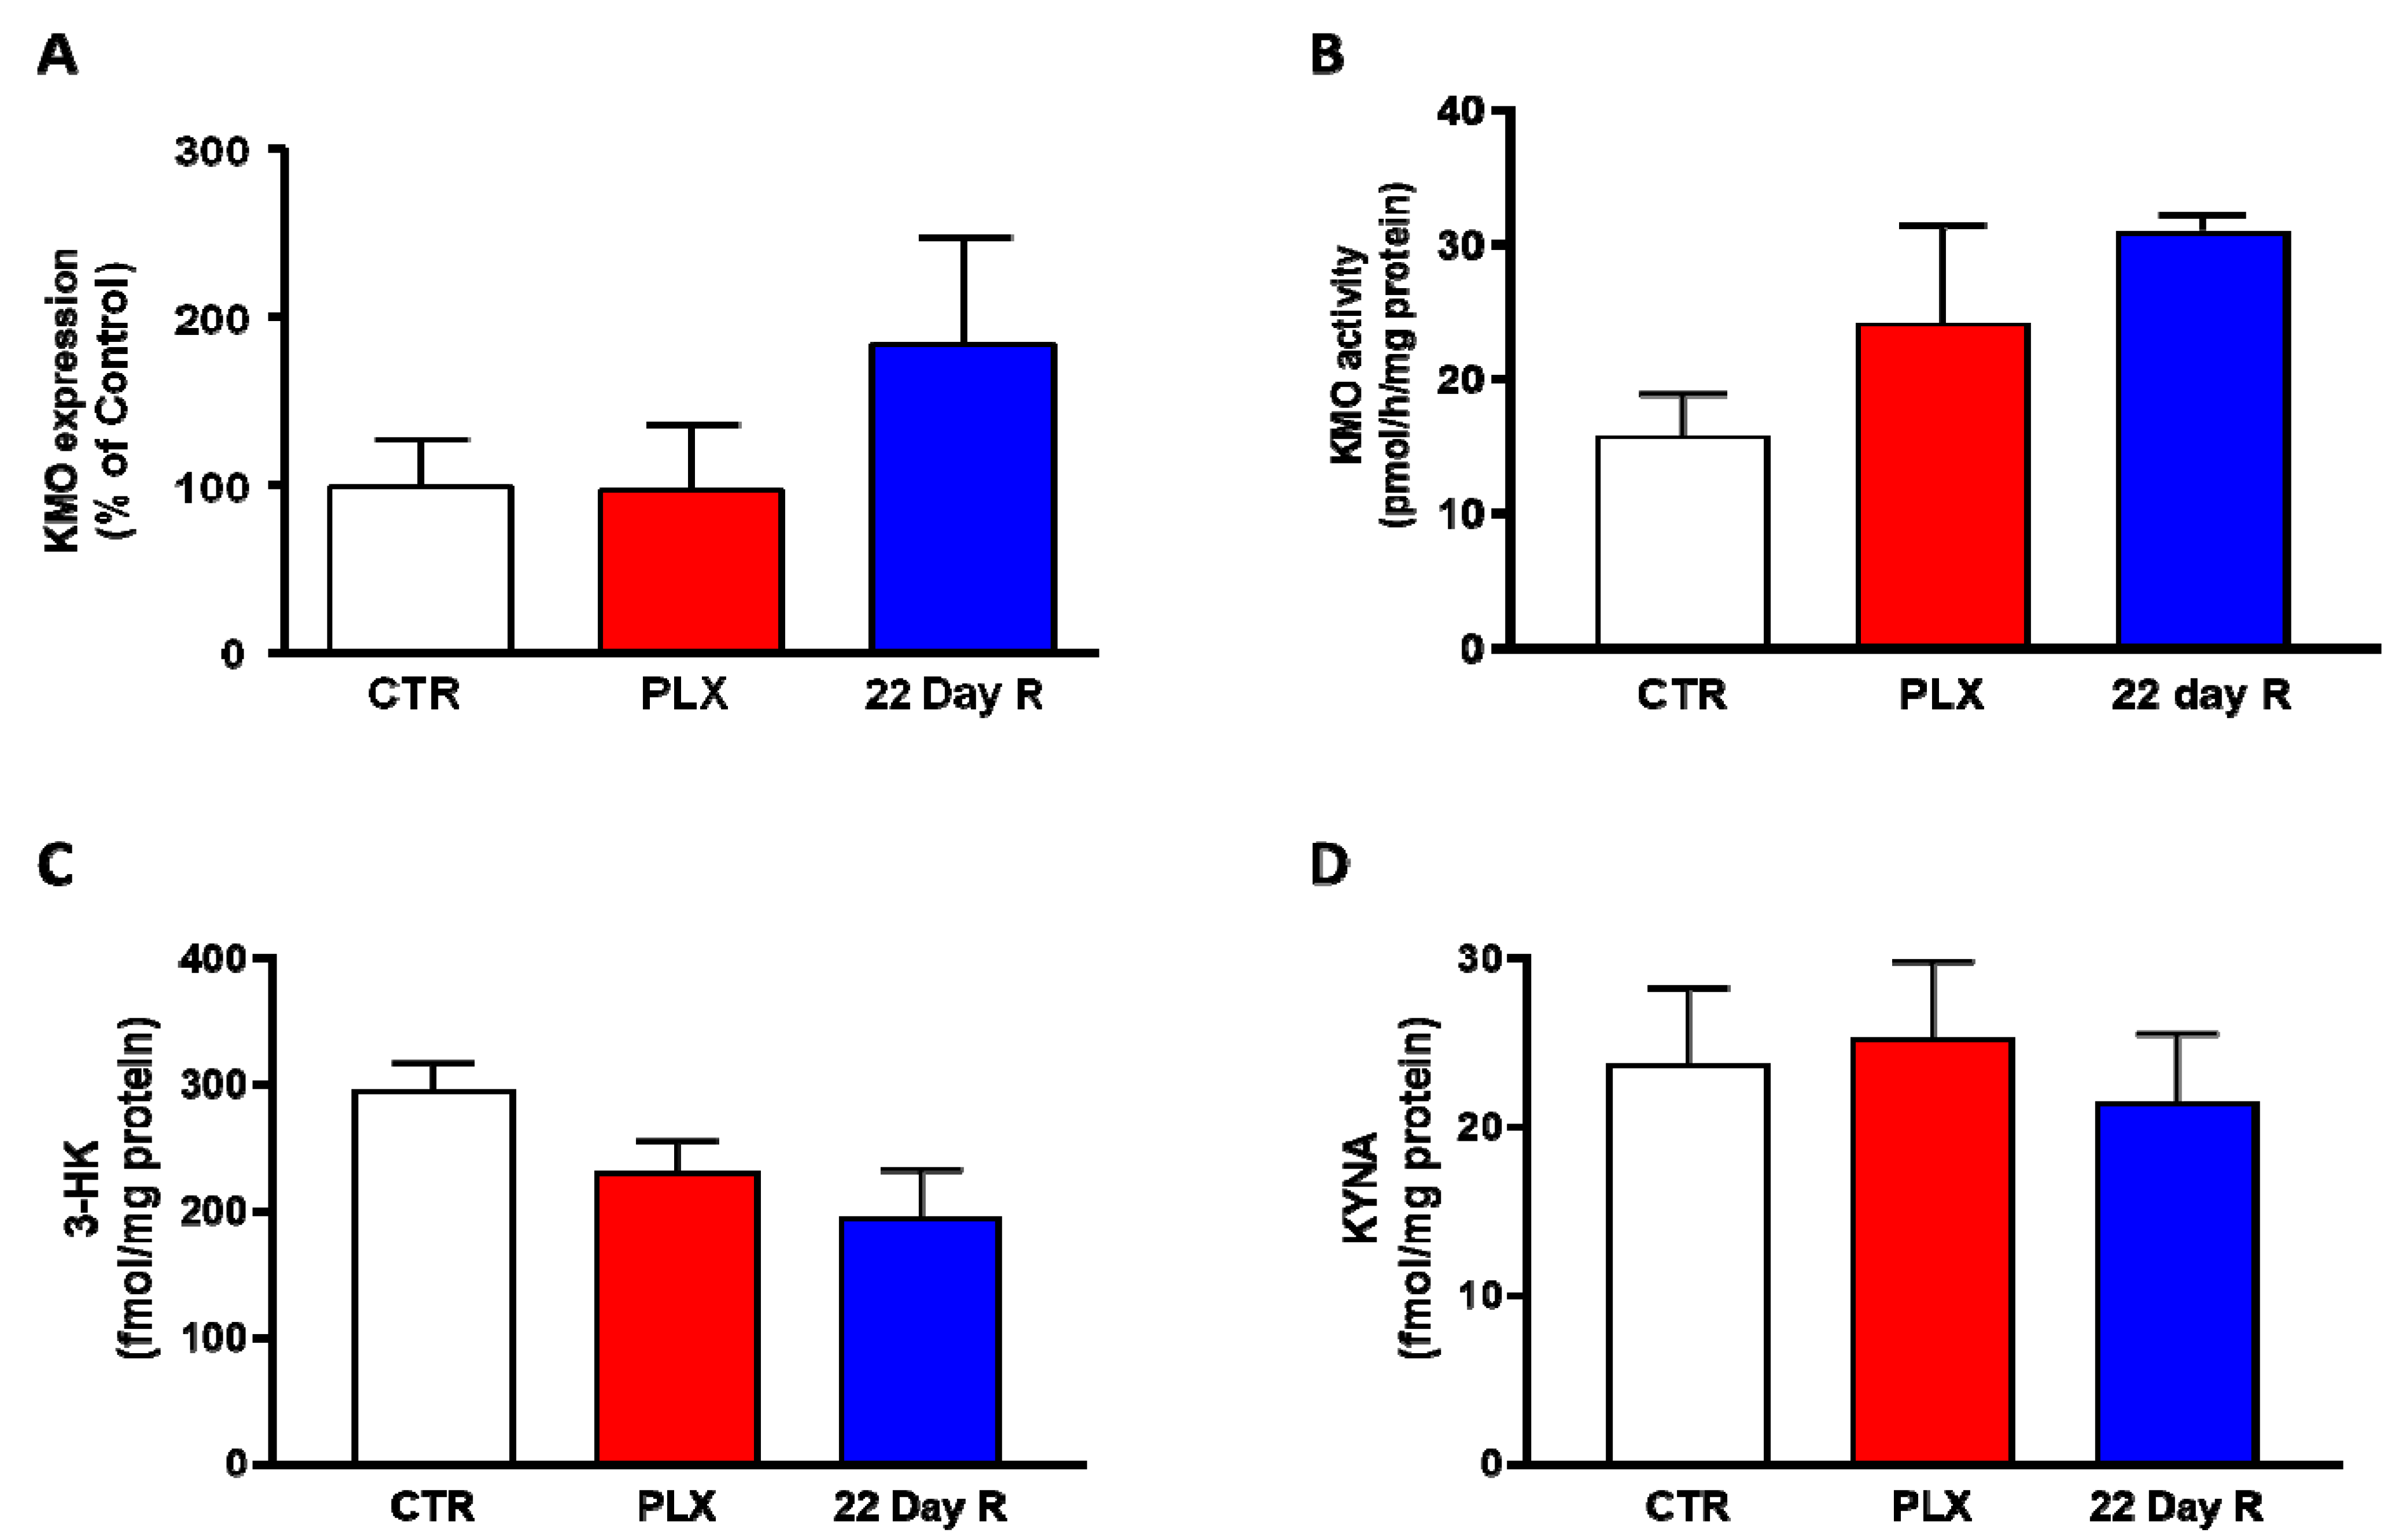
Figure 3. Effect of PLX5622 (PLX) on Kmo expression (A), KMO activity (B), 3-HK levels (C) and KYNA levels (D) in the forebrain of the same wild-type mice used to examine microglial marker genes (same n/group as in Figure 2). Data are the mean ± SEM. See text for experimental details. Kruskal–Wallis test, with Dunn’s test for multiple pairwise comparisons, revealed no significant group differences (p > 0.05).
3. Effect of PLX5622 Treatment in R6/2 Mice
Researchers next examined the effect of prolonged PLX5622 treatment of R6/2 mice, a well-established animal model of HD which shows pronounced microglial activation [24]. As reported earlier [25] and confirmed here, KMO activity was significantly elevated in the brain in R6/2 mice compared to wild-type controls. However, PLX5622 had no effect on KMO activity, 3-HK and KYNA levels in the forebrain of either wild-type or R6/2 mice (all p > 0.05; Figure 4A–C). In agreement with the results obtained in normal mice (cf. Figure 3), PLX5622 also failed to influence KMO activity and the tissue concentrations of 3-HK and KYNA in the forebrain of the respective control animals (Figure 4A–C).
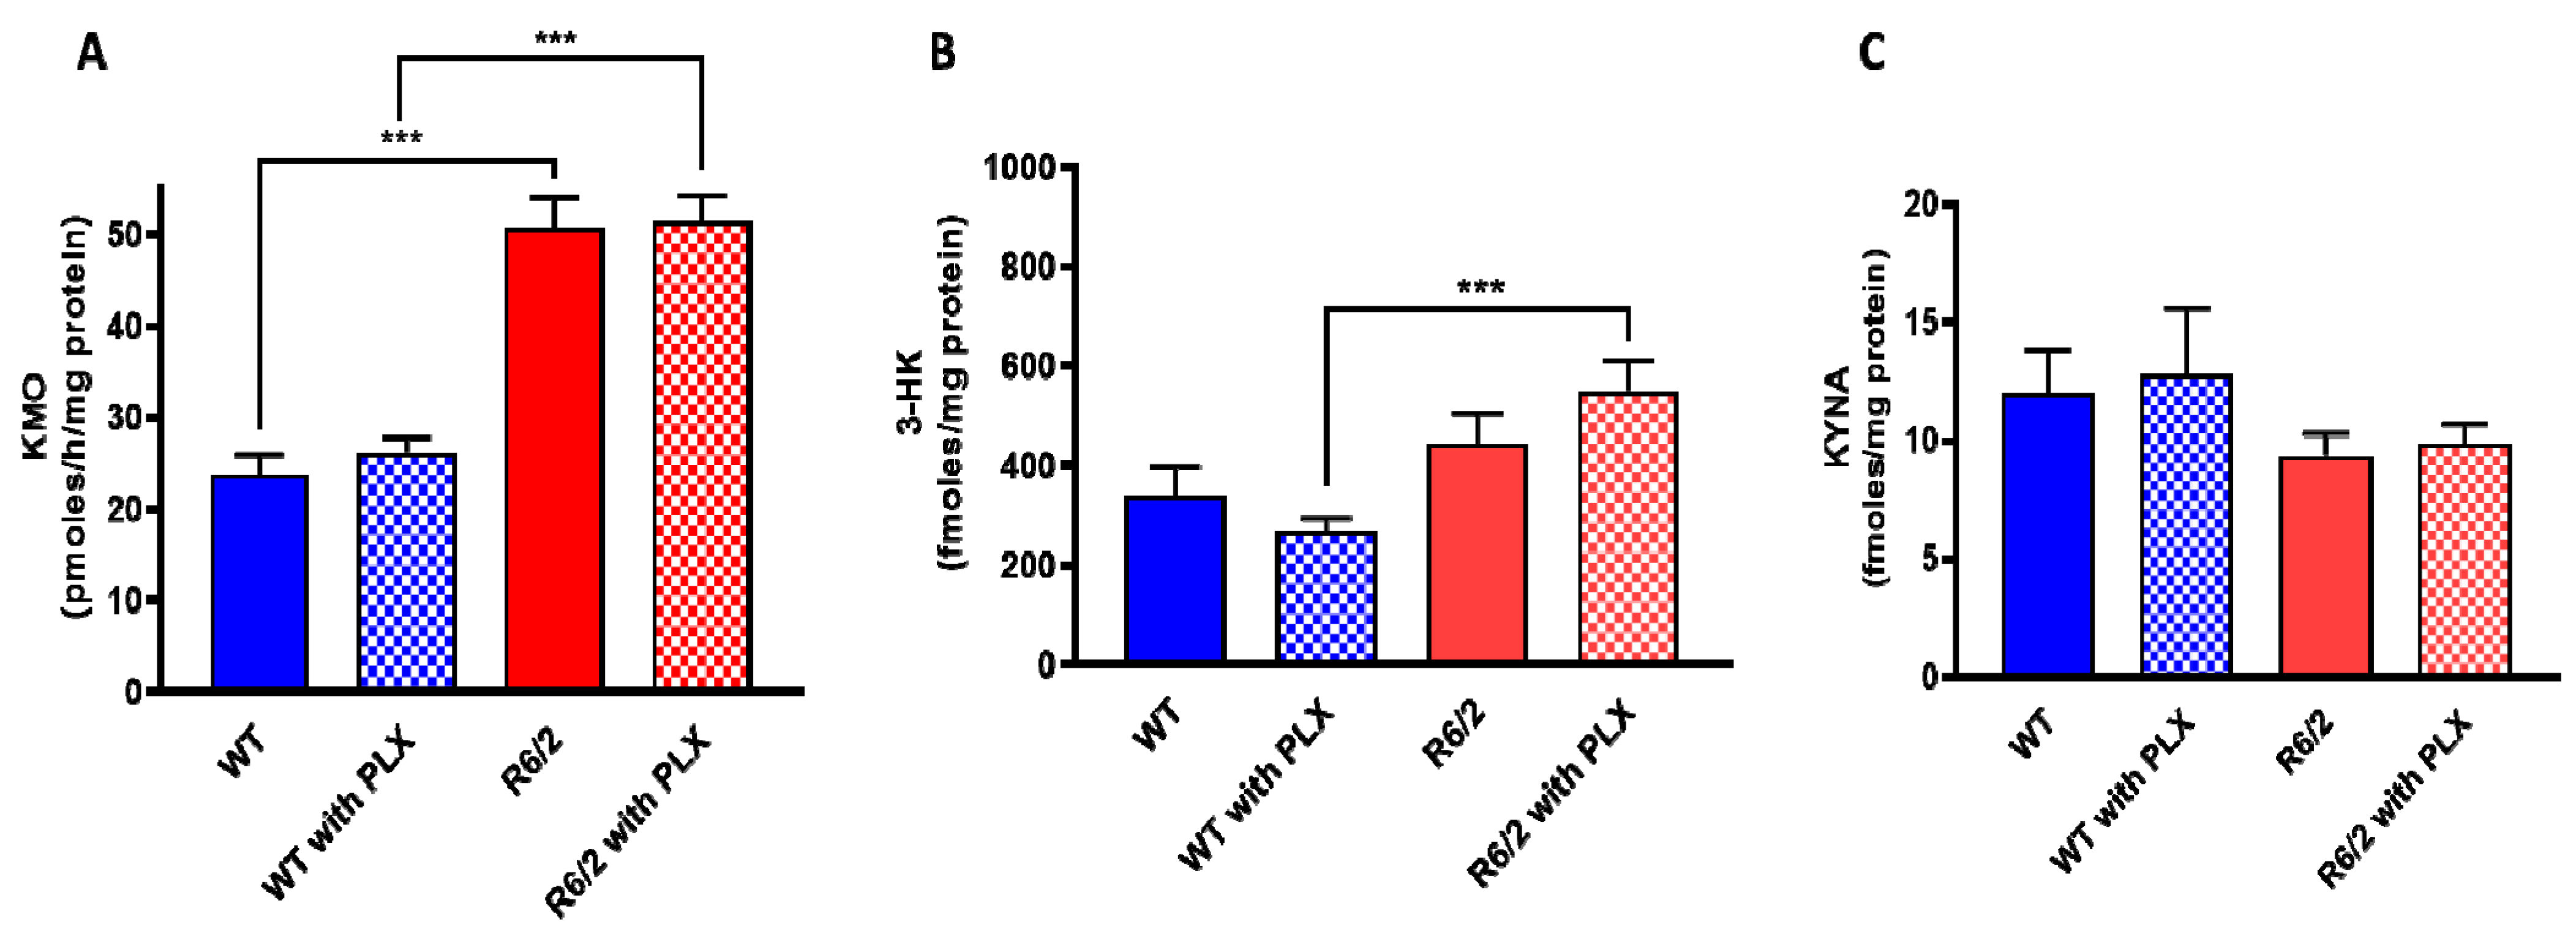
Figure 4. Effect of PLX5622 (PLX) on KMO activity (A), 3-HK (B) and KYNA (C) levels in the forebrain of wild-type (WT) and R6/2 mice. Data are the mean ± SEM (n = 10 per group). See text for experimental details. *** p < 0.001 (Kruskal–Wallis test with Dunn’s test for multiple pairwise comparisons).
4. Kmo Expression and KMO Protein in Freshly Isolated Brain Cells
In light of the unexpected failure to affect Kmo expression and activity, as well as 3-HK and KYNA levels, by experimentally depleting the vast majority of microglial cells in the brain in vivo, researchers decided to magnetically separate astrocytes, microglia, and neurons from whole mouse brain to examine the presence of KMO in each cell type. The purity of the freshly isolated cells was evaluated with specific surface markers for astrocytes (GLAST-PE), microglia (CD11b-PE) and neurons (CD24-APC). As illustrated in Figure 5A–C, the purity obtained using this procedure was 94.5 ± 1.0% for astrocytes, 92.5 ± 0.8% for microglia, and 95.7 ± 1.7% for neurons. Notably, microglia and neurons showed substantial Kmo expression, whereas no signal was detected in astrocytes (Figure 5D).
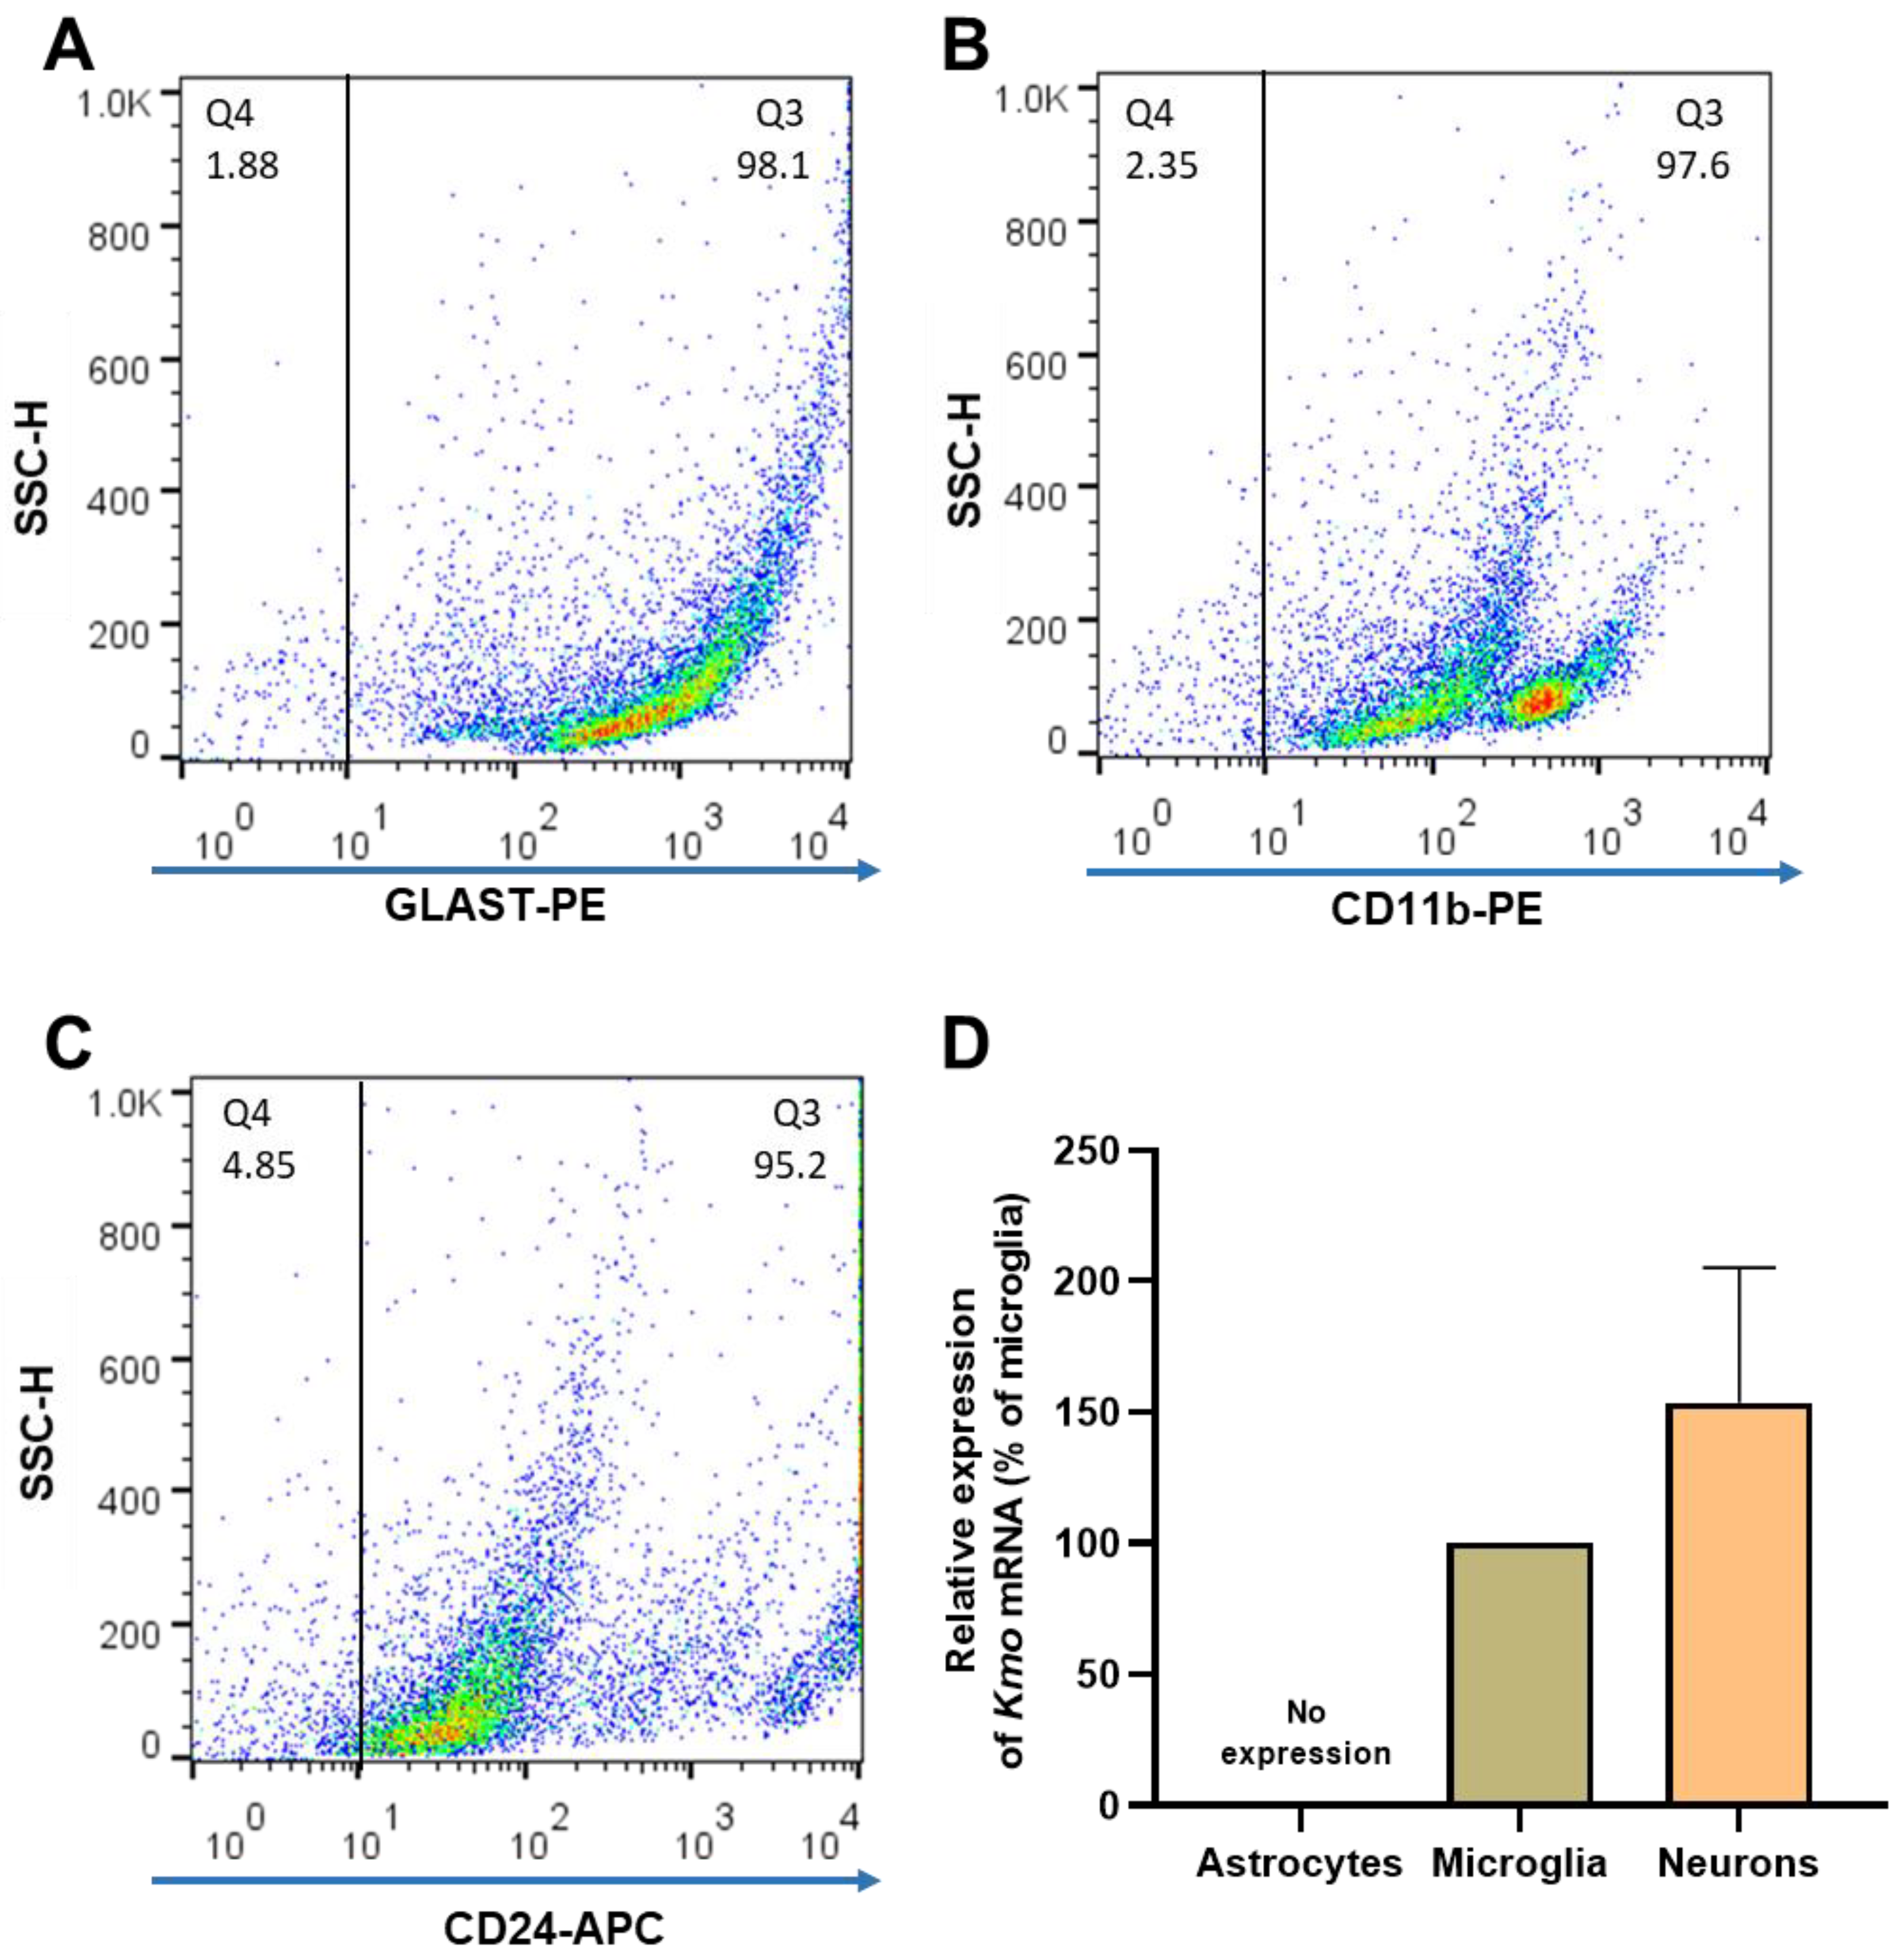
Figure 5. (A–C) Representative dot plots of side scatter height (SSC-H) vs. its corresponding marker, illustrating the purity of brain cells that were isolated from 6 separate mouse brains. After magnetic cell separation, the purity of astrocytes (GLAST-PE+), microglia (CD11b-PE+) and neurons (CD24-APC+) was evaluated by flow cytometry; (D) Kmo mRNA, determined by RT-qPCR. Data are the mean ± SEM. See text for experimental details.
Next, KMO protein in these cells was examined by flow cytometry and immunofluorescence. In line with the Kmo mRNA expression data described above, double-staining revealed that less than 4% of GLAST+ cells, i.e., astrocytes, were KMO-positive (Figure 6A) whereas KMO was present in 95% of CD11b+ (Figure 6B) and 90% of CD24+ (Figure 6C) cells. Representative microscopic images of the cells, using anti-CD11b-PE, anti-NeuN-Alexa 488 and anti-GFAP-Cy3 antibodies to selectively stain microglia, neurons and astrocytes, respectively, are shown in Figure 7.
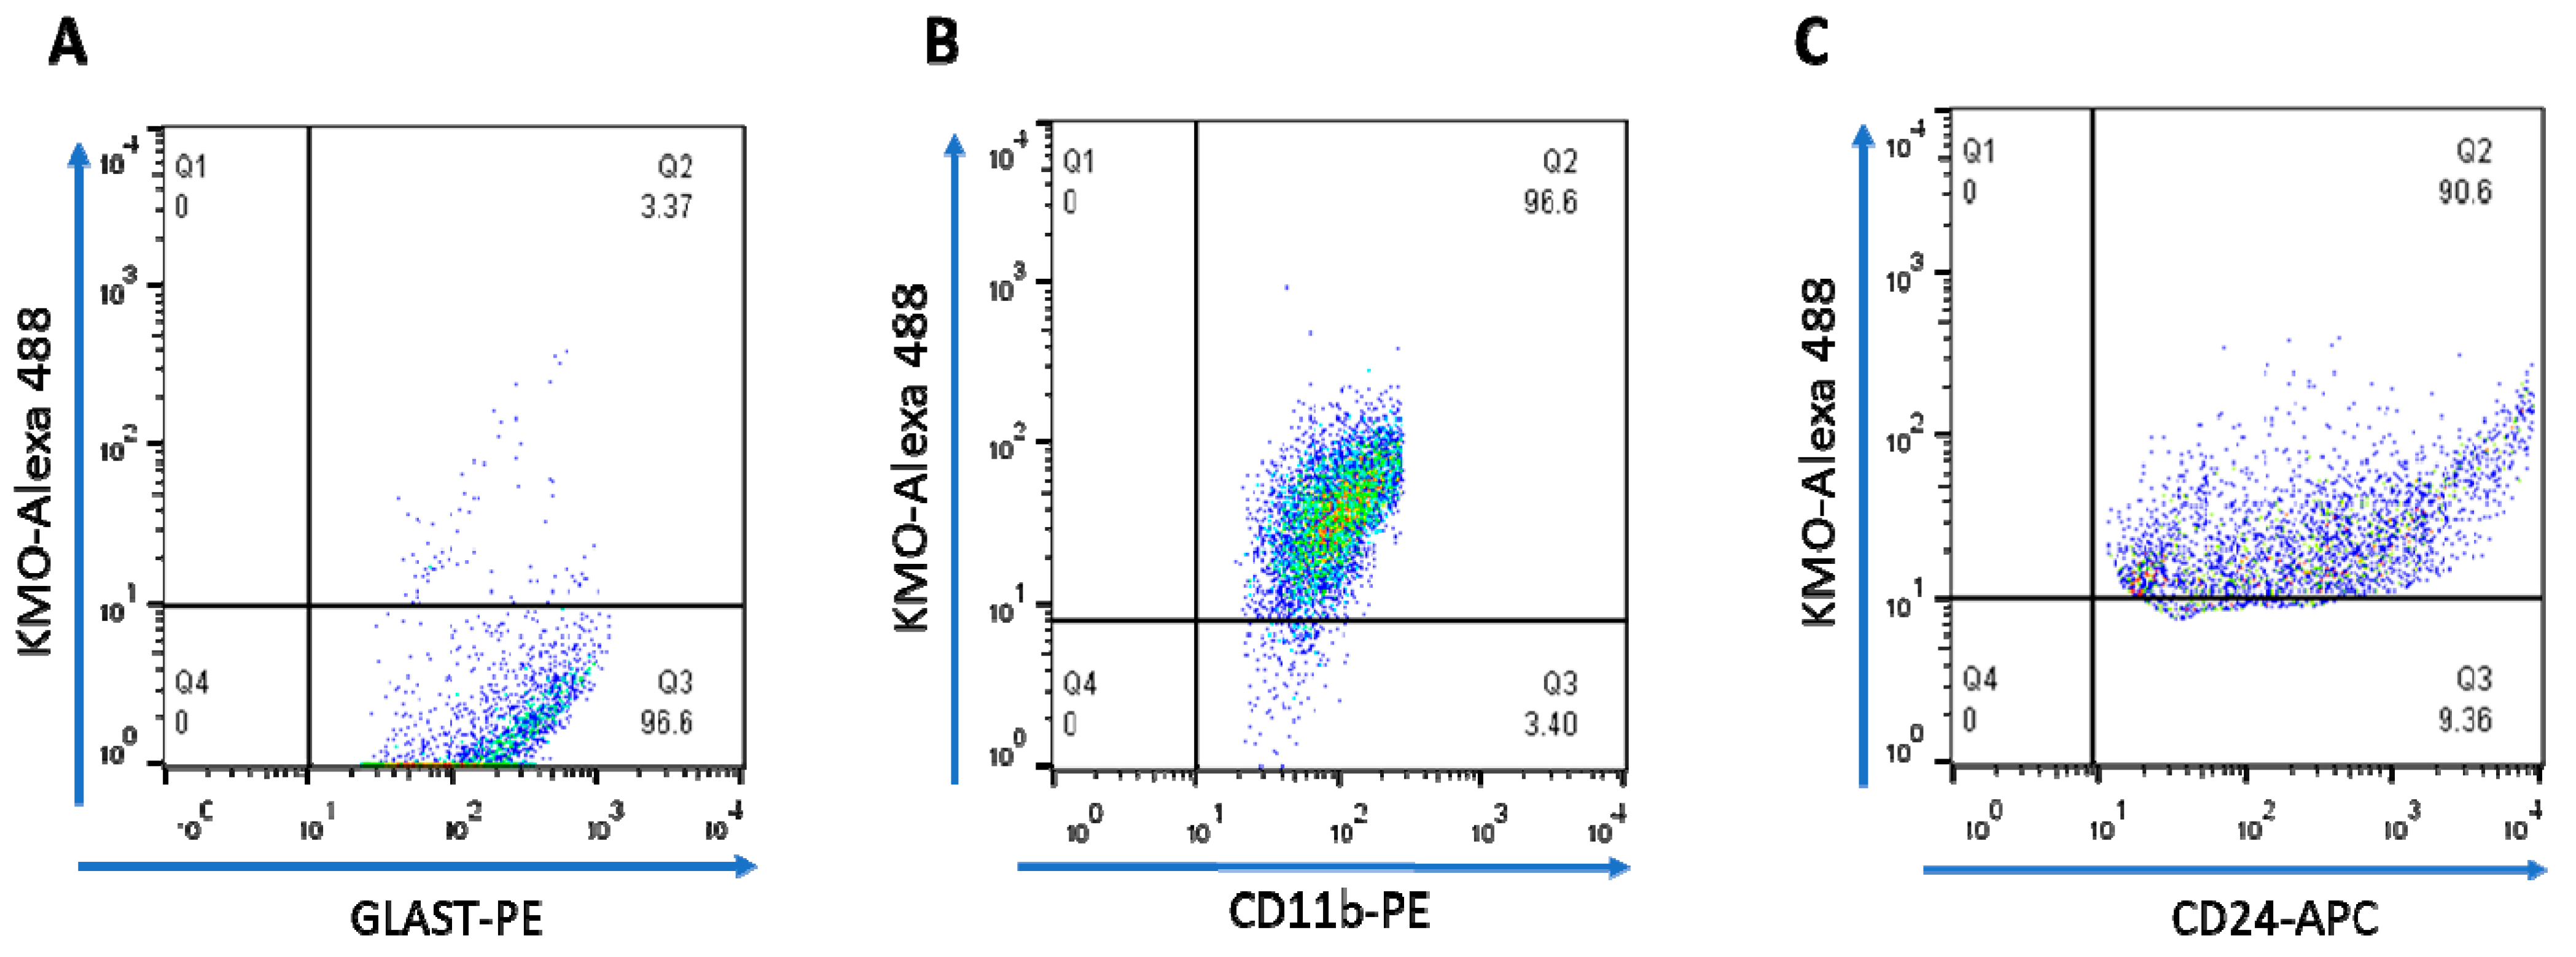
Figure 6. Dot plots illustrating intracellular staining of KMO protein in purified brain cells, assessed by FACS. The percentage of KMO+ cells in (A) astrocytes (GLAST-PE), (B) microglia (CD11b-PE) and (C) neurons (CD24-APC) is shown in Q2. See text for experimental details.
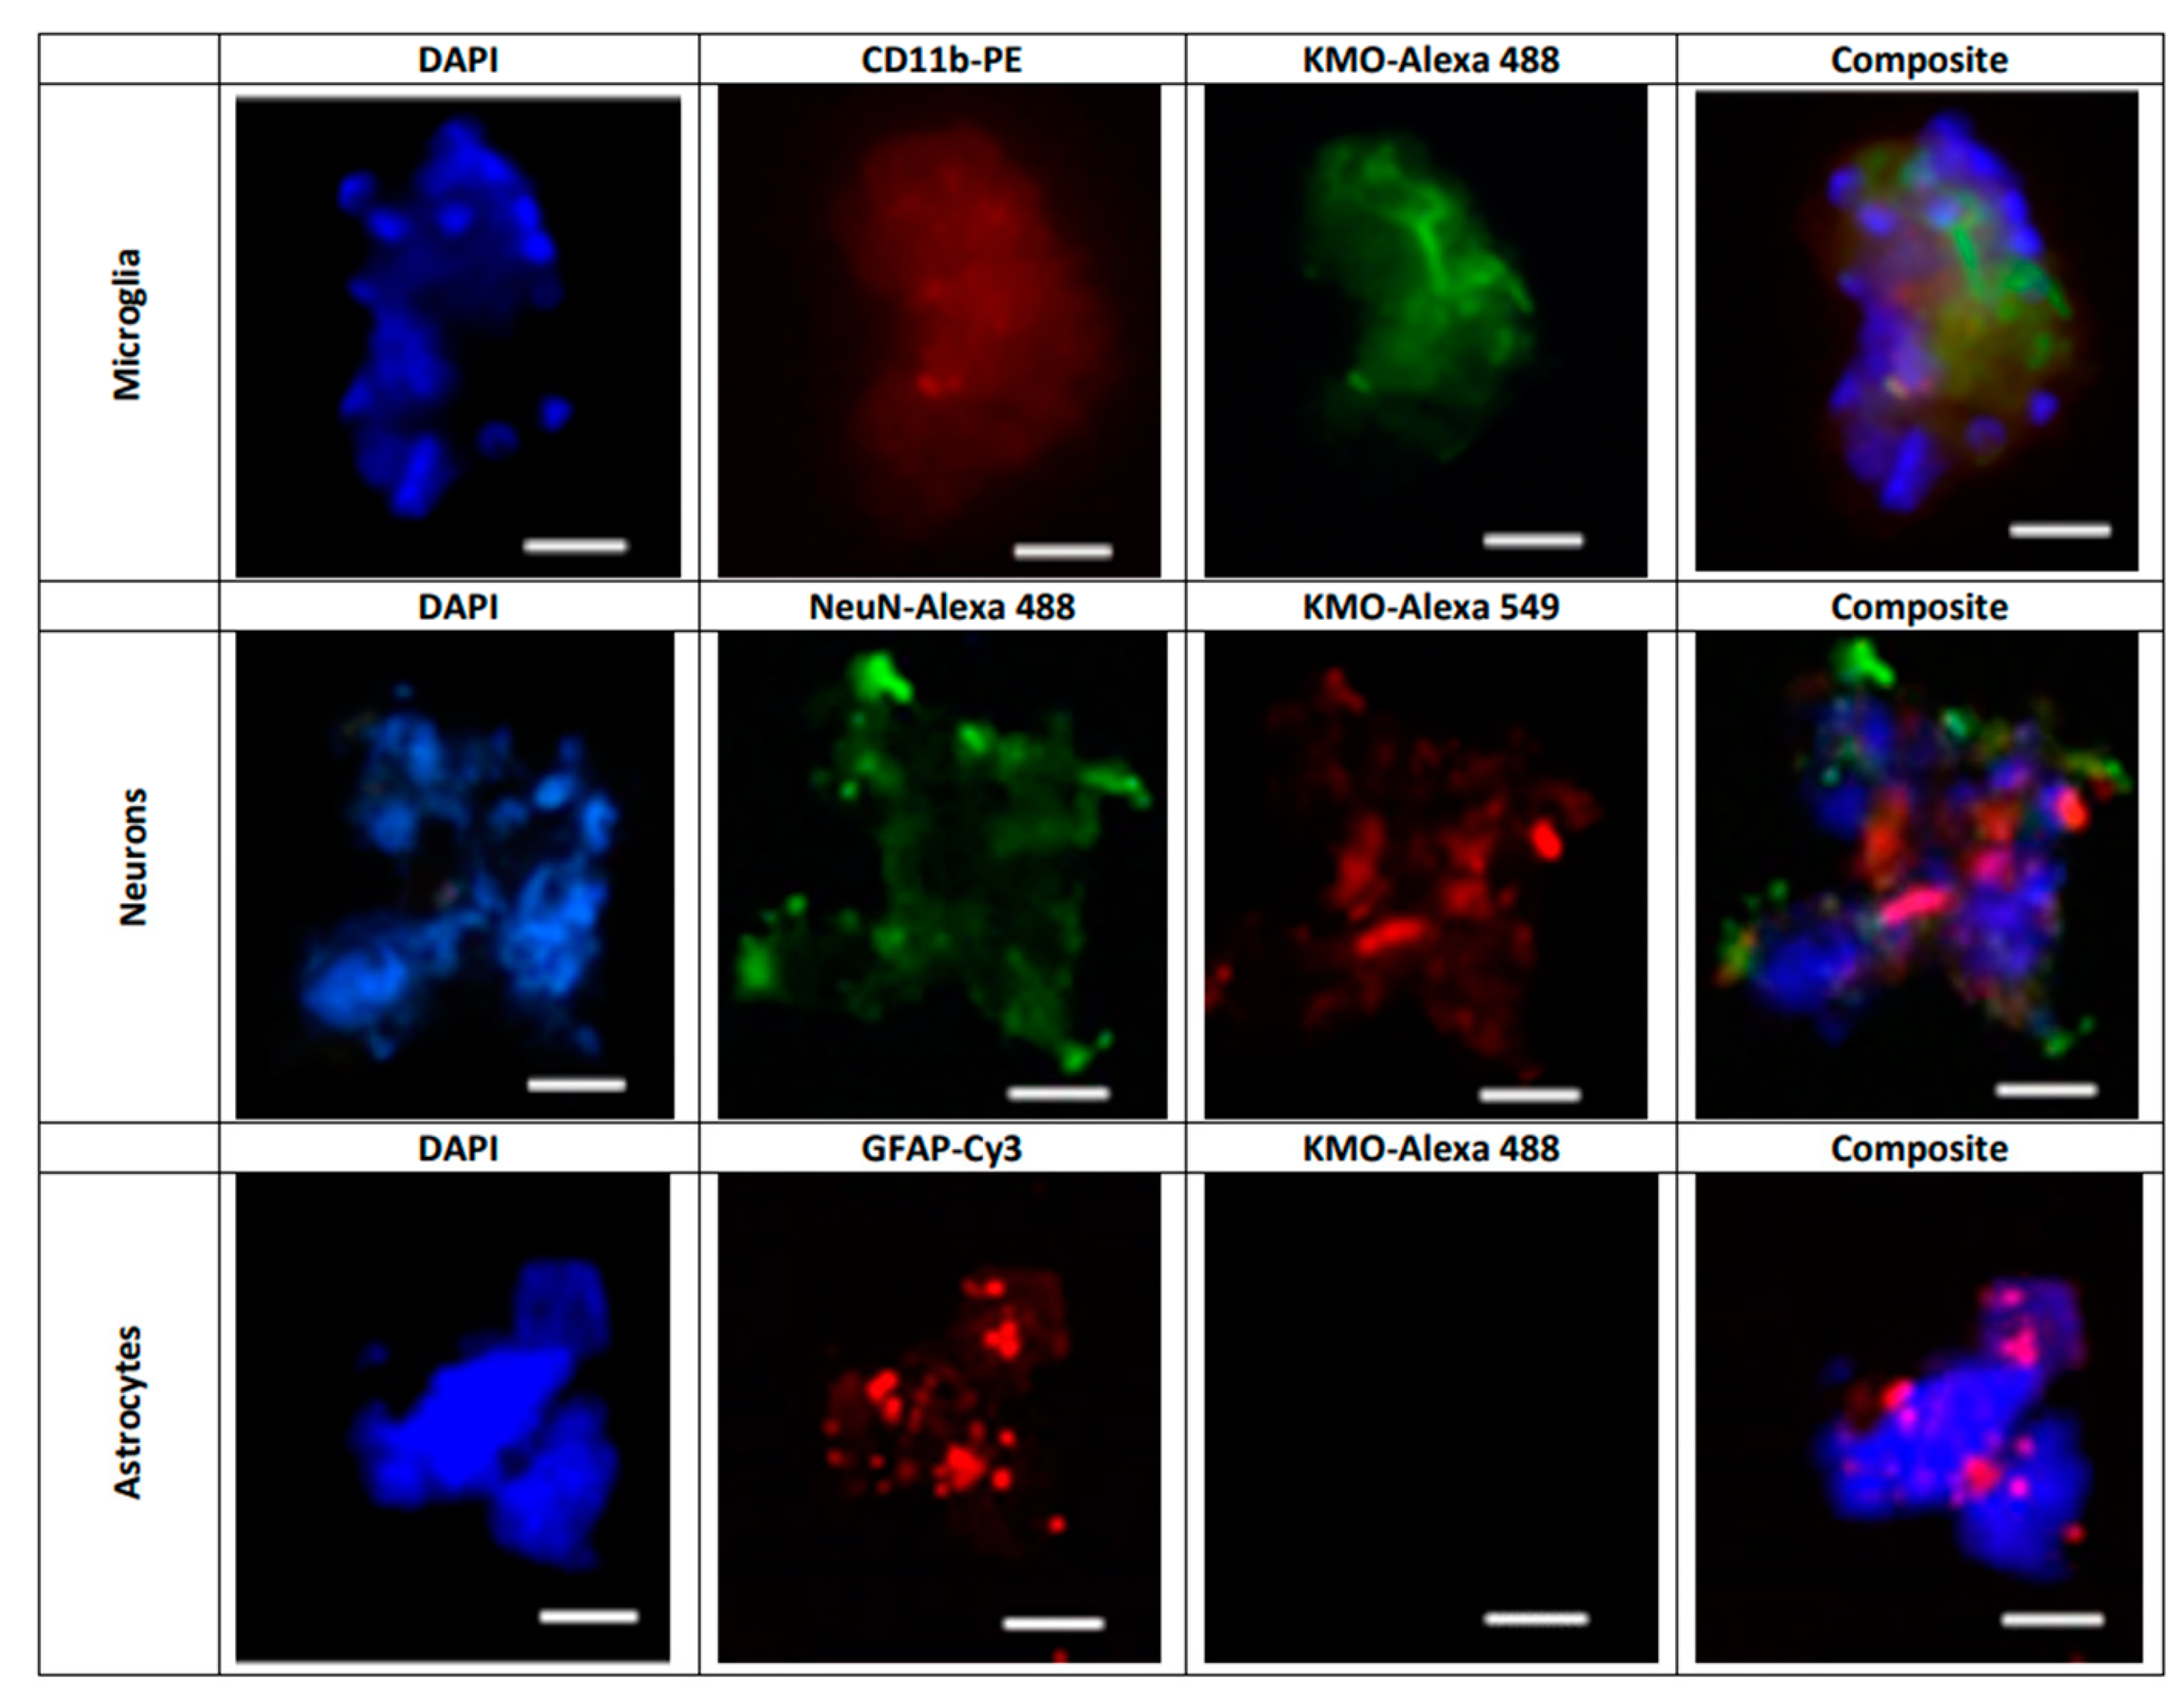
Figure 7. Representative images illustrating the presence of KMO protein in freshly isolated microglial cells (CD11b-PE: red), neurons (NeuN-Alexa 488: green) and astrocytes (GFAP-Cy3; red). Nuclei were stained with DAPI (blue). KMO was identified using anti-rabbit Alexa 488 in microglia and astrocytes, and anti-rabbit Alexa 549 in neurons, as secondary antibodies. See text for experimental details. Images were acquired at 40× magnification. Scale bars: 20 µm.
5. KMO Activity in Freshly Isolated Brain Cells
Researchers next assessed the relative proportion of astrocytes, microglial cells and neurons in whole brain homogenate in order to determine their relative contribution to KMO activity in the normal mouse brain. Using specific markers for each cell type (GFAP and GLAST for astrocytes, CD11b and Iba1 for microglia, and MAP2 for neurons), the percentage of astrocytes was ~30% (GFAP: 34 ± 3%, GLAST: 27 ± 1%), the percentage of microglial cells was ~15% (CD11b: 12 ± 2%, Iba1: 15 ± 1%), and the percentage of neurons was 29 ± 5% (Figure 8A). KMO activity was detectable in microglia and neurons but not in astrocytes. Notably, specific enzyme activity was significantly higher in neurons than in microglial cells (Figure 8B).
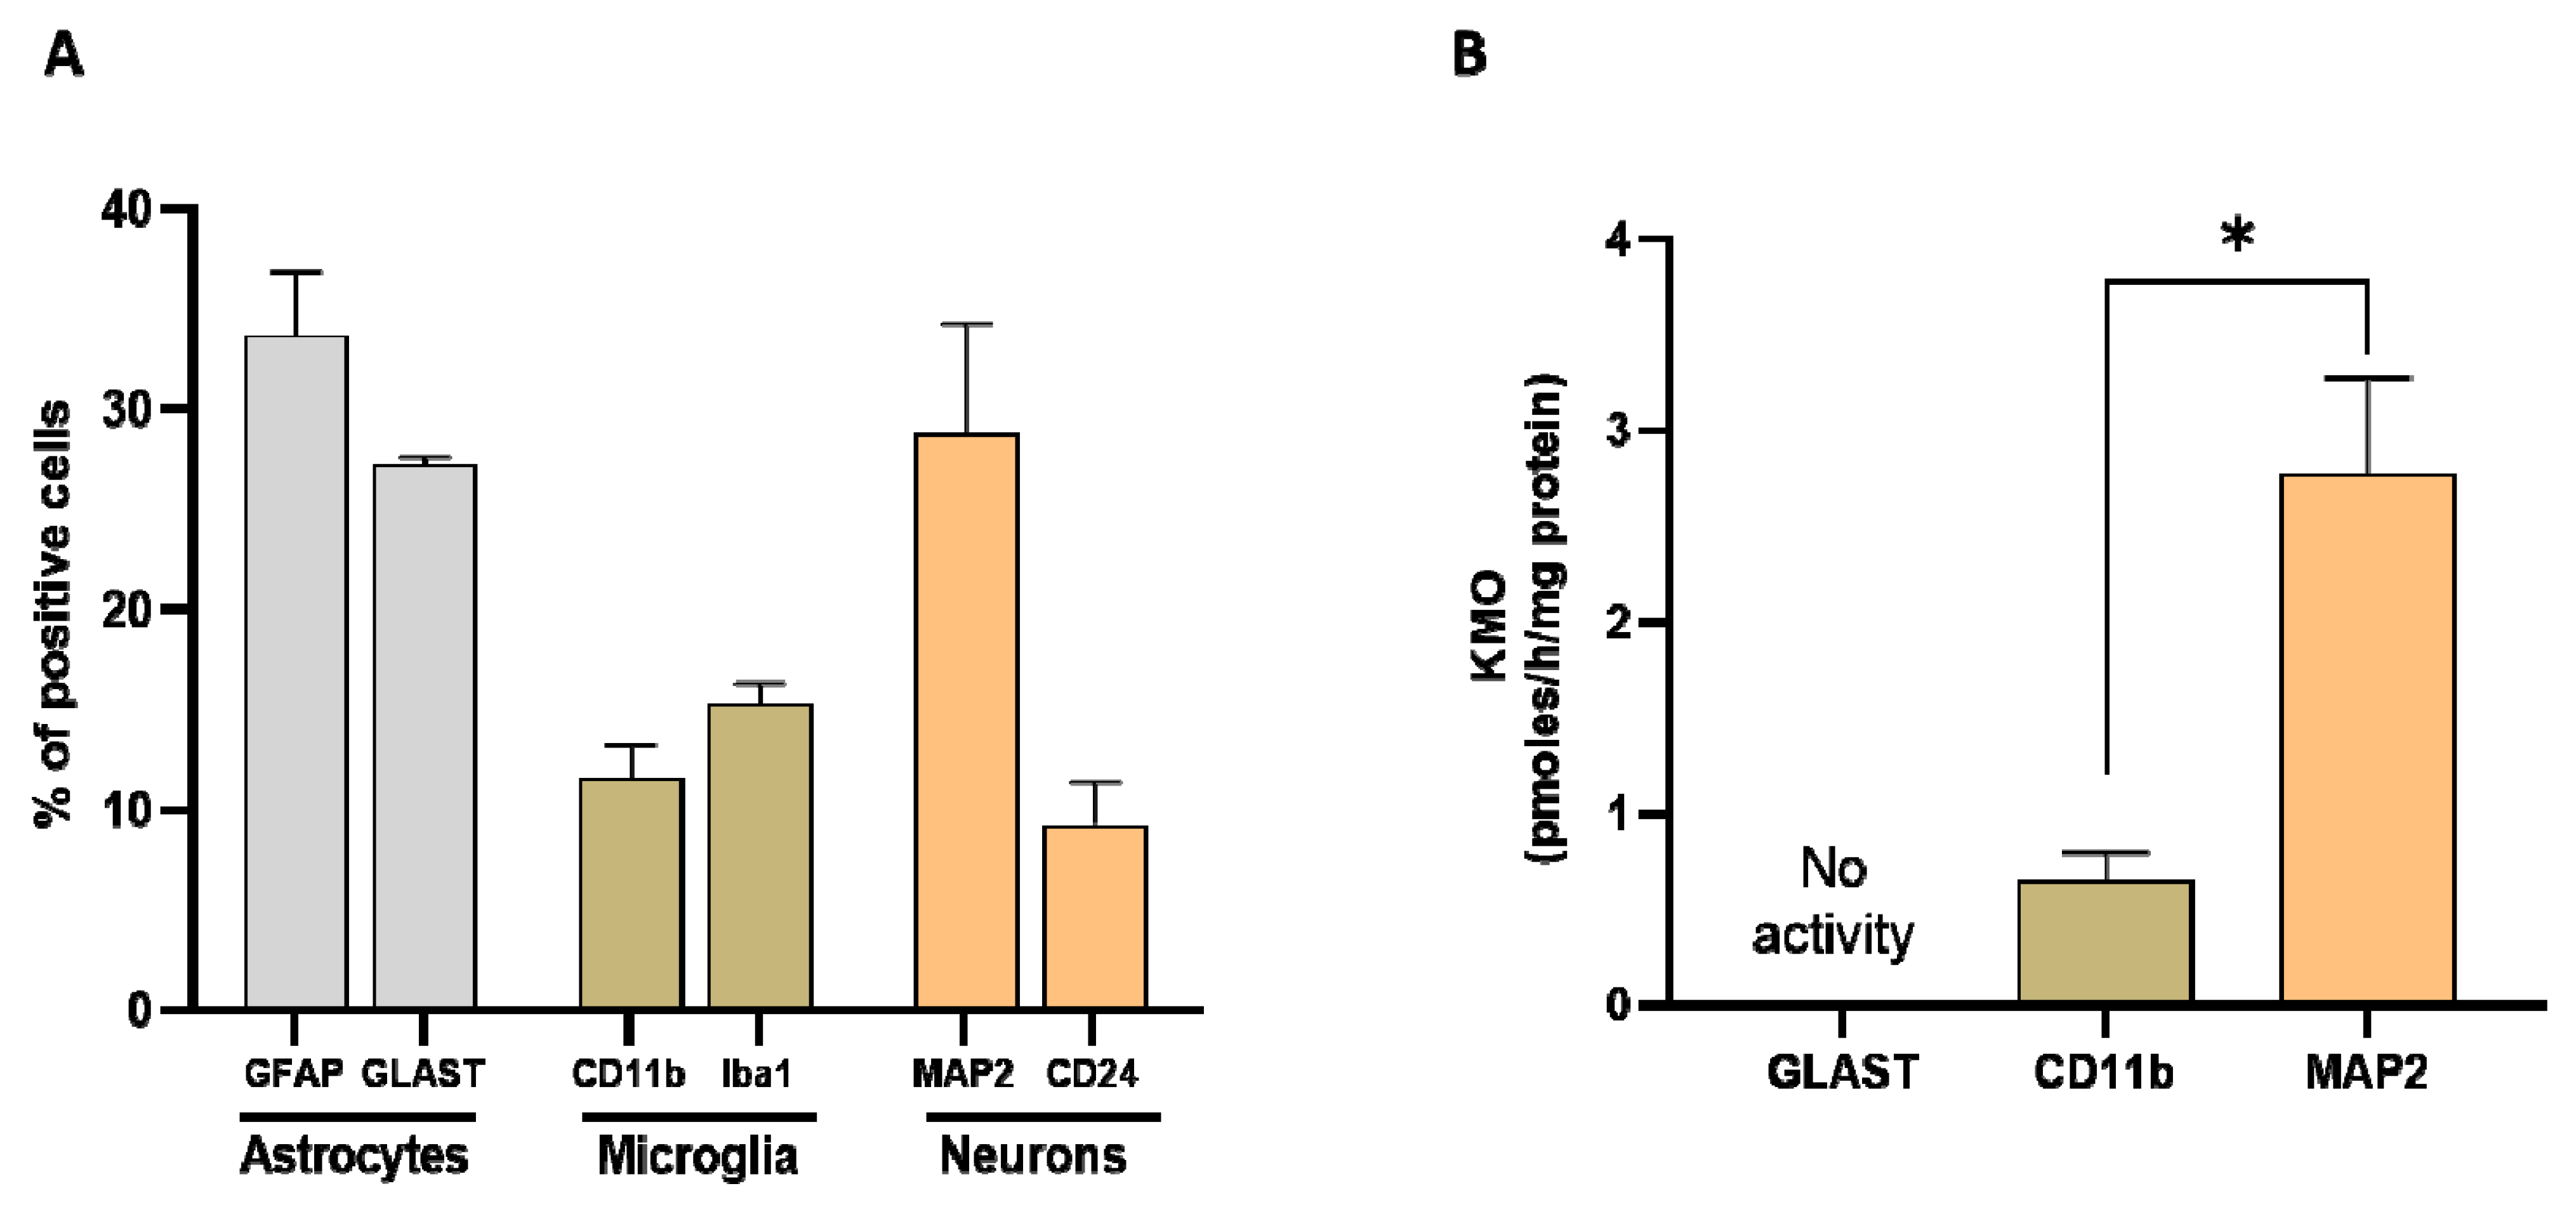
Figure 8. (A) Proportion of astrocytes, microglia, and neurons, assessed in whole mouse brain homogenate (n = 4–6). Cell suspensions were incubated with markers for astrocytes (GFAP and GLAST), microglia (CD11b and Iba1) and neurons (MAP2), respectively. See text for experimental details; (B) KMO activity in isolated cells (>90% purity). Data are the mean ± SEM. * p < 0.01 (Mann–Whitney test).
References
- Mithaiwala, M.N.; Santana-Coelho, D.; Porter, G.A.; O’Connor, J.C. Neuroinflammation and the kynurenine pathway in CNS disease: Molecular mechanisms and therapeutic implications. Cells 2021, 10, 1548.
- Okamoto, H.; Hayaishi, O. Flavin adenine dinucleotide requirement for kynurenine hydroxylase of rat liver mitochondria. Biochem. Biophys. Res. Commun. 1967, 29, 394–399.
- Hirai, K.; Kuroyanagi, H.; Tatebayashi, Y.; Hayashi, Y.; Hirabayashi-Takahashi, K.; Saito, K.; Haga, S.; Uemura, T.; Izumi, S. Dual role of the carboxyl-terminal region of pig liver L-kynurenine 3-monooxygenase: Mitochondrial-targeting signal and enzymatic activity. J. Biochem. 2010, 148, 639–650.
- Quan, G.X.; Kim, I.; Komoto, N.; Sezutsu, H.; Ote, M.; Shimada, T.; Kanda, T.; Mita, K.; Kobayashi, M.; Tamura, T. Characterization of the kynurenine 3-monooxygenase gene corresponding to the white egg 1 mutant in the silkworm Bombyx mori. Mol. Genet. Genom. 2002, 267, 1–9.
- Maddison, D.C.; Alfonso-Nunez, M.; Swaih, A.M.; Breda, C.; Campesan, S.; Allcock, N.; Straatman-Iwanowska, A.; Kyriacou, C.P.; Giorgini, F. A novel role for kynurenine 3-monooxygenase in mitochondrial dynamics. PLoS Genet. 2020, 16, e1009129.
- Saito, K.; Quearry, B.J.; Saito, M.; Nowak, T.S., Jr.; Markey, S.P.; Heyes, M.P. Kynurenine 3-hydroxylase in brain: Species activity differences and effect of gerbil cerebral ischemia. Arch Biochem. Biophys 1993, 307, 104–109.
- De Castro, F.T.; Brown, R.R.; Price, J.M. The intermediary metabolism of tryptophan by cat and rat tissue preparations. J. Biol. Chem. 1957, 228, 777–784.
- Schwarcz, R.; Stone, T.W. The kynurenine pathway and the brain: Challenges, controversies and promises. Neuropharmacology 2017, 112, 237–247.
- Schwarcz, R.; Bruno, J.P.; Muchowski, P.J.; Wu, H.Q. Kynurenines in the mammalian brain: When physiology meets pathology. Nat. Rev. Neurosci. 2012, 13, 465–477.
- Parrott, J.M.; O’Connor, J.C. Kynurenine 3-monooxygenase: An influential mediator of neuropathology. Front. Psychiatry 2015, 6, 116.
- Erhardt, S.; Schwieler, L.; Imbeault, S.; Engberg, G. The kynurenine pathway in schizophrenia and bipolar disorder. Neuropharmacology 2017, 112, 297–306.
- Zhang, S.; Collier, M.E.W.; Heyes, D.J.; Giorgini, F.; Scrutton, N.S. Advantages of brain penetrating inhibitors of kynurenine-3-monooxygenase for treatment of neurodegenerative diseases. Arch Biochem. Biophys. 2021, 697, 108702.
- Alberati-Giani, D.; Ricciardi-Castagnoli, P.; Köhler, C.; Cesura, A.M. Regulation of the kynurenine metabolic pathway by interferon-gamma in murine cloned macrophages and microglial cells. J. Neurochem. 1996, 66, 996–1004.
- Guillemin, G.J.; Kerr, S.J.; Smythe, G.A.; Smith, D.G.; Kapoor, V.; Armati, P.J.; Croitoru, J.; Brew, B.J. Kynurenine pathway metabolism in human astrocytes: A paradox for neuronal protection. J. Neurochem. 2001, 78, 842–853.
- Giorgini, F.; Möller, T.; Kwan, W.; Zwilling, D.; Wacker, J.L.; Hong, S.; Tsai, L.C.; Cheah, C.S.; Schwarcz, R.; Guidetti, P.; et al. Histone deacetylase inhibition modulates kynurenine pathway activation in yeast, microglia, and mice expressing a mutant huntingtin fragment. J. Biol. Chem. 2008, 283, 7390–7400.
- Heyes, M.P.; Saito, K.; Major, E.O.; Milstien, S.; Markey, S.P.; Vickers, J.H. A mechanism of quinolinic acid formation by brain in inflammatory neurological disease. Attenuation of synthesis from L-tryptophan by 6-chlorotryptophan and 4-chloro-3-hydroxyanthranilate. Brain 1993, 116, 1425–1450.
- Connor, T.J.; Starr, N.; O’Sullivan, J.B.; Harkin, A. Induction of indolamine 2,3-dioxygenase and kynurenine 3-monooxygenase in rat brain following a systemic inflammatory challenge: A role for IFN-gamma? Neurosci. Lett. 2008, 441, 29–34.
- Corona, A.W.; Huang, Y.; O’Connor, J.C.; Dantzer, R.; Kelley, K.W.; Popovich, P.G.; Godbout, J.P. Fractalkine receptor (CX3CR1) deficiency sensitizes mice to the behavioral changes induced by lipopolysaccharide. J. Neuroinflamm. 2010, 7, 93.
- Garrison, A.M.; Parrott, J.M.; Tunon, A.; Delgado, J.; Redus, L.; O’Connor, J.C. Kynurenine pathway metabolic balance influences microglia activity: Targeting kynurenine monooxygenase to dampen neuroinflammation. Psychoneuroendocrinology 2018, 94, 1–10.
- Chiarugi, A.; Cozzi, A.; Ballerini, C.; Massacesi, L.; Moroni, F. Kynurenine 3-mono-oxygenase activity and neurotoxic kynurenine metabolites increase in the spinal cord of rats with experimental allergic encephalomyelitis. Neuroscience 2001, 102, 687–695.
- Guillemin, G.J.; Cullen, K.M.; Lim, C.K.; Smythe, G.A.; Garner, B.; Kapoor, V.; Takikawa, O.; Brew, B.J. Characterization of the kynurenine pathway in human neurons. J. Neurosci. 2007, 27, 12884–12892.
- Castellano-Gonzalez, G.; Jacobs, K.R.; Don, E.; Cole, N.J.; Adams, S.; Lim, C.K.; Lovejoy, D.B.; Guillemin, G.J. Kynurenine 3-monooxygenase activity in human primary neurons and effect on cellular bioenergetics identifies new neurotoxic mechanisms. Neurotox. Res. 2019, 35, 530–541.
- Laumet, G.; Zhou, W.; Dantzer, R.; Edralin, J.D.; Huo, X.; Budac, D.P.; O’Connor, J.C.; Lee, A.W.; Heijnen, C.J.; Kavelaars, A. Upregulation of neuronal kynurenine 3-monooxygenase mediates depression-like behavior in a mouse model of neuropathic pain. Brain Behav. Immun. 2017, 66, 94–102.
- Paldino, E.; Balducci, C.; La Vitola, P.; Artioli, L.; D’Angelo, V.; Giampa, C.; Artuso, V.; Forloni, G.; Fusco, F.R. Neuroprotective effects of doxycycline in the R6/2 mouse model of Huntington’s disease. Mol. Neurobiol. 2020, 57, 1889–1903.
- Sathyasaikumar, K.V.; Stachowski, E.K.; Amori, L.; Guidetti, P.; Muchowski, P.J.; Schwarcz, R. Dysfunctional kynurenine pathway metabolism in the R6/2 mouse model of Huntington’s disease. J Neurochem. 2010, 113, 1416–1425.
More
Information
Subjects:
Agriculture, Dairy & Animal Science
Contributor
MDPI registered users' name will be linked to their SciProfiles pages. To register with us, please refer to https://encyclopedia.pub/register
:
View Times:
1.1K
Revisions:
2 times
(View History)
Update Date:
01 Mar 2022
Notice
You are not a member of the advisory board for this topic. If you want to update advisory board member profile, please contact office@encyclopedia.pub.
OK
Confirm
Only members of the Encyclopedia advisory board for this topic are allowed to note entries. Would you like to become an advisory board member of the Encyclopedia?
Yes
No
${ textCharacter }/${ maxCharacter }
Submit
Cancel
Back
Comments
${ item }
|
More
No more~
There is no comment~
${ textCharacter }/${ maxCharacter }
Submit
Cancel
${ selectedItem.replyTextCharacter }/${ selectedItem.replyMaxCharacter }
Submit
Cancel
Confirm
Are you sure to Delete?
Yes
No


