 +1 credit
| Version | Summary | Created by | Modification | Content Size | Created at | Operation |
|---|---|---|---|---|---|---|
| 1 | Kadir Gunaydin | + 3104 word(s) | 3104 | 2022-02-23 03:51:48 | | | |
| 2 | Bruce Ren | + 1 word(s) | 3105 | 2022-02-28 03:11:08 | | |
Video Upload Options
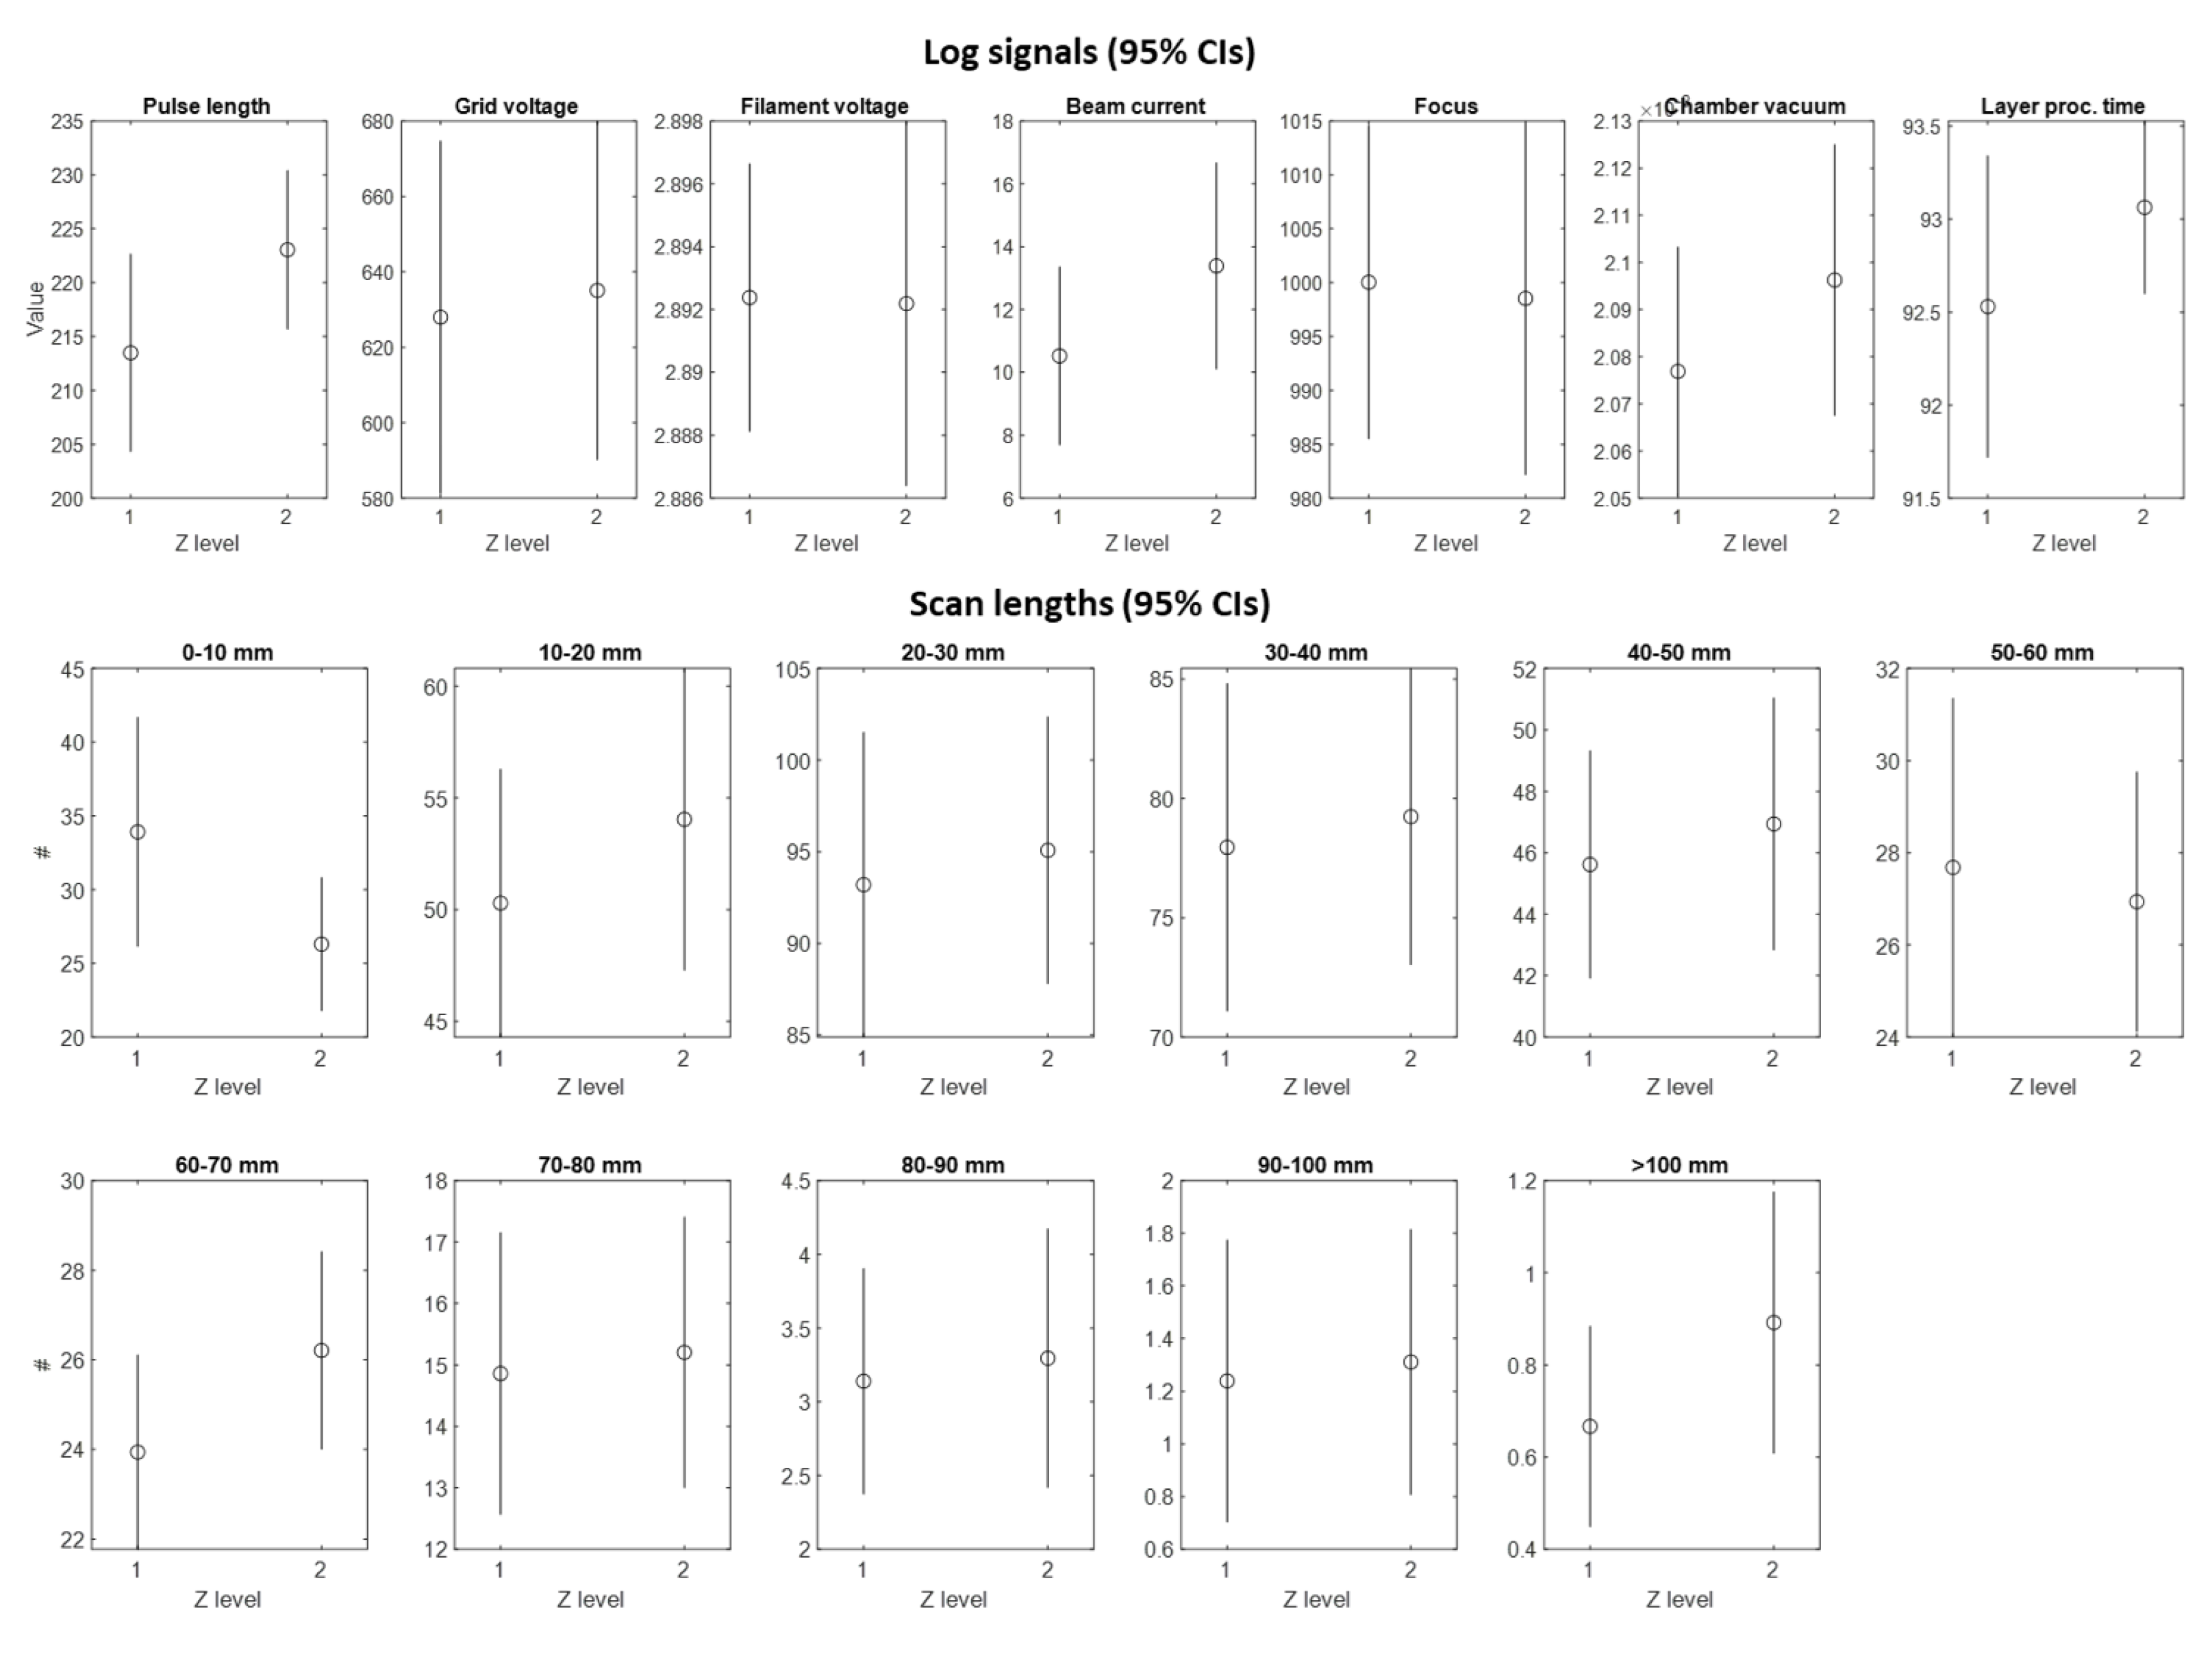
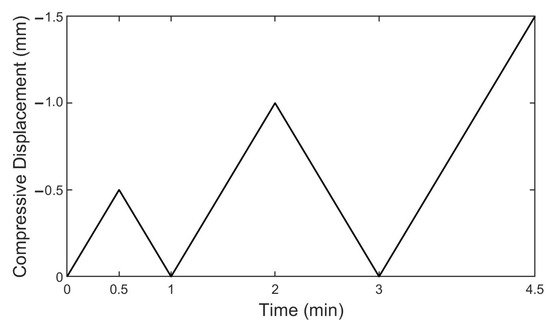
For material characterization and understanding the material behavior of EBM printed parts, tensile and three-point flexural tests are conducted. Log signals produced during the EBM process are investigated to confirm the stability of the process and the health of the produced parts. Furthermore, a compressive cyclic load profile is applied to the EBM printed chiral units having two different thicknesses to track their Poisson's ratios and displacement limits under large displacements without the formation of degradation, permanent deformations and failures. Chiral units are also crushed to investigate the effect of failure and deformation mechanisms on the energy absorption characteristics. Moreover, a surface roughness study is conducted due to the high surface roughness of EBM printed parts and an equation is offered to define load-carrying effective areas to prevent misleading cross-section measurements. In compliance with the equation and tensile test results, a constitutive equation is formed and used after a selection and calibration process to verify the numerical model for optimum topology design and mechanical performance forecasting using a non-linear computational model with failure analysis. As a result, the cyclic compression and crush numerical analyses of EBM printed Ti6Al4V chiral cells are validated with the experimental results. It is shown that the constitutive equation of EBM printed as-built parts is extracted accurately considering the build orientation and surface roughness profile. Besides, the cyclic compressive and crush behavior of chiral units are investigated. The regions of the chiral units prone to prematurely fail under crush loads are determined and deformation modes are investigated to increase the energy absorption abilities.
1. Introduction
2. Production and Characterization of Additively Manufactured Chiral Elements
2.1. Chiral Cellular Structures
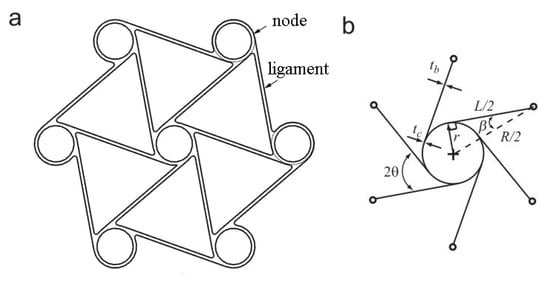
The angle of θ and β are the topology parameters, and their relationships between other parameters are given in Equation (1).
 (1)
(1)
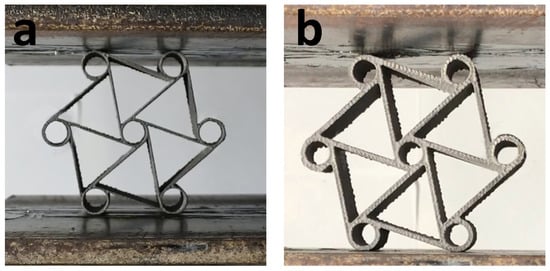
Equation (1) defines the topology layout and the ligament orientations with regard to the imaginary line through each node’s center [7][17]. Among the parameters, cosβ has a special place by dominating the chiral geometry significantly. According to the study of Spadoni et al. [32], L/R mainly affects the mechanical performance of the chiral structure. In the study of Prall and Lakes, −1 Poisson’s ratio of chiral structure was shown theoretically with a rigid node assumption, and the elastic modulus of a chiral structure is given in Equation (2) [7]. Es is the Young’s modulus of lattice cell constituent material. To obtain stiffer chiral structures, the thickness of the chiral units can be increased, and the ligament length and radius of nodes can be decreased. Two different chiral units with different thicknesses of 0.8 and 1.6 mm, called C1 and C2 hereafter, respectively, were considered in this study to investigate the effect of thickness.
 (2)
(2)
2.2. Materials and Processing
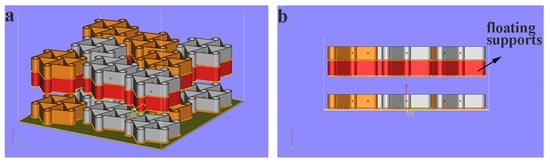
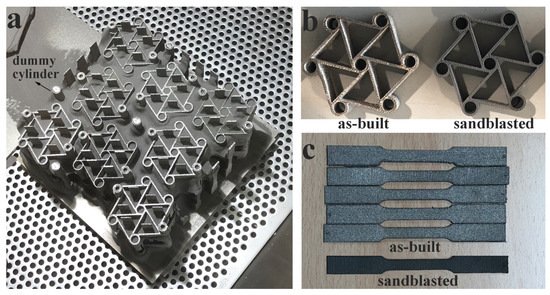
In this study, an ARCAM A2 system was used for the additive production of tensile, bending and chiral unit specimens. Sixteen chiral unit samples were produced in the same build by using gas atomized Ti6Al4V ELI (extra low interstitial) powder with an average size of 45–106 μm. Table 1 shows the powder’s chemical composition. The mechanical specifications indicated by the machine vendor for this material are listed as Young’s modulus, yield stress, ultimate tensile strength and elongation equal to 120 GPa, 930 MPa, 970 MPa and 16%, respectively [33]. The samples were produced on two different levels along the z-axis, as shown in Figure 2. By exploiting the pre-sintered nature of the powder, caused by the high-temperature pre-heating phase, “floating supports” were used for samples in the upper z level, as shown in Figure 2b. Dummy cylinders were included in the build to enhance the homogeneity of the thermal load within the entire build volume, as exhibited in Figure 3a. Four groups of tensile and bending specimens, including five specimens in each group, were produced. Groups can be defined as 0.8 mm thick vertical and horizontal, and 1.6 mm thick vertical and horizontal builds. The samples were produced with a layer thickness of 50 μm while applying default process parameters provided by the machine vendor for this powder.
| Aluminium | Vanadium | Carbon | Iron | Oxygen | Nitrogen | Hydrogen | Titanium |
|---|---|---|---|---|---|---|---|
| 6.0% | 4.0% | 0.03% | 0.10% | 0.10% | 0.01% | <0.003% | Balance |
2.3. Procedures for Mechanical Characterization and Testing
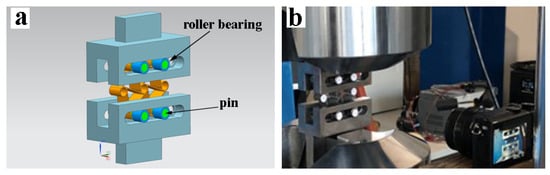
EBM printed parts show anisotropic behavior due to the layerwise production method. Accordingly, the mechanical properties of the EBM printed chiral units can be properly analyzed only if a complete characterization of EBM printed material is carried out. Tensile tests were performed in accordance with ASTM E8M for characterizing EBM printed Ti6Al4V parts and elucidating the mechanical properties. Moreover, three-point bending tests were performed, by adopting a testing jig with a span length of 15 mm, and a pin radius of 1.5 mm was used. The test rate for bending was defined as 1.47 mm/min according to having the same strain rate as the tensile test. The test specimens used in the bending tests were 32×6 mm with 0.8 and 1.6 mm thicknesses. Both tensile and bending test specimens were produced in two different directions, 0∘ and 90∘.
References
- Evans, K.E.; Nkansah, M.; Hutchinson, I.; Rogers, S. Molecular network design. Nature 1991, 353, 124.
- Lakes, R. Foam structures with a negative Poisson’s ratio. Science 1987, 235, 1038–1041.
- Alderson, A.; Alderson, K.L.; Attard, D.; Evans, K.E.; Gatt, R.; Grima, J.N.; Miller, W.; Ravirala, N.; Smith, C.; Zied, K. Elastic constants of 3-, 4- and 6-connected chiral and anti-chiral honeycombs subject to uniaxial in-plane loading. Compos. Sci. Technol. 2010, 70, 1042–1048.
- Dirrenberger, J.; Forest, S.; Jeulin, D. Effective elastic properties of auxetic microstructures: Anisotropy and structural applications. Int. J. Mech. Mater. Des. 2013, 9, 21–33.
- Grima, J.N.; Chetcuti, E.; Manicaro, E.; Attard, D.; Camilleri, M.; Gatt, R.; Evans, K.E. On the auxetic properties of generic rotating rigid triangles. Proc. R. Soc. A Math. Phys. Eng. Sci. 2011, 468, 810–830.
- Chen, Y.; Scarpa, F.; Liu, Y.; Leng, J. Elasticity of anti-tetrachiral anisotropic lattices. Int. J. Solids Struct. 2013, 50, 996–1004.
- Prall, D.; Lakes, R. Properties of a chiral honeycomb with a Poisson’s ratio of—1. Int. J. Mech. Sci. 1997, 39, 305–314.
- Wu, W.; Hu, W.; Qian, G.; Liao, H.; Xu, X.; Berto, F. Mechanical design and multifunctional applications of chiral mechanical metamaterials: A review. Mater. Des. 2019, 180, 107950.
- Mizzi, L.; Attard, D.; Gatt, R.; Pozniak, A.A.; Wojciechowski, K.W.; Grima, J.N. Influence of translational disorder on the mechanical properties of hexachiral honeycomb systems. Compos. Part B Eng. 2015, 80, 84–91.
- Li, H.; Ma, Y.; Wen, W.; Wu, W.; Lei, H.; Fang, D. In plane mechanical properties of tetrachiral and antitetrachiral hybrid metastructures. J. Appl. Mech. 2017, 84, 081006.
- Günaydın, K.; Eren, Z.; Kazancı, Z.; Scarpa, F.; Grande, A.M.; Türkmen, H.S. In-plane compression behavior of anti-tetrachiral and re-entrant lattices. Smart Mater. Struct. 2019, 28, 115028.
- Gunaydin, K.; Tamer, A.; Turkmen, H.S.; Sala, G.; Grande, A.M. Chiral-Lattice-Filled Composite Tubes under Uniaxial and Lateral Quasi-Static Load: Experimental Studies. Appl. Sci. 2021, 11, 3735.
- Yu, H.; Wu, W.; Zhang, J.; Chen, J.; Liao, H.; Fang, D. Drastic tailorable thermal expansion chiral planar and cylindrical shell structures explored with finite element simulation. Compos. Struct. 2019, 210, 327–338.
- Liu, Y.; Hu, H. A review on auxetic structures and polymeric materials. Sci. Res. Essays 2010, 5, 1052–1063.
- Mir, M.; Ali, M.N.; Sami, J.; Ansari, U. Review of mechanics and applications of auxetic structures. Adv. Mater. Sci. Eng. 2014, 2014, 753496.
- Yang, W.; Li, Z.M.; Shi, W.; Xie, B.H.; Yang, M.B. Review on auxetic materials. J. Mater. Sci. 2004, 39, 3269–3279.
- Spadoni, A.; Ruzzene, M.; Scarpa, F. Global and local linear buckling behavior of a chiral cellular structure. Phys. Status Solidi (b) 2005, 242, 695–709.
- Lorato, A.; Innocenti, P.; Scarpa, F.; Alderson, A.; Alderson, K.; Zied, K.; Ravirala, N.; Miller, W.; Smith, C.; Evans, K. The transverse elastic properties of chiral honeycombs. Compos. Sci. Technol. 2010, 70, 1057–1063.
- Lu, Q.; Qi, D.; Li, Y.; Xiao, D.; Wu, W. Impact energy absorption performances of ordinary and hierarchical chiral structures. Thin-Walled Struct. 2019, 140, 495–505.
- Spadoni, A.; Ruzzene, M.; Scarpa, F. Dynamic response of chiral truss-core assemblies. J. Intell. Mater. Syst. Struct. 2006, 17, 941–952.
- Tee, K.; Spadoni, A.; Scarpa, F.; Ruzzene, M. Wave propagation in auxetic tetrachiral honeycombs. J. Vib. Acoust. 2010, 132, 031007.
- Spadoni, A.; Ruzzene, M.; Gonella, S.; Scarpa, F. Phononic properties of hexagonal chiral lattices. Wave Motion 2009, 46, 435–450.
- Liu, X.; Hu, G.; Sun, C.; Huang, G. Wave propagation characterization and design of two-dimensional elastic chiral metacomposite. J. Sound Vib. 2011, 330, 2536–2553.
- Zhang, K.; Zhao, P.; Hong, F.; Yu, Y.; Deng, Z. On the directional wave propagation in the tetrachiral and hexachiral lattices with local resonators. Smart Mater. Struct. 2019, 29, 015017.
- Zhu, Y.; Wang, Z.P.; Poh, L.H. Auxetic hexachiral structures with wavy ligaments for large elasto-plastic deformation. Smart Mater. Struct. 2018, 27, 055001.
- Tancogne-Dejean, T.; Karathanasopoulos, N.; Mohr, D. Stiffness and strength of hexachiral honeycomb-like metamaterials. J. Appl. Mech. 2019, 86.
- Dirrenberger, J.; Forest, S.; Jeulin, D. Elastoplasticity of auxetic materials. Comput. Mater. Sci. 2012, 64, 57–61.
- Bacigalupo, A.; Gambarotta, L. Homogenization of periodic hexa-and tetrachiral cellular solids. Compos. Struct. 2014, 116, 461–476.
- Gibson, L.J.; Ashby, M.F. Cellular Solids: Structure Furthermore, Properties; Cambridge University Press: Cambridge, MA, USA, 1999.
- Heinl, P.; Rottmair, A.; Körner, C.; Singer, R.F. Cellular titanium by selective electron beam melting. Adv. Eng. Mater. 2007, 9, 360–364.
- Bacigalupo, A.; De Bellis, M.L. Auxetic anti-tetrachiral materials: Equivalent elastic properties and frequency band-gaps. Compos. Struct. 2015, 131, 530–544.
- Spadoni, A.; Ruzzene, M. Numerical and experimental analysis of the static compliance of chiral truss-core airfoils. J. Mech. Mater. Struct. 2007, 2, 965–981.
- Ti6Al4V ELI Titanium Alloy Arcam EBM System; Technical Report; Arcam: Mölndal, Sweden, 2019.
- De Formanoir, C.; Michotte, S.; Rigo, O.; Germain, L.; Godet, S. Electron beam melted Ti–6Al–4V: Microstructure, texture and mechanical behavior of the as-built and heat-treated material. Mater. Sci. Eng. A 2016, 652, 105–119.
- Steed, C.A.; Halsey, W.; Dehoff, R.; Yoder, S.L.; Paquit, V.; Powers, S. Falcon: Visual analysis of large, irregularly sampled, and multivariate time series data in additive manufacturing. Comput. Graph. 2017, 63, 50–64.
- Chandrasekar, S.; Coble, J.B.; Yoder, S.; Nandwana, P.; Dehoff, R.R.; Paquit, V.C.; Babu, S.S. Investigating the effect of metal powder recycling in Electron beam Powder Bed Fusion using process log data. Addit. Manuf. 2020, 32, 100994.

