Matrix metalloproteinases (MMPs) are a family of Calcium and Zinc-dependent endoproteases able to degrade all extracellular matrix components and with a wide array of intracellular targets. They are involved in many physiologic processes (e.g. reproduction, tissue remodeling, cell migration, apoptosis) as well as in disease (cancer, cardiovascular and infective). Their biological activity is regulated with different mechanisms at expression, activation and neutralization levels. One of the earliest, is the occurrence of functional genetic polymorphisms (GP), i.e. DNA sequence variants of the gene or of its promoter (flanking region) accounting for a different expression. In some of these GP it has been demonstrated that one allelic variant ensures a different binding of transcription factors compared to the alternative allele. Another regulatory mechanism is neutralization, which is based on the expression of 4 different Tissue Inhibitors of MMPs (TIMPs) which undergo to the same regulation by GP. GPs of MMPs and TIMPs have been associated to susceptibility or complications of various diseases. GPs of MMPs and TIMP (namely MMP-1 rs1799750, MMP-3 rs3025058, MMP-8 rs11225395, MMP-9 rs2234681, and TIMP-1 rs4898) have been compared in 1058 patients with suspected sepsis to assess the association with susceptibility and etiology of sepsis.
1. Introduction
Sepsis, the invasion of microorganisms inducing a generalized inflammatory response, is a major cause of death and permanent disability in Western countries and worldwide
[1]. Its occurrence and outcomes reflect the balance between, on one side, the invading capacities of the pathogen, and on the other, mechanical and immune (innate and acquired) mechanisms. Both defense mechanisms have key players in matrix metalloproteinases (MMPs) and their inhibitors (tissue inhibitors of matrix metalloproteinases, TIMPs)
[2]. MMPs are calcium and zinc-dependent proteolytic enzymes that can be membrane-bound or soluble (secreted), which are able to degrade all components of the extracellular matrix, thereby favoring cell migration within tissues and enhancing the availability of growth factors bound to the matrix. Over the years, many non-structural and intracellular targets of MMPs have been identified, thus expanding their potential role in immune modulation
[3][4][5] and other cellular functions
[6].
MMP activities are tightly regulated through epigenetic, transcriptional, and post-transcriptional modulation of gene expression, proteolytic activation, post-translational modifications, and extracellular inhibition
[7]. Among these, functional polymorphisms influence gene expression and activity and might therefore control the pathogen invasion process, thus influencing susceptibility, clinical presentation, and likely the outcomes of sepsis. Inhibition and clearance of these MMPs are performed by specific inhibitors (tissue inhibitor of metalloprotease, TIMP 1–4), which, in turn, undergo regulation of its expression by genetic polymorphisms. At present, knowledge on the role of MMP/TIMP polymorphisms has been derived from small studies mainly focused on the prognostic value of these variants. Nonetheless, their differential expression might identify specific pathways for the susceptibility and presentation of sepsis compared to other inflammatory non-septic conditions.
The role of MMPs in sepsis has already been addressed in experimental and clinical conditions, although clinical investigation has mainly focused on plasma levels
[8][9][10]. A major limitation of this type of approach is that plasma MMP or TIMP concentration fluctuates in sepsis according to the stage of the disease, and each MMP might have different timing in appearance, some being immediately released by activated neutrophils (e.g., MMP-8 and MMP-9)
[11] while others are expressed and released by inflamed tissues over a different time period
[12]. In this context, functional genetic variants would enable us to estimate the in vivo effects of a different expression of MMP or TIMP within tissues free from the timing of the sample collection. In the choice of MMP/TIMP and their genetic variants, the researchers started from MMPs with increased/decreased expression (or plasma levels) during sepsis
[13], with functional genetic variants and adequate allelic frequency and, when available, connected with expression pathways known to be activated during sepsis, (e.g.,
ets or NF-kB)
[14][15][16].
2. Population and MMP/TIMP Polymorphism
In total, 1058 patients were analyzed in the present sub-study. Among these, a definite diagnosis was reached in 939 patients: 127 non infective SIRS (Ni-SIRS) and 812 sepsis, leaving debatable diagnosis (SIRS cases that could not be robustly characterized as infected) in the remaining 119. Clinical and laboratory data were complete in more than 99% of cases. Genotyping was successful in 99.5% of patients overall with few patients not fully genotyped (namely 6, 7, 3, 3, and 8 patients for MMP-1, -3, -8, -9, and TIMP-1, respectively). HW equilibrium was maintained for MMP1, -3, and -9 (p = 0.99, 0.354, 0.181, respectively) and for TIMP-1 female patients, (p = 0.857, T allelic frequency of 0.57 and 0.566 in the female and male sex, respectively). HW equilibrium for MMP8 was not demonstrated (p = 0.000029) with increased heterozygosity. Furthermore, HW equilibrium was reevaluated in patients with a definite diagnosis, with no remarkable differences from the whole population. Consistently, for MMP-8 rs11225395, HW was not confirmed in all groups of patients (p = 0.02, 0.0022, and 0.039 for non-infective SIRS, sepsis, and undefined patients, respectively). Linkage disequilibrium between MMP-1 rs1799750 and MMP-8 rs11225395 was demonstrated (D stat = 0.0241, D’ = 0.12 r = 0.0992 p =< 0.0001). No difference in genetic frequencies could be detected comparing the different centers contributing to the study (all p > 0.05). Patients’ general characteristics, SIRS criteria, clinical variables at presentation, and severity and comorbidity indexes are reported in Table 1 grouped according to the final diagnosis.
Table 1. Demographic, clinical presentation, comorbidities, and clinical severity of the patients, according to the final diagnosis. SIRS criteria and comorbidities are described as positive/negative finding for the condition, while continuous variables are the median and, in parentheses, interquartile range. p = p values of Kruskal–Wallis or χ2 square test, WBC = white blood cells.
| |
Ni-SIRS (127) |
Sepsis (812) |
Debatable (119) |
p |
| Male/female |
66/61 |
426/386 |
52/67 |
0.201 |
| Age |
72 (59–84) |
81 (72–87) |
78 (71–87) |
0.000 |
| SIRS criteria |
|
|
|
|
| Hyperthermia |
20/107 |
389/423 |
33/86 |
0.0000 |
| Hypothermia |
4/123 |
33/779 |
3/116 |
0.658 |
| Leukocytosis |
55/72 |
459/353 |
77/42 |
0.002 |
| Leukopenia |
4/123 |
30/782 |
7/112 |
0.464 |
| Tachycardia |
112/15 |
608/204 |
95/24 |
0.003 |
| Tachypnea |
98/29 |
615/197 |
81/38 |
0.165 |
| Immature leukocytes |
0/127 |
3/809 |
0/119 |
0.634 |
| Clinical presentation |
|
|
|
|
| Breathing rate |
22 (20–26) |
24 (20–27) |
22 (20–26) |
0.301 |
| Heart rate, |
103 (96–110) |
100 (90–110) |
100 (90–108) |
0.001 |
| Temperature |
36.5 (36–37.1) |
37.6 (36.5–38.2) |
36.7 (36–37.8) |
0.000 |
| WBC count |
10.8(7.5–14.5) |
12.8(9.2–16.7) |
13 (9.4–15.8) |
0.001 |
| Comorbidities, severity and scores |
|
|
|
| Charlson comorbidity index |
2 (1–5) |
3 (1–5) |
3 (2–5) |
0.008 |
| SOFA Score |
2 (1–3) |
3 (2–4) |
3 (2–4) |
0.000 |
| Apache II Score |
10 (7–12) |
12 (9–15) |
11 (9–14) |
0.000 |
| SAPS Score |
36 (27–40) |
37 (34–43) |
36 (34–42) |
0.000 |
The association of MMP polymorphisms with features of presentation were examined independent of final diagnosis.
3. MMP/TIMP Genotype and Sepsis Susceptibility
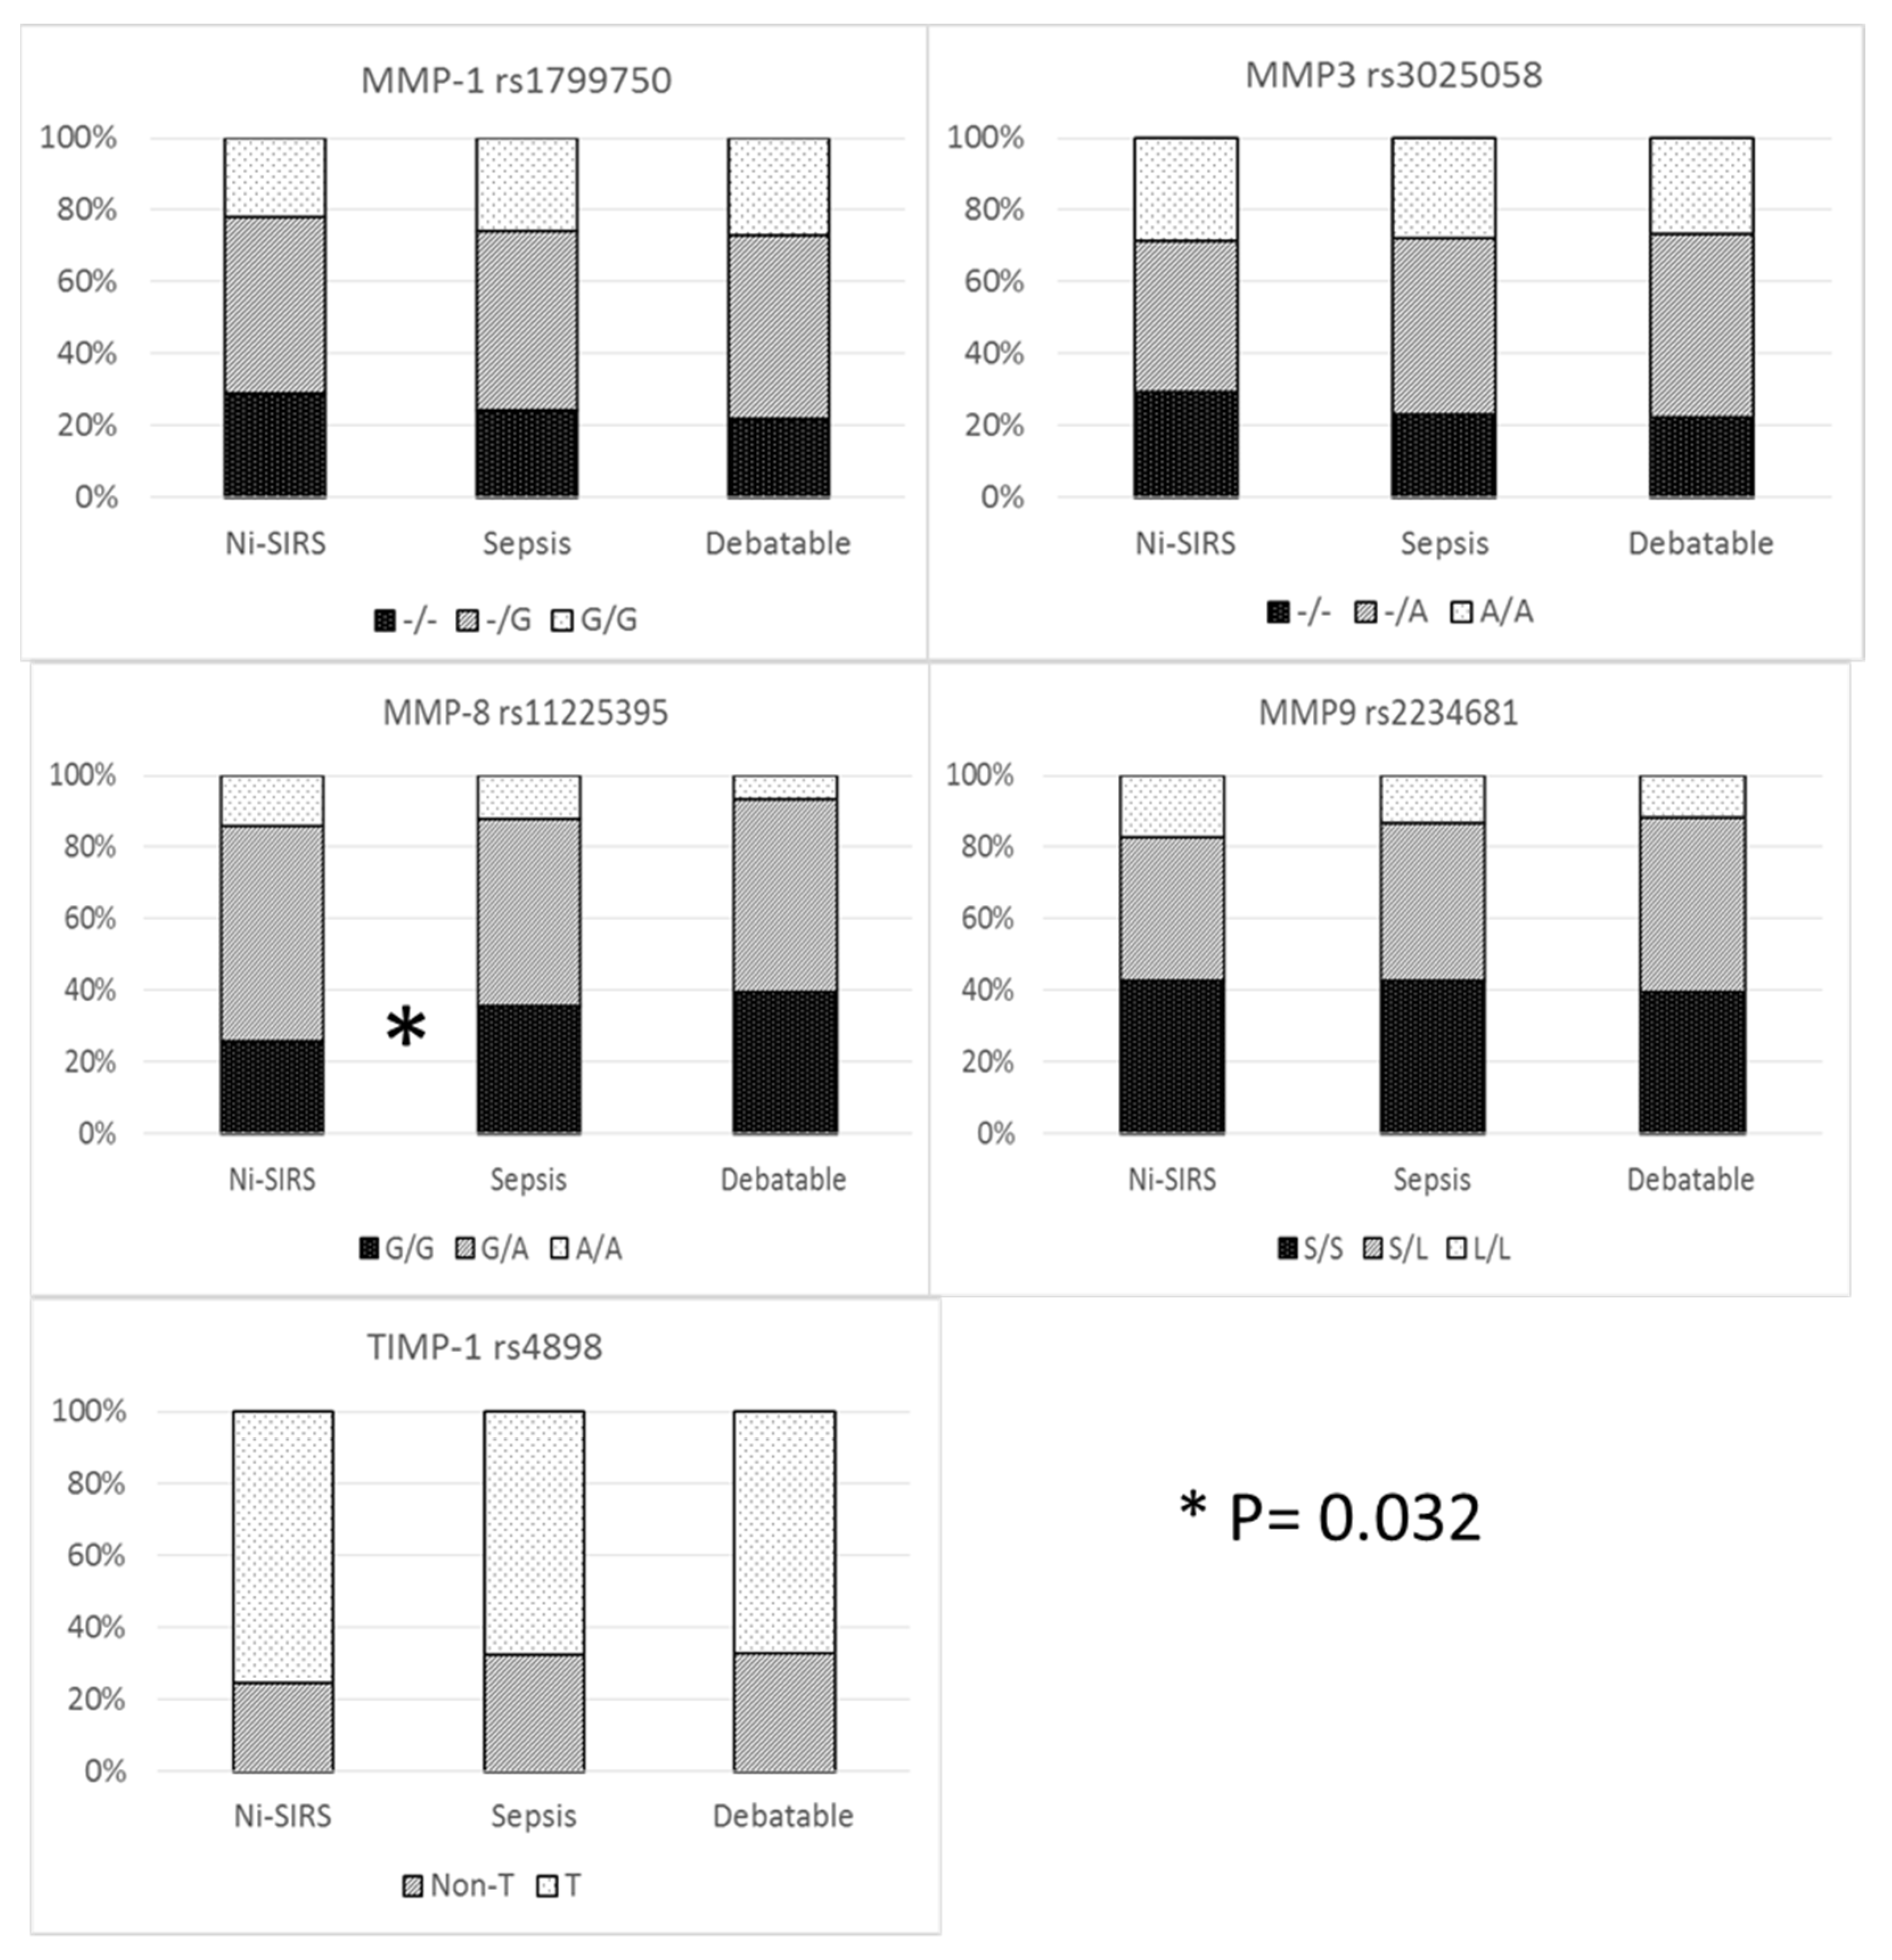
The prevalence of different genotypes was compared only in patients with definite diagnosis (i.e., sepsis and non-infective SIRS). Allelic and genetic prevalence are reported in Figure 1. Cross tabulation of genetic prevalence was marginally significant only for MMP-8 (codominant model), although MMP-8 G/G genotype (recessive model) was more prevalent in sepsis patients than in non-infective SIRS patients (35.6 vs. 26%) with an increase in risk of 58% (95%CI 1.04–2.42).
Figure 1. MMP/TIMP genetic variables and diagnosis.
Haplotype analysis was conducted to observe additive diagnostic efficacy of MMP-8 rs11225395, MMP-9 rs2234681, and TIMP-1 rs4898 haplotype over the MMP-8 genotype. No advantage was demonstrated for haplotype analysis of MMP-8 and MMP-9 (global haplotype association p value = 0.24) and when TIMP-1 rs4898 was considered as a covariate (interaction p value = 0.2).
4. Clinical Presentation and MMP-8 rs11225395
Further investigation was carried out on MMP-8 polymorphism and its association with clinical presentation. SIRS criteria between Ni-SIRS and sepsis are summarized in Table 1 and their comparison according to MMP-8 genotype for Ni-SIRS and sepsis is reported in Table 2.
Table 2. Clinical presentation of sepsis and MMP8 rs11225935 (unstandardized). Comparisons were carried out with χ2 test or Mann–Whitney, according to the variable considered, and p values are reported on the right columns. p values legend: Ni-SIRS and Seps = comparison of SIRS criteria according to MMP-8 genotypes within each group (Ni-SIRS and Sepsis, respectively), GG and A* = comparison of SIRS criteria within a specific genotype (GG or A carrier) across the different groups of patients.
| |
Ni-SIRS |
Sepsis |
p values |
| |
GG (n = 33) |
A* (n = 94) |
GG (n = 289) |
A* (n = 520) |
Ni-SIRS |
Seps |
GG |
A* |
| Hyperthermia |
5/28 |
15/79 |
124/165 |
262/258 |
0.913 |
0.041 |
0.002 |
0.000 |
| Hypothermia |
1/32 |
3/91 |
13/276 |
20/500 |
0.964 |
0.653 |
0.695 |
0.758 |
| Temperature |
36.5 (36–37) |
36.5 (36–37) |
37.5 (36.5–38) |
37.7 (36.6–38) |
0.981 |
0.247 |
0.000 |
0.000 |
| Leukocytosis |
13/20 |
42/52 |
165/124 |
293/227 |
0.598 |
0.837 |
0.053 |
0.037 |
| Leukopenia |
1/32 |
3/91 |
10/279 |
19/501 |
0.964 |
0.887 |
0.898 |
0.824 |
| WBC count |
10.9 (7.9–13.6) |
10.7 (7.2–14.9) |
12.7 (8.9–16.7) |
12.9 (9.4–16.8) |
0.606 |
0.677 |
0.19 |
0.002 |
| Tachycardia |
30/3 |
82/12 |
229/60 |
377/143 |
0.574 |
0.034 |
0.109 |
0.002 |
| Heart rate |
107 (99.113) |
101 (96–110) |
100 (92–110) |
100 (90–110) |
0.359 |
0.576 |
0.017 |
0.011 |
| Tachypnea |
26/7 |
72/22 |
227/62 |
387/133 |
0.796 |
0.189 |
0.974 |
0.655 |
| Breath rate |
22 (20–26) |
22 (20–26) |
24 (20–26) |
24 (20–26) |
0.408 |
0.854 |
0.617 |
0.33 |
| Immat. WBC |
0 |
0 |
2/287 |
1/519 |
n.a. |
0.262 |
0.632 |
0.67 |
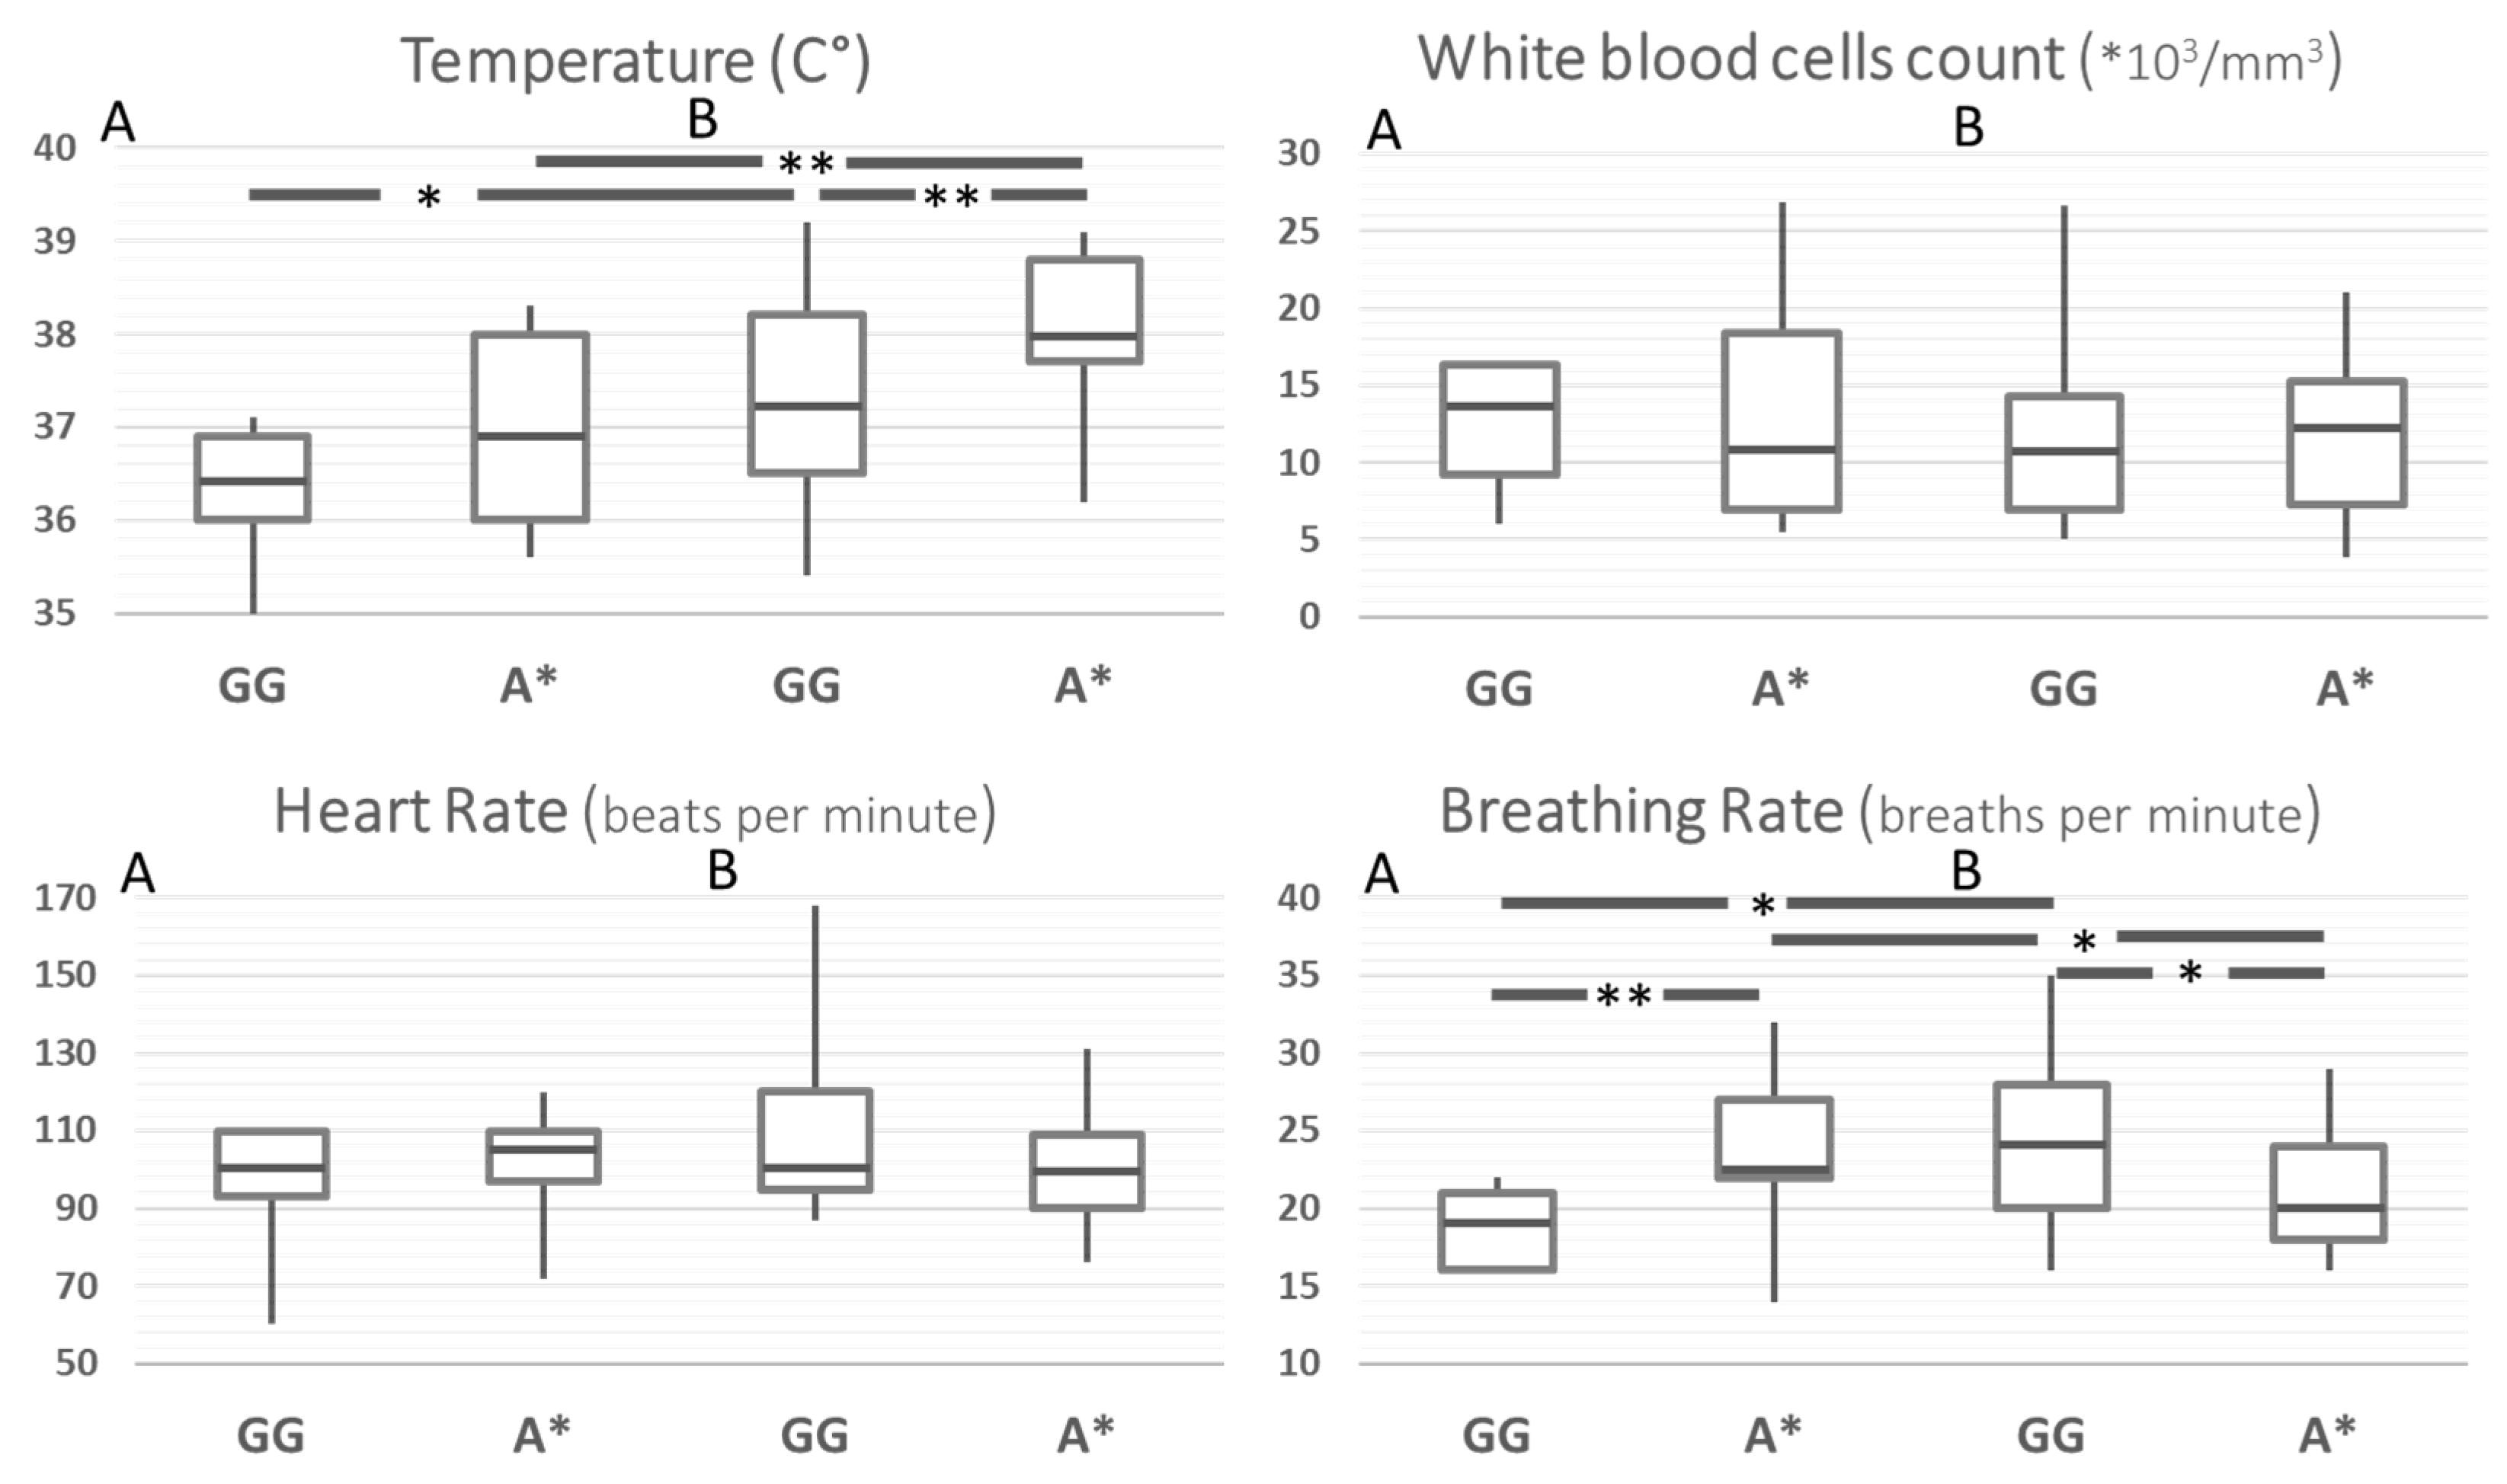
In order to rule out the effect of possible confounders in the comparison between Ni-SIRS and septic patients, the same comparisons were carried out after stratification for age and disease severity (SOFA, Charlson, Apache II, and SAPS score). This yielded a group of 91 patients, whose results are reported in
Figure 2. After standardization, body temperature at admission was the only SIRS criteria remaining higher in septic patients and different according to MMP8 genotype. Compared to the G/G genotype, A carriers had an increased risk for hyperthermia across the whole group and in the stratified septic patients (HR 4.4, 95%CI 1.7–11.4,
p = 0.0024 and 5.8, 95%CI 1.9–18.2,
p = 0.0024, respectively). Breathing rate showed a statistically weak paradoxical pattern, particularly with a higher rate of A carriers in Ni-SIRS patients.
Figure 2. SIRS criteria according to MMP8 rs11225395 polymorphism in patients with Ni-SIRS (A) and sepsis (B) standardized for diabetes, age, and severity (SOFA score). ** = p < 0.01, * = p < 0.05.
5. Pathogens and Genetic Variants
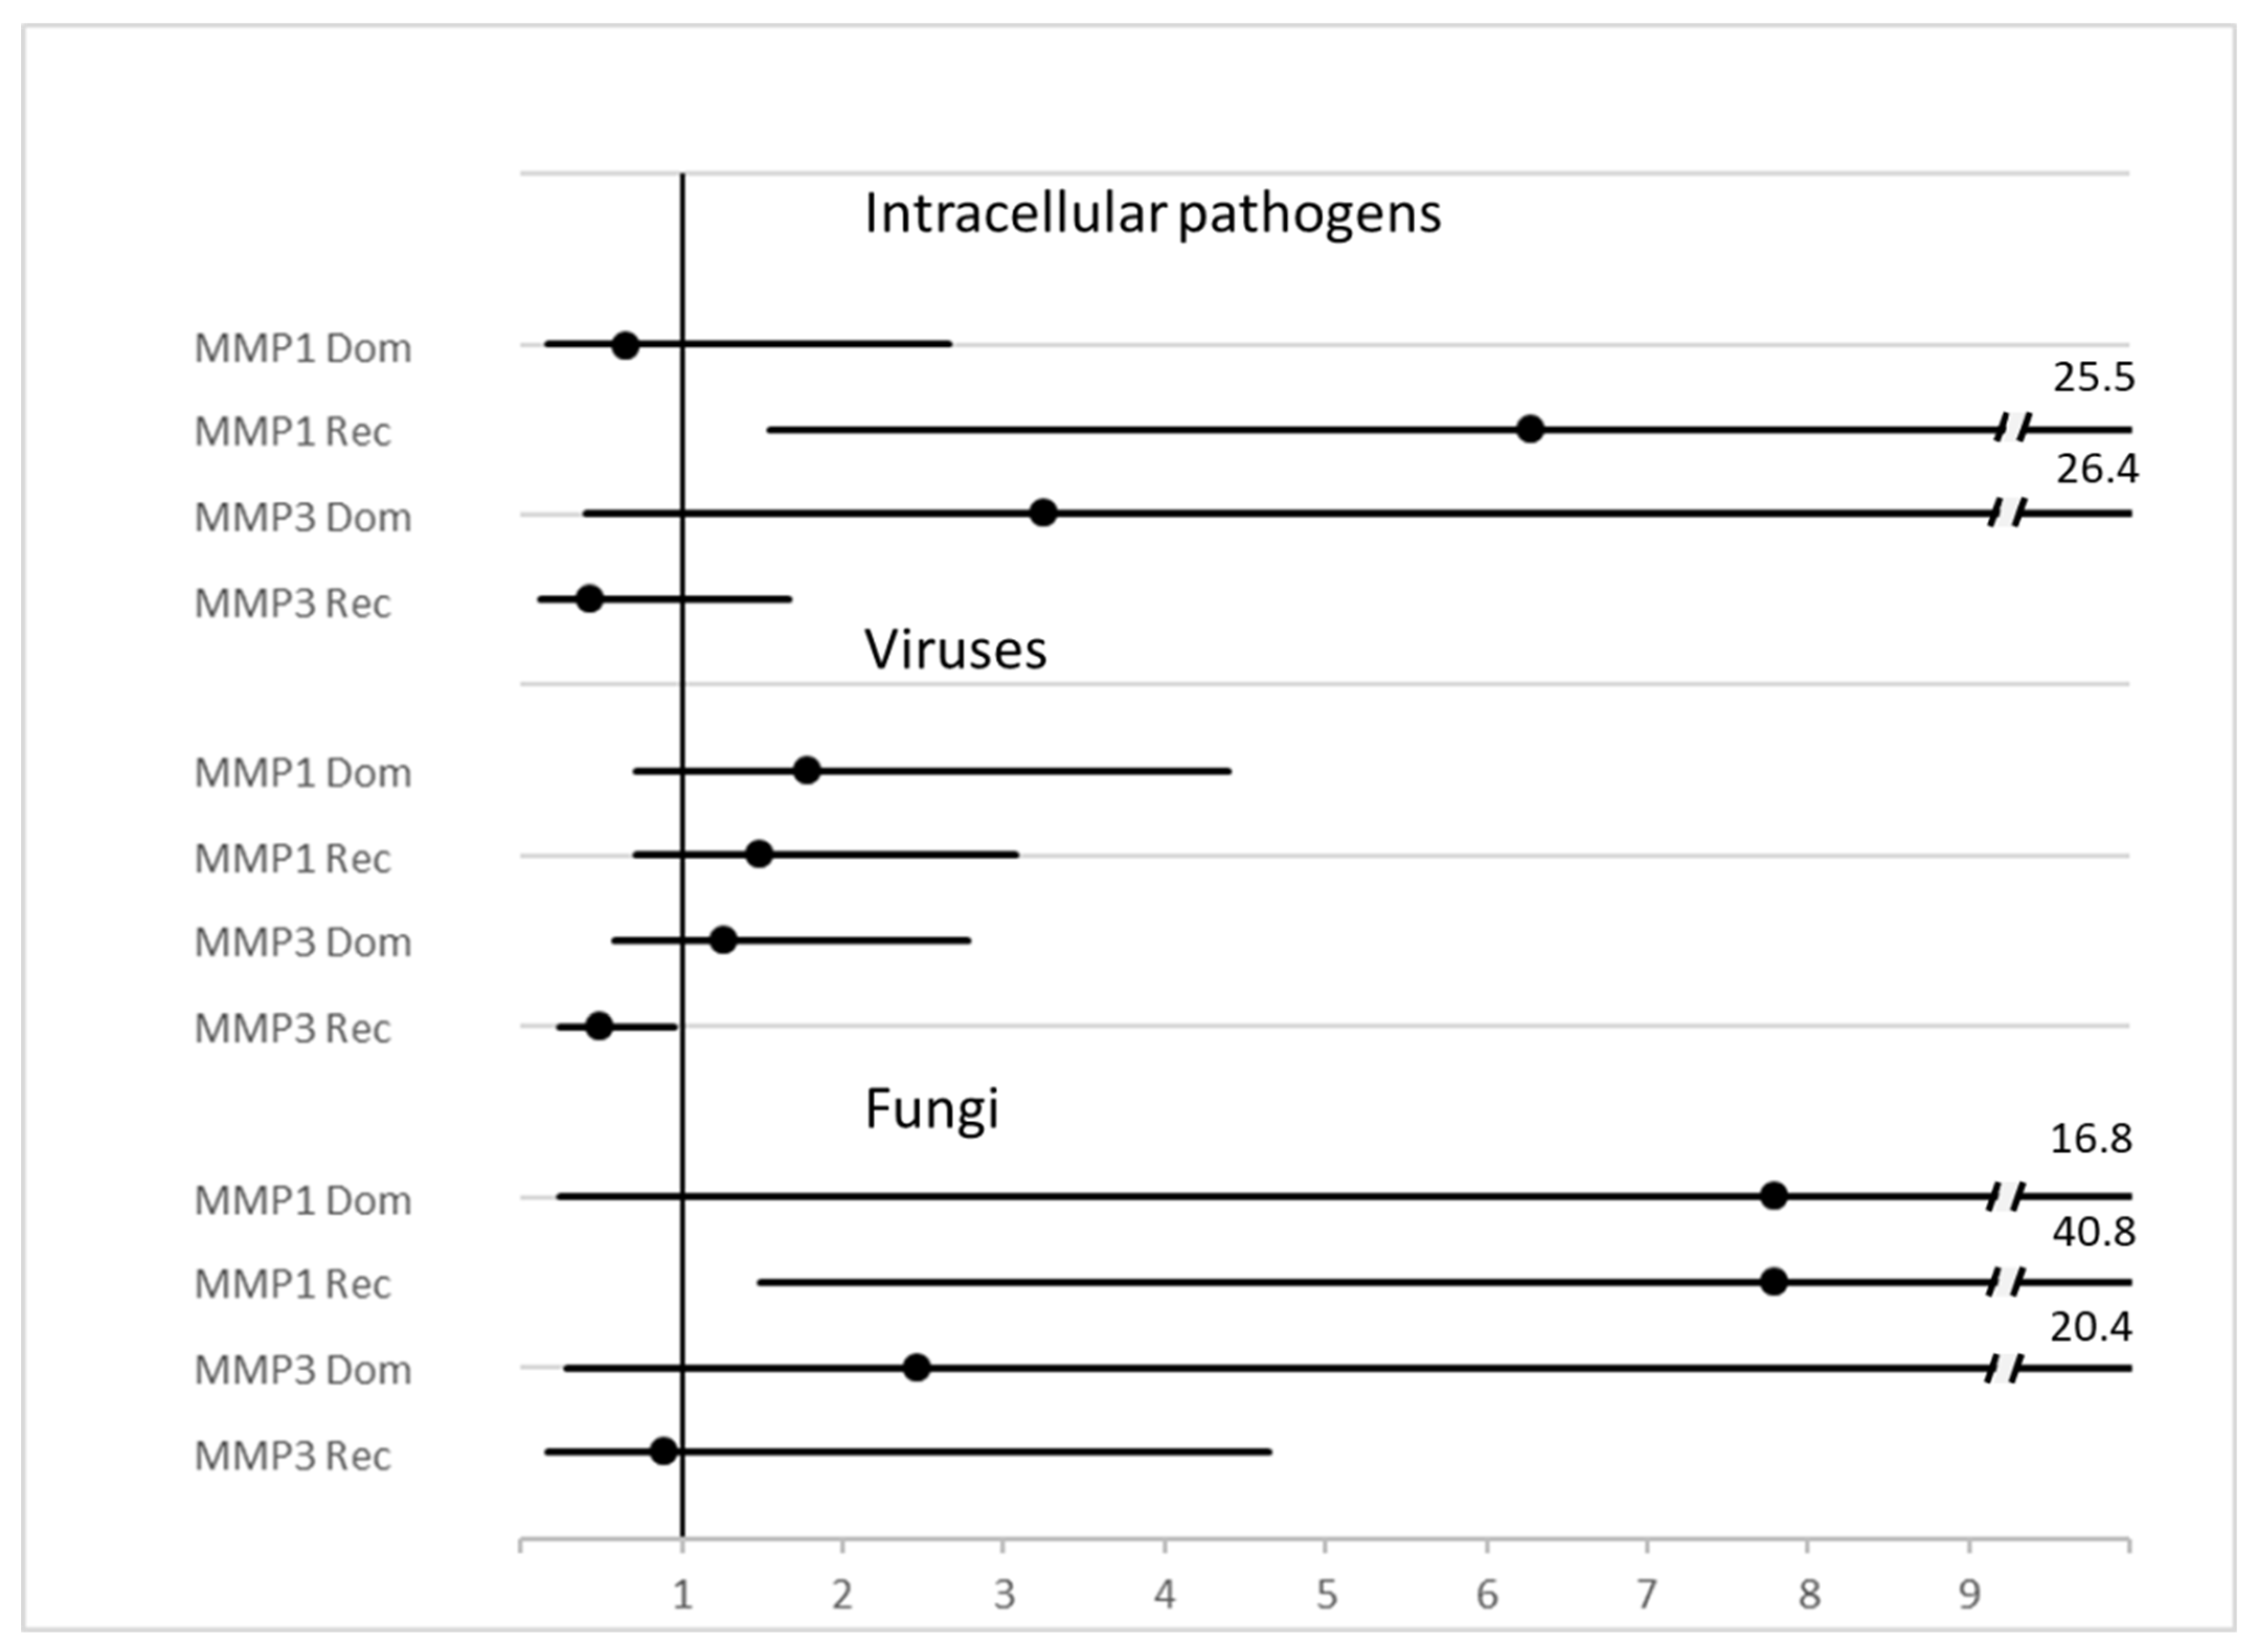
Evaluation of MMP polymorphisms have also been reported when grouping the pathogens according to Gram staining properties (Gram positive or negative), intracellular (atypical) bacteria, viruses, and fungi, amongst others, is reported in Table 3. Hazard ratios associated with diagnosis of a specific class of pathogens is reported as a forest plot in Figure 3. p = χ2 test for all diagnoses.
Figure 3. Forest plot of HR and 95%CI of MMP genotype variants and diagnosis of some classes of pathogens. Legend: MMP1 = rs1799750, MMP3 = rs3025058.
Table 3. Genetic variants and groups of pathogens. Legend: a = codominant (− vs. −G vs. GG), p = 0.004. b = dominant (−/−G vs. GG) H.R. 6.2 95% C.I. 1.5–25.3, p = 0.004. c = codominant (− vs. −G vs. GG) p = 0.004. d = dominant (−/−G vs. GG), H.R. 7.7 95%CI 1.5–40.4, p = 0.005. e = dominant (−/−A vs. AA), H.R. 0.47 95% CI 0.23-.94, p = 0.032. f = T vs. Non-T H.R. 0.21, 95% C.I. 0.04–1.1 p = 0.041.
| |
MMP-1 |
MMP-3 |
MMP-8 |
MMP-9 |
TIMP-1 |
| |
rs1799750 |
rs3025058 |
rs11225395 |
rs2234681 |
rs4898 |
| |
−/−G/GG |
−/−A/AA |
AA/AG/GG |
SS/SL/LL |
Non-T/T |
| All |
106/214/107 |
123/194/113 |
48/230/150 |
179/187/62 |
148/279 |
| Gram+ |
37/73/30 |
46/59/35 |
15/75/50 |
51/67/22 |
48/92 |
| Gram− |
59/121/54 |
66/114/57 |
28/129/78 |
104/102/29 |
83/152 |
| Intracell |
3/0/6 a b |
1/4/4 |
1/5/3 |
4/2/3 |
1/8 |
| Virus |
6/19/12 |
9/13/15 e |
4/18/15 |
15/14/8 |
11/25 |
| Fungus |
1/1/5 c d |
1/4/2 |
0/3/4 |
5/2/0 |
5/2 f |
| p |
0.004 |
0.346 |
0.942 |
0.239 |
0.152 |
6. Binary Logistic Regression
To integrate the predictive role of MMP polymorphisms in the diagnosis of sepsis, binary logistic regression considered as the dependent variable the diagnosis of sepsis, sepsis due to virus, or intracellular pathogens and as independent variables, those available at admission (detailed in the Materials and Methods). The results are reported in Table 4.
Table 4. Results of the last step of binary logistic regression for the inference of variables associated with all sepsis or sepsis caused by viruses or intracellular atypical bacteria.
| |
B Value (E.S). |
Wald |
Sig. |
Exp(B) |
95% CI EXP(B) |
| All sepsis |
| TIMP-1 rs4898 T carrier |
−0.590 (0.265) |
4.937 |
0.026 |
0.555 |
0.330 |
0.933 |
| SOFA Score |
0.227 (0.066) |
11.908 |
0.001 |
1.255 |
1.103 |
1.427 |
| Age |
0.045 (0.007) |
38.445 |
0.000 |
1.046 |
1.031 |
1.061 |
| Hyperthermia |
2.079 (0.315) |
43.496 |
0.000 |
7.997 |
4.311 |
14.834 |
| C Reactive Protein |
0.013 (0.002) |
41.767 |
0.000 |
1.014 |
1.009 |
1.018 |
| MMP-8 11,225,395 Dominant |
−0.720 (0.254) |
8.032 |
0.005 |
0.487 |
0.296 |
0.801 |
| Antimicrobial at home |
0.706 (0.306) |
5.317 |
0.021 |
2.025 |
1.112 |
3.690 |
| Constant |
−2.182 (0.706) |
9.563 |
0.002 |
0.113 |
|
|
| Virus |
| MMP-3 rs3025058 5A carrier |
−0.838 (0.390) |
4.613 |
0.032 |
0.433 |
0.201 |
0.929 |
| COPD |
1.086 (0.401) |
7.352 |
0.007 |
2.963 |
1.351 |
6.498 |
| Moderate/severe kidney disease |
−2.467 (1.034) |
5.692 |
0.017 |
0.085 |
0.011 |
0.644 |
| Constant |
−1.779 (0.325) |
29.905 |
0.000 |
0.169 |
|
|
| Intracellular atypical bacteria |
| TIMP-1 rs4898 C carrier |
2.362 (0.906) |
6.800 |
0.009 |
10.617 |
1.798 |
62.681 |
| Previous myocardial infarction |
2.263 (0.816) |
7.699 |
0.006 |
9.613 |
1.943 |
47.545 |
| Dementia |
−2.607 (1.247) |
4.373 |
0.037 |
0.074 |
0.006 |
0.849 |
| MMP-1 rs1799750 |
2.638 (0.842) |
9.819 |
0.002 |
13.982 |
2.686 |
72.795 |
| Constant |
−9.255 (1.985) |
21.736 |
0.000 |
0.000 |
Gram positive or negative bacteria as well as fungus sepsis did not show any association with MMP genetic variants as well as having a sepsis by more than one pathogen (data not shown).
 +1 credit