1. Anode design and morphology characterization
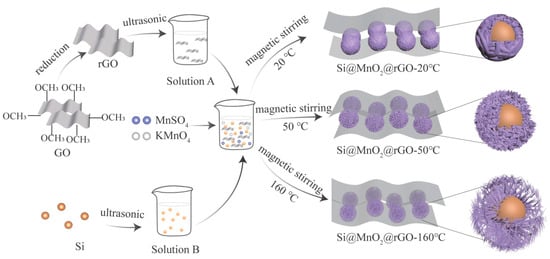
Figure 1 shows a schematic of the preparation of the sea urchin-like Si@MnO2@rGO composites. First, GO sheets were reduced to rGO by a hydrothermal method with NaBH4. Then, the rGO was collected and dispersed in deionized water (Solution A). Next, Si nanospheres were dispersed in a solution of water, alcohol, and the KH550 silane coupling agent (Solution B). The composites were well grafted by KH550, improving the conductivity.
Figure 1. Concise preparation schematics of the Si@MnO2@ reduced graphene oxide (rGO) composites.
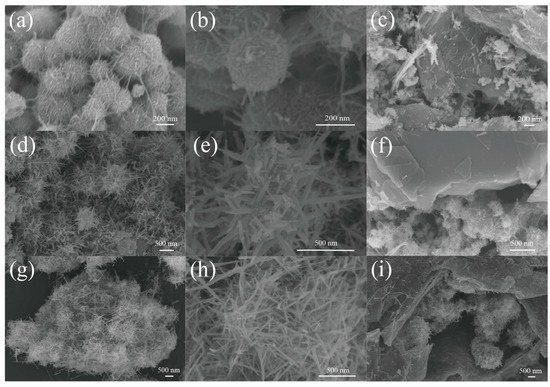
Figure 2 shows the morphologies of the materials grown at three different temperatures. The morphology of Si@MnO2-20°C is shown in Figure 2a. The MnO2 formed disordered and entangled filaments on the surface of Si nanospheres. Figure 2b shows Si@MnO2-20°C at a high magnification. The surface of the material was rough and the diameter of Si@MnO2-20°C particles was 200 nm. Figure 2c is an SEM image of Si@MnO2@rGO-20°C, showing that the rGO covered the Si@MnO2-20°C. However, some MnO2 nanowires appeared on the surface of rGO, which suggested that the material was not stable. Figure 2d,e show the SEM images of Si@MnO2-50°C at different magnifications, respectively. As shown in Figure 2d, the MnO2 formed a sea urchin-like shell coating on the surface of Si nanospheres. Figure 2e shows the sea urchin-like Si@MnO2-50°C. The stings (MnO2) were 100–300 nm in length. Figure 2f shows Si@MnO2@rGO-50°C. The rGO wrapped the Si@MnO2-50°C without obvious damage to the structure. Interestingly, this rGO surface was clean, without any MnO2 nanowires, indicating the sea urchin-like structure was more stable. MnO2 nanowires were vertically oriented on the outer layer of the Si nanospheres, imbedding rGO layers, forming a stable structure, which can buffer the excessive expansion of the Si nanospheres during the charging/discharging process and extend the batteries’ lifetime. Figure 2g shows the SEM image of Si@MnO2-160°C. The MnO2 nanowires grew longer and coated the surface of the Si nanospheres. Figure 2h is the enlarged view of Figure 2g. The plentiful MnO2 nanowires were interleaved. Figure 2i shows the images of Si@MnO2@rGO-160°C.
Figure 2. (a) SEM image of the Si@MnO2-20°C composite. (b) Enlarged view of the SEM image of the Si@MnO2-20°C composite. (c) SEM image of the Si@MnO2@rGO-20°C composite. (d) SEM image of the Si@MnO2-50°C composite. (e) Enlarged view of the SEM image of the Si@MnO2-50°C composite. (f) SEM image of the Si@MnO2@rGO-50°C composite. (g) SEM image of the Si@MnO2-160°C composite. (h) Enlarged view of the SEM image of the Si@MnO2-160°C composite. (i) SEM image of the Si@MnO2@rGO-160°C composite.
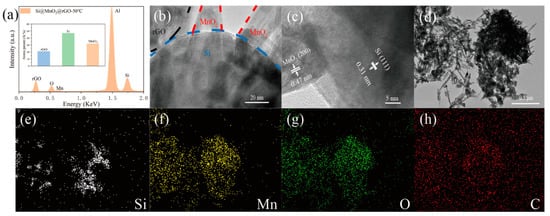
Figure 3a shows the Energy Dispersive Spectrometer (EDS) analysis of the ball-milled material, using aluminum foil as a substrate, and the inset shows the atomic percentages of elements in the materials. The inset shows that the Si@MnO
2@rGO-50°C contained ~48% Si, ~21% rGO, and ~31% MnO
2.
Figure 3b,c show HRTEM images of the Si@MnO
2@rGO-50°C composite at different magnifications. Si nanospheres were coated with rGO and MnO
2. The lattice fringes corresponded to the (111) plane of Si, having a separation of 0.31 nm
[1][2]. In addition, lattice fringes having an interplanar spacing of 0.47 nm can be seen, and this is consistent with the (200) plane of MnO
2 [3][4][5]. The element mapping of the Si@MnO
2@rGO-50°C composite is shown in
Figure 3d–h. Mn element and O element contributed to MnO
2; Si element contributed to Si nanospheres. C element dispersed throughout the image may have contributed to both the substrate and rGO.
Figure 3. (a) Energy Dispersive Spectrometer (EDS) spectra of Si@MnO2@rGO-50°C. Inset showing the respective substance of Si@MnO2@rGO-50°C. (b,c) HRTEM images of the Si@MnO2@rGO-50°C composite at different magnifications. (d–h) Elemental mapping of the Si@MnO2@rGO-50°C composite.
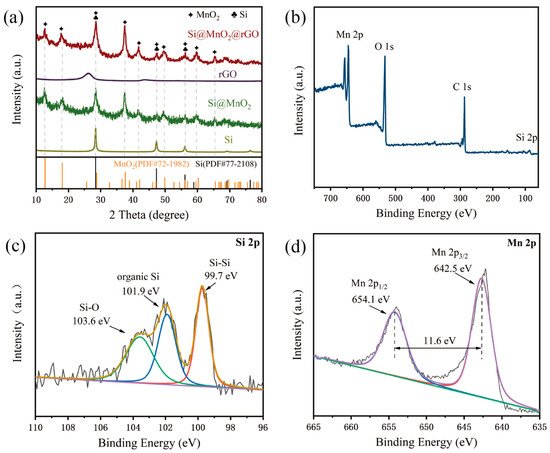
Figure 4a shows the XRD patterns of rGO, Si, Si@MnO
2-50°C, and Si@MnO
2@rGO-50°C, respectively. In the XRD pattern of Si@MnO
2-50°C, the pronounced peaks at 28.5°, 47.4°, 56.2°,58.9°, 69.2°, 76.5°, and 88.2° corresponded to the (111), (220), (311), (222), (400), (331), and (422) planes of Si (PDF#77-2108). In addition, the characteristic peaks at 12.7°, 18.0°, 28.7°, 37.6°, 41.1°, 49.8°, 59.5°, 65.5°, 68.5°, and 72.5° corresponded to the (110), (200), (310), (121), (420), (411), (260), (002), (202), and (631) planes of MnO
2 (PDF#72-1982). The XRD pattern of the Si@MnO
2@rGO-50°C composites contained peaks corresponding to Si and MnO
2, as well as the broad peak ranges from 20° to 30°, which were indexed to the standard peaks of rGO
[6][7][8][9].
Figure 4b shows the XPS spectrum of the Si@MnO
2@rGO-50°C composites, which revealed the presence of Si, Mn, O, and C, corresponding to element mapping (
Figure 3d–g).
Figure 4c,d shows the high-resolution XPS spectra.
Figure 4c shows the Si 2p spectrum, whose peak at 99.7 eV was related to Si-Si bonds; two small peaks at 101.9 and 103.6 eV contributed to organic Si and Si-O, respectively, which may have been caused by the slight oxidation of Si in the thermal-treated process.
Figure 4d shows the Mn 2p spectrum, which contained two spin–orbit peaks corresponding to Mn 2p
3/2 (642.5 eV) and Mn 2p
1/2 (654.1 eV) of MnO
2, whose separation between these peaks was 11.6 eV.
Figure 4. (a) X-ray diffraction (XRD) patterns of the Si, Si@MnO2-50°C rGO, and Si@MnO2@rGO-50°C, respectively. (b–d) XPS spectra of the Si@MnO2@rGO-50°C.
2. Lithium-Ion Battery Performance
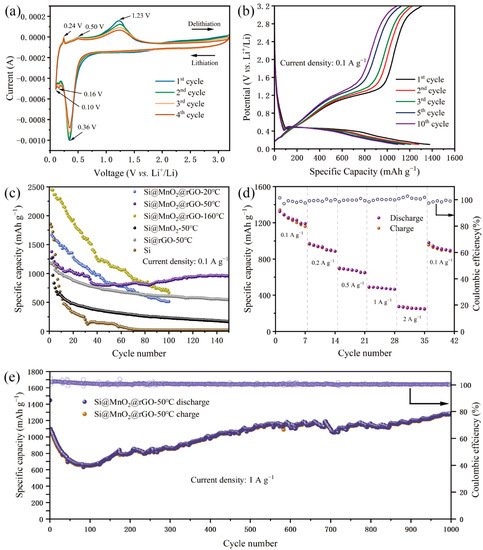
A CV experiment carried out to further evaluate the lithium storage behavior has been shown in Figure 5. Figure 5a shows the CV curves of Si@MnO2@rGO-50°C as the independent anodes of lithium-ion batteries for the first four cycles at a scan rate of 0.1 mV s-1 between 0.1 V and 3.2 V. In the first cycle, a clear cathodic peak at 0.16 V corresponds to the lithium alloying process of crystalline Si and the formation of an amorphous LixSi phase, and a clear cathodic peak at 0.10 V corresponds to the formation of the Li15Si4 phase. An anodic peak at 0.24 V is related to the delithiation of Li15Si4, and an anodic peak at 0.50 V is related to the transition from the LixSi phase to amorphous Si according to Eq (1) and Eq (2).
Figure 5. (a) CV curves of the Si@MnO2@rGO-50°C at 0.1 mV s−1 between 0.1 V and 3.2 V. (b) Galvanostatic charge–discharge curves of the Si@MnO2@rGO-50°C at 0.1 A g−1. (c) Long-term cycling performance of the Si, Si@MnO2-50°C, Si@rGO-50°C, Si@MnO2@rGO-20°C, Si@MnO2@rGO-50°C, and Si@MnO2@rGO-160°C at 0.1 A g−1. (d) Rate performance of the Si@MnO2@rGO-50°C. (e) Long-term cycling performance of the Si@MnO2@rGO-50°C at 1 A g−1.
The redox peaks of Si coincided with those reported previously
[10][11][12]. In addition, the reversible redox peaks at 1.23 and 0.36 V, respectively, were consistent with the lithiation and delithiation reactions of MnO
2, according to Equation (3). When the cathodic peak was 0.36 V, Li was inserted into the anode to form LiO
2 and MnO
2 was reduced to Mn. An anodic peak at 1.23 V was related to the charging process of the lithium ion battery; Mn can facilitate the decomposition of LiO
2.
In the subsequent scans, the redox peaks were largely coincident, which was attributed to the stability of the Si@MnO2@rGO-50°C, indicating the good electrochemical reversibility for lithium-ion batteries.
Figure 5b shows the galvanostatic discharge/charge curves of Si@MnO2@rGO-50°C at 0.1 A g−1 over the range between 0.1 V and 3.2 V. In the first cycle, the initial discharge capacity was 1378.15 mAh g−1. In the second, third, fifth, and 10th cycles, the discharge specific capacities were 1279.21, 1208.02, 1150.74, and 1093.70 mAh g−1, respectively. In the subsequent cycles, the charge and discharge curves basically overlapped, which indicated good capacity retention. In addition, the plateau of Si at 0.5 V in the figure was consistent with the CV results.
Figure 5c shows the cycling performances of the anode (Si, Si@MnO
2-50°C, Si@MnO
2@rGO-20°C, Si@MnO
2@rGO-50°C, and Si@MnO
2@rGO-160°C) at a current density of 0.1 A g
−1. Of these samples, Si@MnO
2@rGO-50°C showed the best cycling performance. The initial discharge specific capacity of Si was 1855.62 mAh g
−1. The initial specific capacity of Si@rGO-50°C was 1180.41 mAh g
−1; after 150 cycles, the capacity was maintained at 543.84 mAh g
−1 (
Figure 5c). Interestingly, the structure of rGO encapsulating the sea urchin-like Si@MnO
2-50°C mitigated the volume-change effects of Si nanospheres, improving the electrical conductivity and contributing to the high capacity when comparing the Si and Si@MnO
2-50°C. A comparison of the rate and cycling performances of the sea urchin-like Si@MnO
2@rGO-50°C, at different various current densities, is shown in
Figure 5d. At current densities of 0.1, 0.2, 0.5, 1, and 2 A g
−1, the specific charging capacities were 1323.87, 971.85, 701.12, 491.85, and 272.47 mAh g
−1, respectively. Furthermore, when the current density rose again to 0.1 A g
−1, the specific charging capacity recovered to 981.68 mAh g
−1 and the capacity retention rate was 74.2%. Compared to previous reports of Si and Si@rGO, Si@MnO
2@rGO-50°C demonstrated a long lifetime and high capacity retention rates
[13][14]. Furthermore, to evaluate the cycling stability at high current densities, Si@MnO
2@rGO-50°C was tested at 1 Ah g
−1 (
Figure 5e). In the first charge/discharge cycle, the specific capacity was 1446.85 mAh g
−1; after 1000 cycles, the specific capacity was 1282.72 mAh g
−1 with a coulombic efficiency of 99.4%. The composite material also showed excellent cycling performance at high currents. The decrease in capacity fluctuations at the first 80 cycles was due to the irreversible formation of SEI film on the materials’ surface.
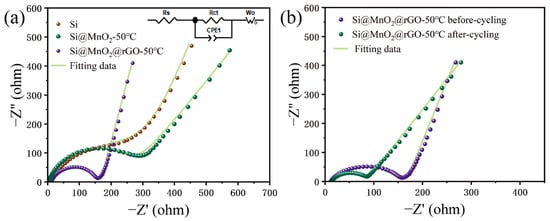
EIS measurements were carried out to further investigate the electrochemical mechanism shown in
Figure 6.
Figure 6a shows the EIS plots and corresponding fitting plots of Si, Si@MnO
2-50°C, and Si@MnO
2@rGO-50°C, respectively. Additionally, the inset shows the data equivalent circuit diagrams. The EIS diagram consists of a semicircle in the mid-high-frequency region and a diagonal line in the low-frequency region. Here, R
CT in the mid-frequency region corresponds to the charge-transfer impedance and W
O in the low-frequency region corresponds to the diffusion of Li
+ inside the electrode material
[15][16].
Figure 6b shows the EIS plots and corresponding fitting plots of Si@MnO
2@rGO-50°C before and after 150 cycles at 0.1 A g
−1; cycled Si@MnO
2@rGO-50°C was fitted with the same equivalent circuit model in
Figure 6a. The R
CT (72.7 Ω) was lower after cycling, which implies the charge transfer impedance decreased substantially, demonstrating the stable SEI film and good structure stability during cycling of Si@MnO
2@rGO-50°C.
Figure 6. (a) The electrochemical impedance spectra of Si, Si@MnO2-50°C, and Si@MnO2@rGO-50°C. The inset shows the equivalent circuit model. (b) The electrochemical impedance spectra of the Si@MnO2@rGO-50°C before and after cycling.
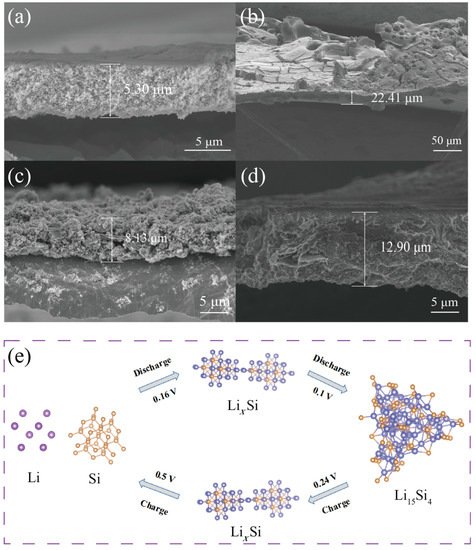
Figure 7a,b shows the cross-sectional SEM images of Si before and after 150 cycles at 0.1 A g
−1. After cycles, the volume expansion was ~323% (from 5.3 μm to 22.41 μm). The huge change in volume expansion of Si may have contributed to the intercalation and deintercalation of lithium ions during cycles and the exfoliation of the active materials. The mechanism of the Si electrode reaction was further illustrated in
Figure 7e. The lithiation of Si resulted in the formation of an amorphous silicon–lithium alloy (Li
xSi) (0.16 V). Then, the amorphous Li
xSi was transformed to crystalline Li
15Si
4 (0.1 V). The delithiation process involves the transformation from crystalline Li
15Si
4 to amorphous Li
xSi (0.24 V) and, finally, to amorphous Si (0.5 V)
[ 58 , 59 , 60 ]。
Figure 7. (a)&(b) Cross-sectional SEM images of Si before and after 150 cycles. (c)&(d) Cross-sectional SEM images of Si@MnO2@rGO-50℃ before and after 150 cycles. (e) The mechanism of intercalation and deintercalation of lithium ions.
 +1 credit