 +1 credit
Video Upload Options
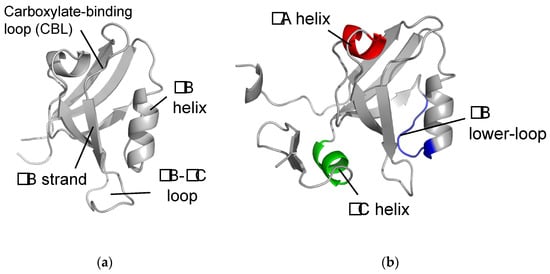
Allosterism is a phenomenon where communication exists within a biological macromolecule between the ligand-binding site and a distal region. Dynamic allosterism allows the propagation of signal throughout a protein. The PDZ (PSD-95/Dlg1/ZO-1) family has been named as a classic example of dynamic allostery in small modular domains. While the PDZ family consists of more than 200 domains, previous efforts have primarily focused on a few well-studied PDZ domains, including PTP-BL PDZ2, PSD-95 PDZ3, and Par6 PDZ. Taken together, experimental and computational studies have identified regions of these domains that are dynamically coupled to ligand binding. These regions include the αA helix, the αB lower-loop, and the αC helix. In this review, we summarize the specific residues on the αA helix, the αB lower-loop, and the αC helix of PTP-BL PDZ2, PSD-95 PDZ3, and Par6 PDZ that have been identified as participants in dynamic allostery by either experimental or computational approaches.
1. Background
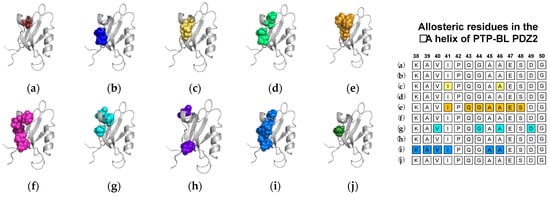
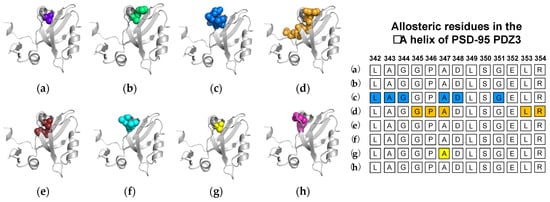
2. The αA Helix
2.1. Agreement between Experimental and Computational Techniques: PTP-BL PDZ2
2.2. Computational Conclusions Lacking Experimental Support: PSD-95 PDZ3
2.3. Two-Way Communication in Par-6 PDZ
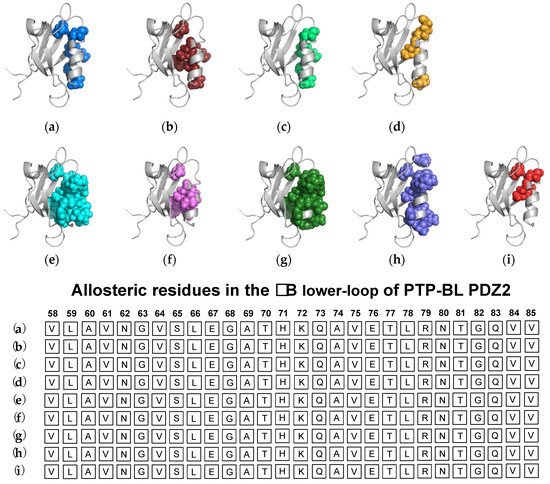
3. The αB Lower-Loop
3.1. Agreement between Experimental and Computational Techniques: PTP-BL PDZ2
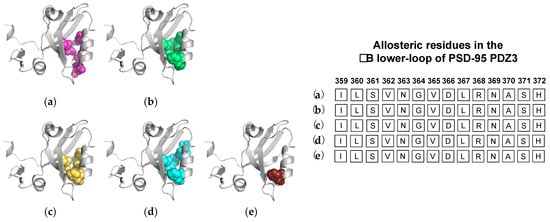
3.2. Computational Conclusions Lacking Experimental Support: PSD-95 PDZ3
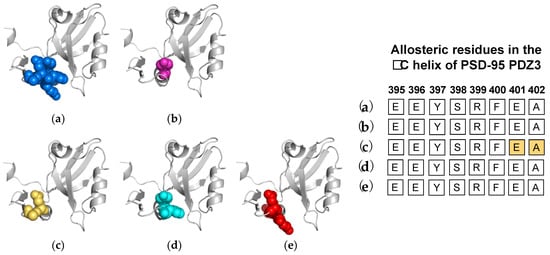
4. The αC Helix in PSD-95 PDZ3
References
- Cooper, A.; Dryden, D.T.F. Allostery without conformational change. Eur. Biophys. J. 1984, 11, 103–109.
- Hilser, V.J.; Wrabl, J.O.; Motlagh, H.N. Structural and Energetic Basis of Allostery. Annu. Rev. Biophys. 2012, 41, 585–609.
- Campitelli, P.; Modi, T.; Kumar, S.; Banu Ozkan, S. The Role of Conformational Dynamics and Allostery in Modulating Protein Evolution. Annu. Rev. Biophys. 2020, 49, 267–288.
- Cui, Q.; Karplus, M. Allostery and cooperativity revisited. Protein Sci. 2008, 17, 1295–1307.
- Gunasekaran, K.; Ma, B.; Nussinov, R. Is allostery an intrinsic property of all dynamic proteins? Proteins Struct. Funct. Bioinform. 2004, 57, 433–443.
- Nussinov, R.; Tsai, C.-J.; Ma, B. The Underappreciated Role of Allostery in the Cellular Network. Annu. Rev. Biophys. 2013, 42, 169–189.
- Christensen, N.R.; Čalyševa, J.; Fernandes, E.F.A.; Lüchow, S.; Clemmensen, L.S.; Haugaard-Kedström, L.M.; Strømgaard, K. PDZ Domains as Drug Targets. Adv. Ther. 2019, 2, 1800143.
- Kennedy, M.B. Origin of PDZ (DHR, GLGF) domains. Trends Biochem. Sci. 1995, 20, 350.
- Ponting, C.P. Evidence for PDZ domains in bacteria, yeast, and plants. Protein Sci. 2008, 6, 464–468.
- Cabral, J.H.M.; Petosa, C.; Sutcliffe, M.J.; Raza, S.; Byron, O.; Poy, F.; Marfatia, S.M.; Chishti, A.H.; Liddington, R.C. Crystal structure of a PDZ domain. Nature 1996, 382, 649–652.
- Van Ham, M.; Hendriks, W. PDZ domains-glue and guide. Mol. Biol. Rep. 2003, 30, 69–82.
- Kim, E.; Sheng, M. PDZ domain proteins of synapses. Nat. Rev. Neurosci. 2004, 5, 771–781.
- Ye, F.; Zhang, M. Structures and target recognition modes of PDZ domains: Recurring themes and emerging pictures. Biochem. J. 2013, 455, 1–14.
- Harris, B.Z.; Lim, W.A. Mechanisma and role of PDZ domains in signaling complex assembly. J. Cell Sci. 2001, 114, 3219–3231.
- Brakeman, P.R.; Lanahan, A.A.; O’Brien, R.; Roche, K.; Barnes, C.A.; Huganir, R.L.; Worley, P.F. Homer: A protein that selectively binds metabotropic glutamate receptors. Nature 1997, 386, 284–288.
- Romero, G.; Von Zastrow, M.; Friedman, P.A. Role of PDZ Proteins in Regulating Trafficking, Signaling, and Function of GPCRs. Means, Motif, and Opportunity. Adv. Pharmacol. 2011, 62, 279–314.
- Doyle, D.A.; Lee, A.; Lewis, J.; Kim, E.; Sheng, M.; MacKinnon, R. Crystal structures of a complexed and peptide-free membrane protein- binding domain: Molecular basis of peptide recognition by PDZ. Cell 1996, 85, 1067–1076.
- Pedersen, S.W.; Pedersen, S.B.; Anker, L.; Hultqvist, G.; Kristensen, A.S.; Jemth, P.; Strømgaard, K. Probing backbone hydrogen bonding in bePDZ/ligand interactions by protein amide-to-ester mutations. Nat. Commun. 2014, 5, 3215.
- Walma, T.; Spronk, C.A.E.M.; Tessari, M.; Aelen, J.; Schepens, J.; Hendriks, W.; Vuister, G.W. Structure, dynamics and binding characteristics of the second PDZ domain of PTP-BL. J. Mol. Biol. 2002, 316, 1101–1110.
- Lockless, S.W.; Ranganathan, R. Evolutionarily conserved pathways of energetic connectivity in protein families. Science 1999, 286, 295–299.
- Kumawat, A.; Chakrabarty, S. Hidden electrostatic basis of dynamic allostery in a PDZ domain. Proc. Natl. Acad. Sci. USA 2017, 114, E5825–E5834.
- De Los Rios, P.; Cecconi, F.; Pretre, A.; Dietler, G.; Michielin, O.; Piazza, F.; Juanico, B. Functional dynamics of PDZ binding domains: A normal-mode analysis. Biophys. J. 2005, 89, 14–21.
- Von Ossowski, I.; Oksanen, E.; von Ossowski, L.; Cai, C.; Sundberg, M.; Goldman, A.; Keinänen, K. Crystal structure of the second PDZ domain of SAP97 in complex with a GluR-AC-terminal peptide. FEBS J. 2006, 273, 5219–5229.
- Grembecka, J.; Cierpicki, T.; Devedjiev, Y.; Derewenda, U.; Kang, B.S.; Bushweller, J.H.; Derewenda, Z.S. The Binding of the PDZ Tandem of Syntenin to Target Proteins. Biochemistry 2006, 45, 3674–3683.
- Chen, Q.; Niu, X.; Xu, Y.; Wu, J.; Shi, Y. Solution structure and backbone dynamics of the AF-6 PDZ domain/Bcr peptide complex. Protein Sci. 2007, 16, 1053–1062.
- Tochio, H.; Hung, F.; Li, M.; Bredt, D.S.; Zhang, M. Solution structure and backbone dynamics of the second PDZ domain of postsynaptic density-95. J. Mol. Biol. 2000, 295, 225–237.
- Fuentes, E.J.; Der, C.J.; Lee, A.L. Ligand-dependent Dynamics and Intramolecular Signaling in a PDZ Domain. J. Mol. Biol. 2004, 335, 1105–1115.
- Gianni, S.; Walma, T.; Arcovito, A.; Calosci, N.; Bellelli, A.; Engström, Å.; Travaglini-Allocatelli, C.; Brunori, M.; Jemth, P.; Vuister, G.W. Demonstration of Long-Range Interactions in a PDZ Domain by NMR, Kinetics, and Protein Engineering. Structure 2006, 14, 1801–1809.
- Dhulesia, A.; Gsponer, J.; Vendruscolo, M. Mapping of two networks of residues that exhibit structural and dynamical changes upon binding in a PDZ domain protein. J. Am. Chem. Soc. 2008, 130, 8931–8939.
- Niu, X.; Chen, Q.; Zhang, J.; Shen, W.; Shi, Y.; Wu, J. Interesting structural and dynamical behaviors exhibited by the AF-6 PDZ domain upon Bcr peptide binding. Biochemistry 2007, 46, 15042–15053.
- Morra, G.; Genoni, A.; Colombo, G. Mechanisms of differential allosteric modulation in homologous proteins: Insights from the analysis of internal dynamics and energetics of PDZ domains. J. Chem. Theory Comput. 2014, 10, 5677–5689.
- Lu, C.; Knecht, V.; Stock, G. Long-Range Conformational Response of a PDZ Domain to Ligand Binding and Release: A Molecular Dynamics Study. J. Chem. Theory Comput. 2016, 12, 870–878.
- Miño-Galaz, G.A. Allosteric communication pathways and thermal rectification in pdz-2 protein: A computational study. J. Phys. Chem. B 2015, 119, 6179–6189.
- Peterson, F.C.; Penkert, R.R.; Volkman, B.F.; Prehoda, K.E. Cdc42 regulates the Par-6 PDZ domain through an allosteric CRIB-PDZ transition. Mol. Cell 2004, 13, 665–676.
- Fuentes, E.J.; Gilmore, S.A.; Mauldin, R.V.; Lee, A.L. Evaluation of Energetic and Dynamic Coupling Networks in a PDZ Domain Protein. J. Mol. Biol. 2006, 364, 337–351.
- Petit, C.M.; Zhang, J.; Sapienza, P.J.; Fuentes, E.J.; Lee, A.L. Hidden dynamic allostery in a PDZ domain. Proc. Natl. Acad. Sci. USA 2009, 106, 18249–18254.
- Zhang, J.; Petit, C.M.; King, D.S.; Lee, A.L. Phosphorylation of a PDZ domain extension modulates binding affinity and interdomain interactions in postsynaptic density-95 (PSD-95) protein, a membrane-associated guanylate kinase (MAGUK). J. Biol. Chem. 2011, 286, 41776–41785.
- Swain, J.; Gierasch, L.M. The changing landscape of protein allostery. Curr. Opin. Struct. Biol. 2006, 16, 102–108.
- Jemth, P.; Gianni, S. PDZ Domains: Folding and Binding. Biochemistry 2007, 46, 8701–8708.
- Tsai, C.J.; Del Sol, A.; Nussinov, R. Protein allostery, signal transmission and dynamics: A classification scheme of allosteric mechanisms. Mol. Biosyst. 2009, 5, 207–216.
- Smock, R.G.; Gierasch, L.M. Sending signals dynamically. Science 2009, 324, 198–203.
- Ivarsson, Y. Plasticity of PDZ domains in ligand recognition and signaling. FEBS Lett. 2012, 586, 2638–2647.
- Lee, A.L. Contrasting roles of dynamics in protein allostery: NMR and structural studies of CheY and the third PDZ domain from PSD-95. Biophys. Rev. 2015, 7, 217–226.
- Gautier, C.; Laursen, L.; Gianni, S. Seeking allosteric networks in PDZ domains. Protein Eng. Des. Sel. 2018, 31, 367–373.
- Van Den Berk, L.C.J.; Landi, E.; Walma, T.; Vuister, G.W.; Dente, L.; Hendriks, W.J.A.J. An allosteric intramolecular PDZ-PDZ interaction modulates PTP-BL PDZ2 binding specificity. Biochemistry 2007, 46, 13629–13637.
- Kong, Y.; Karplus, M. Signaling pathways of PDZ2 domain: A molecular dynamics interaction correlation analysis. Proteins Struct. Funct. Bioinform. 2009, 74, 145–154.
- Kalescky, R.; Liu, J.; Tao, P. Identifying key residues for protein allostery through rigid residue scan. J. Phys. Chem. A 2015, 119, 1689–1700.
- Cilia, E.; Vuister, G.W.; Lenaerts, T. Accurate Prediction of the Dynamical Changes within the Second PDZ Domain of PTP1e. PLoS Comput. Biol. 2012, 8, 1002794.
- Ota, N.; Agard, D.A. Intramolecular signaling pathways revealed by modeling anisotropic thermal diffusion. J. Mol. Biol. 2005, 351, 345–354.
- Gerek, Z.N.; Ozkan, S.B. Change in allosteric network affects binding affinities of PDZ domains: Analysis through perturbation response scanning. PLoS Comput. Biol. 2011, 7, 1002154.
- Kozlov, G.; Gehring, K.; Ekiel, I. Solution Structure of the PDZ2 Domain from Human Phosphatase hPTP1E and Its Interactions with C-Terminal Peptides from the Fas Receptor. Biochemistry 2000, 39, 2572–2580.
- Kozlov, G.; Banville, D.; Gehring, K.; Ekiel, I. Solution structure of the PDZ2 domain from cytosolic human phosphatase hPTP1E complexed with a peptide reveals contribution of the beta2-beta3 loop to PDZ domain-ligand interactions. J. Mol. Biol. 2002, 320, 813–820.
- Raimondi, F.; Felline, A.; Seeber, M.; Mariani, S.; Fanelli, F. A mixed protein structure network and elastic network model approach to predict the structural communication in biomolecular systems: The PDZ2 domain from tyrosine phosphatase 1E as a case study. J. Chem. Theory Comput. 2013, 9, 2504–2518.
- Kalescky, R.; Zhou, H.; Liu, J.; Tao, P. Rigid Residue Scan Simulations Systematically Reveal Residue Entropic Roles in Protein Allostery. PLoS Comput. Biol. 2016, 12, e1004893.
- Bozovic, O.; Zanobini, C.; Gulzar, A.; Jankovic, B.; Buhrke, D.; Post, M.; Wolf, S.; Stock, G.; Hamm, P. Real-time observation of ligand-induced allosteric transitions in a PDZ domain. Proc. Natl. Acad. Sci. USA 2020, 117, 26031–26039.
- McLaughlin, R.N., Jr.; Poelwijk, F.J.; Raman, A.; Gosal, W.S.; Ranganathan, R. The spatial architecture of protein function and adaptation. Nature 2012, 491, 138–142.
- Gianni, S.; Haq, S.R.; Montemiglio, L.C.; Jürgens, M.C.; Engström, Å.; Chi, C.N.; Brunori, M.; Jemth, P. Sequence-specific long range networks in PSD-95/Discs large/ZO-1 (PDZ) domains tune their binding selectivity. J. Biol. Chem. 2011, 286, 27167–27175.
- Du, Q.-S.; Wang, C.-H.; Liao, S.-M.; Huang, R.-B. Correlation Analysis for Protein Evolutionary Family Based on Amino Acid Position Mutations and Application in PDZ Domain. PLoS ONE 2010, 5, e13207.
- Ho, B.K.; Agard, D.A. Conserved tertiary couplings stabilize elements in the PDZ fold, leading to characteristic patterns of domain conformational flexibility. Protein Sci. 2010, 19, 398–411.
- Garrard, S.M.; Capaldo, C.T.; Gao, L.; Rosen, M.K.; Macara, I.G.; Tomchick, D.R. Structure of Cdc42 in a complex with the GTPase-binding domain of the cell polarity protein, Par6. EMBO J. 2003, 22, 1125–1133.
- Penkert, R.; DiVittorio, H.M.; Prehoda, K.E. Internal recognition through PDZ domain plasticity in the Par-6-Pals1 complex. Nat. Struct. Mol. Biol. 2004, 11, 1122–1127.
- Fujiwara, Y.; Goda, N.; Tamashiro, T.; Narita, H.; Satomura, K.; Tenno, T.; Nakagawa, A.; Oda, M.; Suzuki, M.; Sakisaka, T.; et al. Crystal structure of afadin PDZ domain–nectin-3 complex shows the structural plasticity of the ligand-binding site. Protein Sci. 2015, 24, 376–385.
- Bozovic, O.; Jankovic, B.; Hamm, P. Sensing the allosteric force. Nat. Commun. 2020, 11, 5841.


