Your browser does not fully support modern features. Please upgrade for a smoother experience.
Submitted Successfully!
 +1 credit
Thank you for your contribution! You can also upload a video entry or images related to this topic.
For video creation, please contact our Academic Video Service.
| Version | Summary | Created by | Modification | Content Size | Created at | Operation |
|---|---|---|---|---|---|---|
| 1 | Massimo Donadelli | + 3221 word(s) | 3221 | 2022-02-18 07:00:50 | | | |
| 2 | Rita Xu | Meta information modification | 3221 | 2022-02-18 08:57:43 | | |
Video Upload Options
We provide professional Academic Video Service to translate complex research into visually appealing presentations. Would you like to try it?
Cite
If you have any further questions, please contact Encyclopedia Editorial Office.
Donadelli, M. Wild-Type P53-Dependent Secretome. Encyclopedia. Available online: https://encyclopedia.pub/entry/19616 (accessed on 28 July 2026).
Donadelli M. Wild-Type P53-Dependent Secretome. Encyclopedia. Available at: https://encyclopedia.pub/entry/19616. Accessed July 28, 2026.
Donadelli, Massimo. "Wild-Type P53-Dependent Secretome" Encyclopedia, https://encyclopedia.pub/entry/19616 (accessed July 28, 2026).
Donadelli, M. (2022, February 18). Wild-Type P53-Dependent Secretome. In Encyclopedia. https://encyclopedia.pub/entry/19616
Donadelli, Massimo. "Wild-Type P53-Dependent Secretome." Encyclopedia. Web. 18 February, 2022.
Copy Citation
The wild-type p53 protein prevents tumorigenesis by regulating a plethora of signaling pathways. The importance of the p53 tumor suppressive activity is not only primarily involved within cells to limit tumor cell proliferation but also in the extracellular microenvironment of cancer. Thus, p53 has a profound impact on the secretome composition of cancer cells and reducing the transition to invasiveness.
wild-type p53
secretome
pancreatic ductal adenocarcinoma
1. Introduction
Pancreatic ductal adenocarcinoma (PDAC) is one of the most invasive solid tumors and its incidence is increasing worldwide [1][2]. The molecular complexity and the absence of early specific symptoms, as well as the efficient methods for its early detection, ensure that only about 20% of pancreatic cancers are detected early enough to be surgically resectable [3]. In fact, around 50% of diagnosed PDAC patients present with metastatic disease [3]. One of the most important proteins involved in inducing cell cycle arrest, DNA repair or programmed cell death is the tumor suppressor protein p53, which controls a wide range of cellular biological processes to prevent the outgrowth of aberrant cells [4]. In response to various cellular insults that include oxidative stress and oncogenic signaling, p53 is activated and acts as a sequence-specific transcription factor [5][6]. P53′s potency in suppressing abnormal clonal outgrowth is inhibited in many cancer types including PDAC, in which p53 dysfunctions are frequent [7][8][9]. The most common p53 mutations are missense mutations in the DNA-binding domain (DBD) [10]. In addition to the loss of its function, mutant p53 proteins may exert a dominant negative effect, inhibiting the function of wild-type p53 (WTp53) by preventing it from binding to the promoter of its target genes, and may have gain-of-function activities, exhibiting oncogenic properties [11][12]. Several studies highlight the contrasting roles between WT and mutant p53. Their recent studies reveal that in contrast to the WTp53 roles, mutant p53 induces aberrant alterations in cancer metabolism and reactive oxygen species (ROS) production, contributing to pancreas cancer development and chemoresistance [13][14][15].
A growing importance is emerging to consider not only the intracellular roles of p53 but also its extracellular impact in the regulation of the cancer microenvironment, which is important also for the identification of targeted cancer therapies and novel serum biomarkers. Their previous study reveals the functional effect of hot-spot p53 mutants on cancer cell secretome which promote oncogenic roles as chemoresistance, cell migration and epithelial-mesenchymal transition [16][17].
2. Cancer Cell Secretome of Wild-Type P53 PDAC Cells Exhibits Suppressor Roles
Researchers previously published that gain-of-function mutant p53 isoforms exert their hyper-proliferative effects on cancer cells also through the alteration of their secretome [16]. Here, they aimed to study whether WTp53 may exhibit suppressor roles through its influence on the secretome of PDAC cells, in accordance with the tumor suppressor role of WTp53. By using the previously published approach [16], researchers induced the exogenous expression of WTp53 in p53-null AsPC-1 PDAC cells by using liposome-mediated transient transfection assay. In WTp53 PaCa3 cells, the endogenous p53 protein expression was transiently knocked down by transfection with siRNA. Forty-eight hours later, they checked the effective overexpression of p53 in AsPC-1 or knocking-down of WTp53 in PaCa3 cells by Western blotting and functionally analyzed their effect on cell growth induced by the presence or lack of wild-type p53, compared with their respective control (Figure 1A). Subsequently, AsPC-1 or PaCa3 transfected cells were washed in PBS and then incubated in fresh culture medium for further 22 h to accumulate secreted proteins. The conditioned medium (CM) released by transfected AsPC-1 or PaCa3 cells was transferred to untransfected p53-null AsPC-1 cells, which were thus cultivated for 48 h with the secretome driven by the presence or absence of wild-type p53. This allowed us to study the functional effects of the secretome driven by wild-type p53 overexpression or by p53 knock-down, each one compared by their respective control. In accordance with the tumor suppressor role of wild-type p53, Figure 1B,C show that p53-driven secretome is able to inhibit cell growth and promote apoptosis in AsPC-1 cells, as compared to its negative mock control. On the contrary, the conditioned medium of PaCa3 with silenced p53, is able to promote hyper-proliferative effects and to inhibit cell death of AsPC-1 cells, as compared to its negative control. The absence of extracellular p53 in WTp53-driven CM of AsPC-1 was previously proved by Western blotting [16] and then further confirmed by mass spectrometry analysis in both AsPC-1 and PaCa3 cells. Furthermore, since p53 is able to transactivate autophagy-related genes and to induce autophagy flux [18][19], researchers wondered whether even the conditioned medium driven by p53 can sustain autophagy. Figure 1D shows that WTp53-driven secretome promotes autophagic vesicles. Specifically, the conditioned medium released by transfected AsPC-1 expressing WTp53 is able to promote autophagosome formation in untransfected AsPC-1 cells. Altogether, these data provide evidence that WTp53 influences the secretion of proteins or other molecules that can functionally contribute to the regulation of cell growth and cell death-related phenomena, such as apoptosis and autophagy responses.
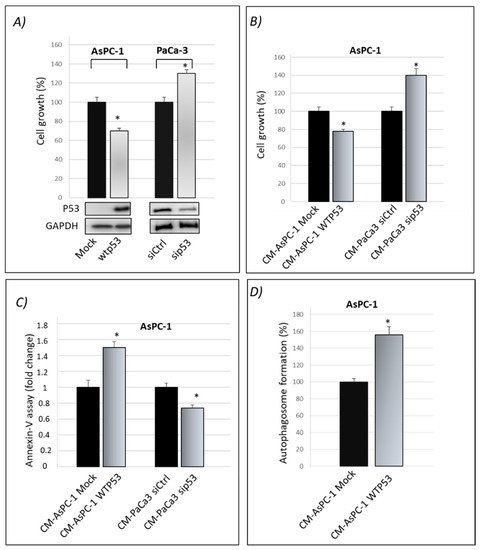
Figure 1. Cancer cell secretome driven by wild-type p53 exhibits oncosuppressor roles. (A) Cell growth was measured by Cristal Violet assay in p53-null AsPC-1 cells transfected for overexpression of wtp53 and in PaCa3 after knocking-down of endogenous p53 to verify the transfection efficiency. Accompanying Western blotting of p53 and of GAPDH for control loading are reported. Statistical analysis * p < 0.05 wtp53 vs. Mock AsPC-1; sip53 vs. siCtrl PaCa3. (B) Cell growth was measured by Cristal Violet assay in untransfected p53-null AsPC-1 cells cultivated with WTp53-CM from AsPC1 or with sip53-CM from PaCa3, each one compared by their respective control. Statistical analysis * p < 0.05 CM-AsPC-1 WTp53 vs. CM-Mock; CM-PaCa3 sip53 vs. CM-Paca3 siCtrl. (C) Apoptosis was determined by the annexinV/FITC binding assay in AsPC-1 cultivated with wtp53-derived CM of AsPC-1 or with sip53-CM from PaCa3, each one compared by their respective control. Statistical analysis * p < 0.05 CM-AsPC-1 WTp53 vs. CM-Mock; CM-PaCa3 sip53 vs. CM-Paca3 siCtrl. (D) Autophagosome formation assay was determined by intracellular staining using the MDC probe in AsPC-1 cultivated with WTp53-derived CM of AsPC-1. Statistical analysis * p < 0.05 CM-AsPC-1wtp53 vs. CM-Mock.
3. Wild-Type P53-Driven Secretome Counteracts Chemoresistance in PDAC Cells
A crucial oncosuppressor role induced by WTp53 is the stimulation of pancreatic cancer cell sensitivity to the treatment with the drug gemcitabine (GEM) [15][20]. Thus, researchers investigated whether cancer cell secretome driven by WTp53 is able to promote PDAC cell chemosensitivity. They observed that GEM treatment inhibited cell growth of AsPC-1 cells cultivated with CM derived by siCtrl-PaCa3 (Figure 2). Remarkably, GEM sensitivity of AsPC-1 cells was counteracted when cultivated in CM derived by sip53-PaCa3 cells (Figure 2), indicating a role for p53-driven secretome in the response to GEM. These data functionally demonstrate that wild-type p53 can exert its oncosuppressor role in PDAC cells through the regulation of its secretome, in line with the tumor suppressor role of p53 [21][22].
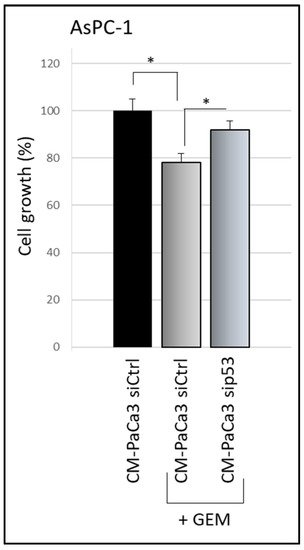
Figure 2. p53-driven secretome counteracts chemoresistance effects. Cell growth was measured by Cristal Violet assay in p53-null AsPC-1 cells cultivated with CM of sip53-PaCa3, or its control, and treated with 1 μM GEM for 48 h. Statistical analysis * p < 0.05 CM-Paca3 siCtrl vs. CM-Paca3 siCtrl + GEM; CM-PaCa3 sip53 + GEM vs. CM-Paca3 siCtrl + GEM.
4. Mutp53-Driven Secretome Stimulates Cancer Cell Migration
Since WTp53 has been reported to inhibit cancer cell migration, researchers also investigated whether WTp53-induced modulation of secretome can have a role in this phenomenon. Using the same methodological approach described in Figure 1, they discovered that WTp53-CM is able to reduce the migration rate of AsPC-1 cells, as compared to mock-CM control (mock-CM) (Figure 3). In particular, researchers observed a slower wound closure in p53-null AsPC-1 cells cultivated with WTp53-driven secretome, as compared to CM derived from its mock control. This result is in line with their previous data demonstrating that mutant p53-driven secretome stimulates PDAC cell migration and further confirms the tumor suppressor role of WTp53 and of its secretome in cancer cells.
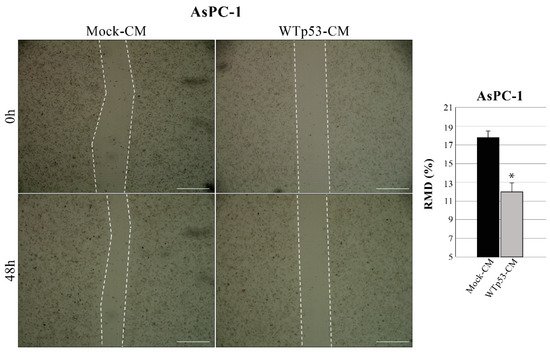
Figure 3. WTp53-driven secretome inhibits cancer cell migration. Wound closure cell assay on the confluent p53-null AsPC-1 cell monolayer cultivated with WTp53-derived conditioned medium (CM) as compared to CM derived from its mock control. A scratch was performed in the cell monolayer at time zero, after that researchers monitored cell migration for 48 h. The images were analyzed quantitatively by using ImageJ computing software. Migration ability expressed as relative migration distance (RMD) decreased in cells cultured with WTp53-derived CM. Statistical analysis * p < 0.05 CM-WTp53 vs. CM-Mock. Scale bar: 500 µm.
5. Identification of Secreted Proteins from Wild-Type P53-Driven Secretome
After the investigation of the functional involvement of WTp53-driven secretome in the inhibition of PDAC cell growth and chemosensitivity to GEM, researchers aimed to identify the secreted proteins by WTp53 in PDAC cells. Thus, they compared the protein composition of the CM released by PaCa3 cells expressing WTp53 as compared to that of PaCa3 cells after p53 knock-down. To avoid protein cross-contamination by serum, cells were washed to remove DNA–liposome complexes and cultured for further 22 h to accumulate secreted proteins in serum-free culture medium. This serum-free culture period was previously identified as the maximum time period without delay of cell growth or signals of cell death, thus avoiding indiscriminate cellular lysis [16]. A peptide liquid chromatography separation followed by mass spectrometry analysis and database search with Protein Pilot and Mascot was then performed. SWATH-MS analyses were performed in triplicates for each analyzed sample, and they were imported in the Skyline software to perform the label-free quantification and the identification of hyper- and hyposecreted proteins. Researhers identified and quantified 210 secreted proteins in both p53 knock-down and WT PaCa3 cells. Among them, the quantitative proteomic analysis reported the modulation (fold change > 1.3 and p-value < 0.05) of 47 secreted proteins, of which 30 were hyper secreted in p53 knock-down PaCa3 cells and 17 were hyposecreted (Table 1) compared to WTp53. Among the most hypersecreted proteins after p53-knock-down in PaCa3 cells there are GTP-binding protein Di-Ras2 (FC = 36.4), BCL-6 corepressor-like protein 1 (FC = 24.3), centrosomal protein of 78 kDa (FC = 23.7), glial fibrillary acidic protein (FC = 5.5), importin-5 (FC = 4.7), transferrin receptor protein 1 (FC = 3.8), isocitrate dehydrogenase (FC = 3.0), ATP-citrate synthase (FC = 2.9) and cathepsin B (FC = 2.6). On the other hand, p53 silencing caused a particular decrease in farnesyl pyrophosphate synthase (FC = 0.3), protein S100-A4 (FC = 0.3), transgelin-2 (FC = 0.3), tubulin beta-3 chain (FC = 0.3) and putative heat shock protein HSP 90-alpha A4 (FC = 0.3) in PaCa3 secretome.
Table 1. Forty-seven modulated proteins in PDAC secretome of knock-down p53 Paca3 cells, as compared to wild-type p53 cells identified by SWATH-MS technology (p < 0.05). Fold change (FC) represents the ratio between CM protein abundance of p53 knock-down (KD) and p53 wild-type PaCa3 cells.
| Uniprot ID | Uniprot Accession Name |
Protein Name | Gene Name | FC (KD/wt p53) | p-Value |
|---|---|---|---|---|---|
| O00410 | IPO5_HUMAN | Importin-5 | IPO5 | 4.7 | 4.31 × 10⁻⁴ |
| O75874 | IDHC_HUMAN | Isocitrate dehydrogenase | IDH1 | 3.0 | 3.56 × 10⁻⁴ |
| P01008 | ANT3_HUMAN | Antithrombin-III | SERPINC1 | 1.6 | 2.66 × 10⁻⁴ |
| P02786 | TFR1_HUMAN | Transferrin receptor protein 1 | TFRC | 3.8 | 8.59 × 10⁻⁴ |
| P04792 | HSPB1_HUMAN | Heat shock protein beta-1 | HSPB1 | 1.8 | 1.72 × 10⁻² |
| P04908 | H2A1_HUMAN | Histone H2A type 1-B/E | HIST1 | 2.1 | 2.39 × 10⁻³ |
| P07478 | TRY2_HUMAN | Trypsin-2 | PRSS2 | 1.3 | 4.27 × 10⁻² |
| P07858 | CATB_HUMAN | Cathepsin B | CTSB | 2.6 | 3.33 × 10⁻³ |
| P14136 | K2C8_HUMAN | Glial fibrillary acidic protein | GFAP | 5.5 | 1.49 × 10⁻² |
| P14555 | PA2GA_HUMAN | Phospholipase A2 | PLA2G2A | 2.4 | 1.86 × 10⁻⁴ |
| P19338 | NUCL_HUMAN | Nucleolin | NCL | 1.4 | 9.66 × 10⁻⁴ |
| P22692 | IBP4_HUMAN | Insulin-like growth factor-binding protein 4 | IGFBP4 | 1.9 | 9.48 × 10⁻³ |
| P25398 | RS12_HUMAN | 40S ribosomal protein S12 | RPS12 | 1.6 | 2.92 × 10⁻² |
| P37837 | TALDO_HUMAN | Transaldolase | TALDO1 | 1.4 | 4.35 × 10⁻³ |
| P40925 | MDHC_HUMAN | Malate dehydrogenase | MDH1 | 1.8 | 9.26 × 10⁻³ |
| P53396 | ACLY_HUMAN | ATP-citrate synthase | ACLY | 2.9 | 6.18 × 10⁻⁴ |
| P54652 | HSP7C_HUMAN | Heat shock-related 70 kDa protein 2 | HSPA2 | 1.7 | 6.79 × 10⁻³ |
| P62158 | CALM_HUMAN | Calmodulin | CALM1 | 1.5 | 1.31 × 10⁻² |
| P80188 | NGAL_HUMAN | Neutrophil gelatinase-associated lipocalin | LCN2 | 2.0 | 7.20 × 10⁻⁵ |
| Q01105 | SET_HUMAN | Protein SET | SET | 1.6 | 1.55 × 10⁻² |
| Q04828 | AK1C1_HUMAN | Aldo-keto reductase family 1 member C1 | AKR1C1 | 1.5 | 8.20 × 10⁻³ |
| Q15582 | BGH3_HUMAN | Transforming growth factor-beta-induced protein ig-h3 | TGFBI | 1.4 | 5.93 × 10⁻³ |
| Q32P51 | RA1L2_HUMAN | Heterogeneous nuclear ribonucleoprotein A1-like 2 | HNRNPA1L2 | 1.3 | 7.76 × 10⁻³ |
| Q5H9F3 | BCORL_HUMAN | BCL-6 corepressor-like protein 1 | BCORL1 | 24.3 | 5.74 × 10⁻⁵ |
| Q6UWE0 | LRSM1_HUMAN | E3 ubiquitin-protein ligase LRSAM1 | LRSAM1 | 2.2 | 6.48 × 10⁻³ |
| Q86TI0 | TBCD1_HUMAN | TBC1 domain family member 1 | TBC1D1 | 2.5 | 8.13 × 10⁻⁵ |
| Q92598 | HS105_HUMAN | Heat shock protein 105 kDa | HSPH1 | 1.9 | 1.65 × 10⁻² |
| Q96HU8 | DIRA2_HUMAN | GTP-binding protein Di-Ras2 | DIRAS2 | 36.4 | 4.02 × 10⁻⁴ |
| Q96QV6 | H2A1A_HUMAN | Histone H2A type 1-A | HIST1H2AA | 1.3 | 1.29 × 10⁻³ |
| A8MST6 | CEP78_HUMAN | Centrosomal protein of 78 kDa | CEP78 | 23.7 | 2.99 × 10⁻³ |
| B2RPK0 | HGB1A_HUMAN | Putative high mobility group protein B1-like 1 | HMGB1P1 | 0.6 | 8.43 × 10⁻³ |
| O14556 | G3P_HUMAN | Glyceraldehyde-3-phosphate dehydrogenase | GAPDHS | 0.5 | 2.66 × 10⁻² |
| P01034 | CYTC_HUMAN | Cystatin-C | CST3 | 0.6 | 4.58 × 10⁻³ |
| P02538 | K2C6B_HUMAN | Keratin, type II cytoskeletal 6A | KRT6A | 0.5 | 1.53 × 10⁻³ |
| P02768 | ALBU_HUMAN | Serum albumin | ALB | 0.6 | 4.06 × 10⁻⁴ |
| P07737 | PROF1_HUMAN | Profilin-1 | PFN1 | 0.5 | 9.28 × 10⁻⁶ |
| P08238 | HS90B_HUMAN | Heat shock protein HSP 90-beta | HSP90AB1 | 0.6 | 1.14 × 10⁻² |
| P14324 | FPPS_HUMAN | Farnesyl pyrophosphate synthase | FDPS | 0.3 | 9.93 × 10⁻⁴ |
| P23284 | PPIB_HUMAN | Peptidyl-prolyl cis-trans isomerase B | PPIB | 0.7 | 1.40 × 10⁻² |
| P26447 | S10A4_HUMAN | Protein S100-A4 | S100A4 | 0.3 | 1.72 × 10⁻⁴ |
| P37802 | TAGL2_HUMAN | Transgelin-2 | TAGLN2 | 0.3 | 2.18 × 10⁻³ |
| P60709 | ACTB_HUMAN | Actin, cytoplasmic 1 | ACTB | 0.6 | 5.29 × 10⁻⁵ |
| Q04760 | LGUL_HUMAN | Lactoylglutathione lyase | GLO1 | 0.5 | 5.79 × 10⁻⁴ |
| Q13885 | TBB5_HUMAN | Tubulin beta-3 chain | TUBB3 | 0.3 | 2.70 × 10⁻³ |
| Q58FG1 | HS90A_HUMAN | Putative heat shock protein HSP 90-alpha A4 | HSP90AA4P | 0.3 | 2.16 × 10⁻³ |
| Q92688 | AN32B_HUMAN | Acidic leucine-rich nuclear phosphoprotein 32 family member B | ANP32B | 0.4 | 5.73 × 10⁻³ |
| Q9Y536 | PPIA_HUMAN | Peptidyl-prolyl cis-trans isomerase A-like 4A | PPIAL4A | 0.4 | 3.52 × 10⁻³ |
Interestingly, these secreted protein from p53 knock-down and WTp53 PaCa3 cells were further compared with the secreted proteins of AsPC-1 cells GOF R175H and R273H mutp53 isoforms and their respective controls that researchers previously identified using the same method [16]. They identified several secreted proteins in common between CM-PaCa3 wild-p53 and CM-AsPC-1 GOF R175H and R273H. Specifically, the secreted heat shock protein beta-1 inhibited by WTp53 was hypersecreted by R175H-mutp53 AsPC-1 [16]; Cathepsin B and Transforming growth factor-beta-induced protein ig-h3 hyposecreted by WTp53 were hypersecreted in AsPc-1 cells GOF R273H; the heat shock protein HSP90-beta hypersecreted in WTp53was hyposecreted in AsPC-1 cells GOF R273H [16].
In order to validate some differentially secreted proteins they performed Western bot analysis extending the evaluation also to other PDAC cell lines and to normal human pancreatic duct epithelial (HPDE1) as control (Figure 4). The results obtained confirm that p53 is able to determine hypersecretion of GAPDH and beta-actin proteins, as revealed in p53-null AsPC-1 cells in which p53 was overexpressed. On the other side, p53 knock-down reduced GAPDH and beta-actin secretion in Hs 766T and PaCa3 PDAC cell lines. It is noteworthy that p53 silencing in HPDE1 did not determine any significant change in protein secretion, suggesting that the deep modulation of protein secretome in PDAC cells by p53 may be a cancer-associated phenomenon.
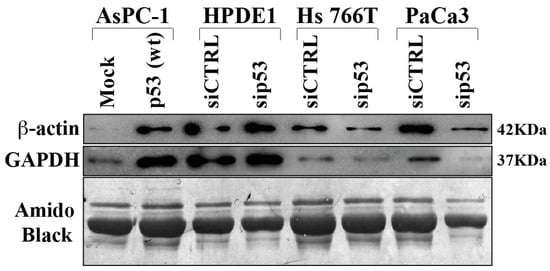
Figure 4. Immunoblot validation of p53-dependent hyposecreted proteins. p53-null AsPC-1 cells were transiently transfected with WTp53 or mock control plasmids, Hs 776T and PaCa3 WTp53-PDAC cell lines and HPDE1 human pancreas non-tumor cells were transiently transfected with siP53 to downregulate TP53; a scramble siRNA (siCTRL) was used as a control. A total of 48 h after transfection, cells were washed and further incubated for 22 h in serum-deprived media. Secreted proteins were precipitated overnight and p53-dependent GAPDH and ß-Actin protein expression was confirmed by immunoblot. Amido black staining was used as loading control.
6. Dysregulated Pathways, Protein Interaction Networks and Upstream Regulators Related to Wtp53-Driven Secreted Proteins
Researchers analyzed modulated proteins by bioinformatics tools to obtain a global overview of the interaction network by which WTp53 can control tumor development through secreted proteins in PDAC. Ingenuity Pathway Analysis (IPA) was employed to identify the main pathways and biological processes associated with the oncosuppressor role of p53. The canonical pathways linked to the silencing of p53 are mainly related to aldosterone signaling, gluconeogenesis, protein ubiquitination, ferroptosis signaling, acetyl-CoA biosynthesis, glucocorticoid receptor signaling, clathrin-mediated endocytosis, SPINK1 pancreatic cancer pathway, methylglyoxal degradation and remodeling of epithelial adherens junctions (Figure 5A). The analysis of the molecular and cellular functions revealed an involvement of proteins associated with cell death and survival, protein synthesis and cellular movement functions (Figure 5B).
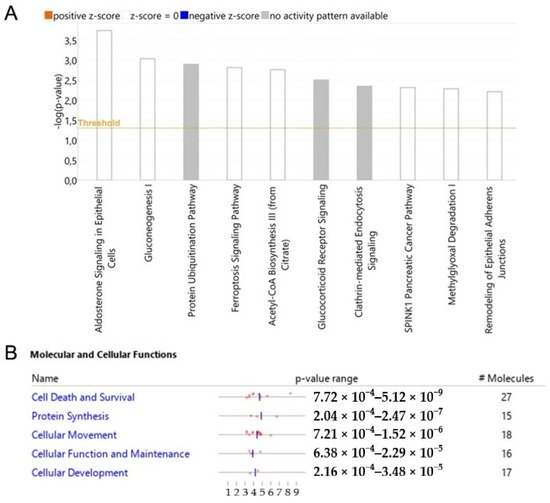
Figure 5. p53-driven canonical pathways and molecular and cellular functions. Bar-plot of canonical pathway significance (−log(p-value)) of altered secreted proteins in response to the silencing of p53 in PDAC (A). Activation/inhibition (z-score) was not predicted. Molecular and cellular functions with significance (p-value) and number of associated proteins (B).
To predict the upstream molecules (genes, transcription factors, microRNA, etc.) that may play a role in the observed secretome modulation and, thus, in response to a p53 silencing in PDAC, they performed the upstream regulator analysis through IPA software. IPA analysis suggested that TP53, IPMK, MYC and MTOR are among the most significant upstream regulators predicted as inhibited or activated (Figure 6). Interestingly, the most significant upstream regulator, with a p-value of 2.57−10, was TP53. TP53 was predicted inhibited (z-score of −1.289) and the 40.4% of the total modulated proteins resulted under its regulation. Among these, eight proteins that are inhibited by TP53 were detected as hypersecreted (ACLY, TGFB1, TFRC, TALDO1, LCN2, IGFBP4, HSPH1, CTSB) after p53 knock-down, whereas five proteins that are activated by TP53 resulted to be hyposecreted (ACTB, TAGLN2, S100A4, PFN1, FDPS) after the p53 knock-down in PaCa3 cells. Moreover, the upstream regulators MYC and MTOR were predicted as activated (z-score of 2.157 and 2.984, respectively) with a p-value of 2.75−7 and 1.17−6, respectively. Instead, the upstream regulator IPMK was predicted as inhibited (z-score of −2.00) with a p-value of 9.87−8. MYC and MTOR are well-known oncogenes usually activated in cancer, whereas IPMK can act as a co-activator of TP53 [23][24].
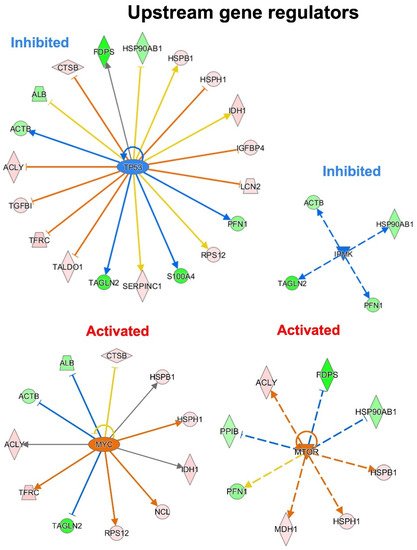
Figure 6. Upstream gene regulator analysis. In p53 knocking-down conditions, TP53 and IPMK are the most significant inhibited upstream regulators, while MYC and MTOR resulted the most significant activated regulators.
Researchers then employed STRING software in order to investigate protein–protein interactions and to explore the functional enriched pathways. They manually added p53 to the list of regulated proteins and found that it directly interacts with nine hypersecreted (Figure 7A) and eight hyposecreted proteins (Figure 7B). Concerning the hypersecreted proteins after p53 knock-down, the network analysis reported a cluster of interaction between p53 and SET, HSPB1, K2C8, NUCL, CATB, TFR1, MDHC, HSP7C, ACLY; while among the hyposecreted proteins after p53 knock-down there was a cluster of interaction involving S10A4, ALBU, PPIB, HS90B, HS90A, ACTB, G3P, TBB5. The functional enrichment analysis also showed that most of the hypersecreted proteins belong to extracellular space and exosomes, supporting their role in cell–cell communications.
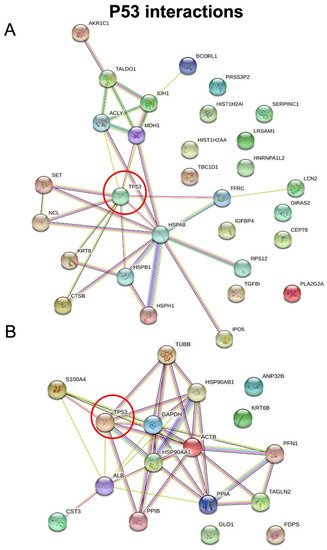
Figure 7. STRING analysis. Protein–protein interactions among modulated proteins. p53 was manually added to identify potentially related connections. The network of hypersecreted proteins is reported in (A) while the network of hyposecreted proteins is reported in (B).
Finally, the diseases and functions analysis performed through the IPA software highlighted the involvement of proteins associated with leukocytes movement (HSPB1, PPIB, ACTB, HS90B, ALB and S10A4), carcinoma (CATB, ALB, CYTC and SAA4) and advanced malignant tumor (CATB, BGH3, ACTB, CYTC and SAA4) disease classes (Table 2).
Table 2. Diseases and functions analysis. Leukocytes movement, carcinoma and advanced malignant tumor resulted the most significant diseases and functions classes associated with modulated proteins. The proteins with their function and regulation after p53 knock-down are reported in the table.
| Diseases and Functions | ||
| Leukocytes movement | ||
| Protein | Regulation | Function |
| HSPB1 | Up-regulated | Decrease movement of leucocytes |
| PPIB | Down-regulated | Increase movement of leucocytes |
| ACTB | Down-regulated | Increase movement of leucocytes |
| HS90B | Down-regulated | Increase movement of leucocytes |
| ALB | Down-regulated | Increase movement of leucocytes |
| S10A4 | Down-regulated | Increase movement of leucocytes |
| Carcinoma | ||
| Protein | Regulation | Function |
| CATB | Up-regulated | Increase carcinoma |
| ALB | Down-regulated | Decrease carcinoma |
| CYTC | Down-regulated | Decrease carcinoma |
| SAA4 | Down-regulated | Decrease carcinoma |
| Advanced malignant tumour | ||
| Protein | Regulation | Function |
| CATB | Up-regulated | Increase advanced malignant tumour |
| BGH3 | Up-regulated | Increase advanced malignant tumour |
| ACTB | Down-regulated | Decrease advanced malignant tumour |
| CYTC | Down-regulated | Decrease advanced malignant tumour |
| SAA4 | Down-regulated | Increase advanced malignant tumour |
References
- Adamska, A.; Domenichini, A.; Falasca, M. Pancreatic Ductal Adenocarcinoma: Current and Evolving Therapies. Int. J. Mol. Sci. 2017, 18, 1338.
- Smith, J.K.; Chu, Q.D.; Tseng, J.F. Pancreatic Adenocarcinoma. In Surgical Oncology; Springer: New York, NY, USA, 2015; pp. 283–313.
- Ducreux, M.; Cuhna, A.S.; Caramella, C.; Hollebecque, A.; Burtin, P.; Goéré, D.; Seufferlein, T.; Haustermans, K.; Van Laethem, J.L.; Conroy, T.; et al. Cancer of the pancreas: ESMO Clinical Practice Guidelines for diagnosis, treatment and follow-up. Ann. Oncol. 2015, 26, v56–v68.
- Kastan, M.B. Wild-Type p53: Tumors Can’t Stand It. Cell 2007, 128, 837–840.
- Kruse, J.-P.; Gu, W. Modes of p53 Regulation. Cell 2009, 137, 609–622.
- Vousden, K.H.; Prives, C. Blinded by the Light: The Growing Complexity of p53. Cell 2009, 137, 413–431.
- Strano, S.; Dell’Orso, S.; Di Agostino, S.; Fontemaggi, G.; Sacchi, A.; Blandino, G. Mutant p53: An oncogenic transcription factor. Oncogene 2007, 26, 2212–2219.
- Di Marco, M.; Astolfi, A.; Grassi, E.; Vecchiarelli, S.; Macchini, M.; Indio, V.; Casadei, R.; Ricci, C.; D’Ambra, M.; Taffurelli, G.; et al. Characterization of pancreatic ductal adenocarcinoma using whole transcriptome sequencing and copy number analysis by single-nucleotide polymorphism array. Mol. Med. Rep. 2015, 12, 7479–7484.
- Hollstein, M.; Sidransky, D.; Vogelstein, B.; Harris, C.C. p53 Mutations in Human Cancers. Science 1991, 253, 49–53.
- Freed-Pastor, W.A.; Prives, C. Mutant p53: One name, many proteins. Genes Dev. 2012, 26, 1268–1286.
- Cho, S.-Y.; Park, C.; Na, D.; Han, J.Y.; Lee, J.; Park, O.-K.; Zhang, C.; Sung, C.O.; Moon, H.E.; Kim, Y.; et al. High prevalence of TP53 mutations is associated with poor survival and an EMT signature in gliosarcoma patients. Exp. Mol. Med. 2017, 49, e317.
- Blandino, G.; Levine, A.J.; Oren, M. Mutant p53 gain of function: Differential effects of different p53 mutants on resistance of cultured cells to chemotherapy. Oncogene 1999, 18, 477–485.
- Butera, G.; Pacchiana, R.; Mullappilly, N.; Margiotta, M.; Bruno, S.; Conti, P.; Riganti, C.; Donadelli, M. Mutant p53 prevents GAPDH nuclear translocation in pancreatic cancer cells favoring glycolysis and 2-deoxyglucose sensitivity. Biochim. Biophys. Acta Mol. Cell Res. 2018, 1865, 1914–1923.
- Cordani, M.; Butera, G.; Dando, I.; Torrens-Mas, M.; Butturini, E.; Pacchiana, R.; Oppici, E.; Cavallini, C.; Gasperini, S.; Tamassia, N.; et al. Mutant p53 blocks SESN1/AMPK/PGC-1α/UCP2 axis increasing mitochondrial O2ˉ· production in cancer cells. Br. J. Cancer 2018, 119, 994–1008.
- Fiorini, C.; Cordani, M.; Padroni, C.; Blandino, G.; Di Agostino, S.; Donadelli, M. Mutant p53 stimulates chemoresistance of pancreatic adenocarcinoma cells to gemcitabine. Biochim. Biophys. Acta Mol. Cell Res. 2015, 1853, 89–100.
- Butera, G.; Brandi, J.; Cavallini, C.; Scarpa, A.; Lawlor, R.T.; Scupoli, M.T.; Marengo, E.; Cecconi, D.; Manfredi, M.; Donadelli, M. The Mutant p53-Driven Secretome Has Oncogenic Functions in Pancreatic Ductal Adenocarcinoma Cells. Biomolecules 2020, 10, 884.
- Cordani, M.; Pacchiana, R.; Butera, G.; D’Orazi, G.; Scarpa, A.; Donadelli, M. Mutant p53 proteins alter cancer cell secretome and tumour microenvironment: Involvement in cancer invasion and metastasis. Cancer Lett. 2016, 376, 303–309.
- Tasdemir, E.; Maiuri, M.C.; Galluzzi, L.; Vitale, I.; Djavaheri-Mergny, M.; D’Amelio, M.; Criollo, A.; Morselli, E.; Zhu, C.; Harper, F.; et al. Regulation of autophagy by cytoplasmic p53. Nat. Cell Biol. 2008, 10, 676–687.
- Cordani, M.; Butera, G.; Pacchiana, R.; Donadelli, M. Molecular interplay between mutant p53 proteins and autophagy in cancer cells. Biochim. Biophys. Acta Rev. Cancer 2017, 1867, 19–28.
- El-Deiry, W.S. The role of p53 in chemosensitivity and radiosensitivity. Oncogene 2003, 22, 7486–7495.
- Baker, S.J.; Markowitz, S.; Fearon, E.R.; Willson, J.K.V.; Vogelstein, B. Suppression of Human Colorectal Carcinoma Cell Growth by Wild-Type p53. Science 1990, 249, 912–915.
- Shaw, P.; Bovey, R.; Tardy, S.; Sahli, R.; Sordat, B.; Costa, J. Induction of apoptosis by wild-type p53 in a human colon tumor-derived cell line. Proc. Natl. Acad. Sci. USA 1992, 89, 4495–4499.
- Pópulo, H.; Lopes, J.M.; Soares, P. The mTOR Signalling Pathway in Human Cancer. Int. J. Mol. Sci. 2012, 13, 1886–1918.
- Dong, Y.; Tu, R.; Liu, H.; Qing, G. Regulation of cancer cell metabolism: Oncogenic MYC in the driver’s seat. Signal Transduct. Target. Ther. 2020, 5, 124.
More
Information
Subjects:
Biochemistry & Molecular Biology
Contributor
MDPI registered users' name will be linked to their SciProfiles pages. To register with us, please refer to https://encyclopedia.pub/register
:
View Times:
689
Revisions:
2 times
(View History)
Update Date:
18 Feb 2022
Table of Contents


Notice
You are not a member of the advisory board for this topic. If you want to update advisory board member profile, please contact office@encyclopedia.pub.
OK
Confirm
Only members of the Encyclopedia advisory board for this topic are allowed to note entries. Would you like to become an advisory board member of the Encyclopedia?
Yes
No
${ textCharacter }/${ maxCharacter }
Submit
Cancel
Back
Comments
${ item }
|
${ item.createdUser.fullName }
${ item.createdAt }
${ item.vote }
${ item.reply }
Delete
${ reply.createdUser.fullName }
${ reply.createdAt }
${ reply.vote }
Delete
There is no reply to this comment~
${ item.replyTextCharacter }/${ item.replyMaxCharacter }
Submit
Cancel
More
No more~
There is no comment~
${ textCharacter }/${ maxCharacter }
Submit
Cancel
${ selectedItem.replyTextCharacter }/${ selectedItem.replyMaxCharacter }
Submit
Cancel
Confirm
Are you sure to Delete?
Yes
No