 +1 credit
| Version | Summary | Created by | Modification | Content Size | Created at | Operation |
|---|---|---|---|---|---|---|
| 1 | Hamed Taherdoost | + 1222 word(s) | 1222 | 2022-02-17 02:57:46 | | | |
| 2 | Jason Zhu | -9 word(s) | 1213 | 2022-02-18 03:27:18 | | | | |
| 3 | Jason Zhu | Meta information modification | 1213 | 2023-07-17 07:27:58 | | |
Video Upload Options
In order to answer the research questions, it is doubtful that researcher should be able to collect data from all cases. Thus, there is a need to select a sample. The entire set of cases from which researcher sample is drawn in called the population. Since, researchers neither have time nor the resources to analysis the entire population so they apply sampling technique to reduce the number of cases. There are six stages to choose sampling techniques.
1. Stage 1: Clearly Define Target Population
The first stage in the sampling process is to clearly define target population. Population is commonly related to the number of people living in a particular country, or in particular, a group or number of elements that researcher plans to study among.
2. Stage2: Select Sampling Frame
A sample frame is drawn from the identified population/target population. A sampling frame is a list of the actual cases from which sample will be drawn. Thus, the sampling frame must be representative of the population. In brief, sampling frame is a list of all the items in the research population.
3. Stage 3: Choose Sampling Technique
Prior to examining the various types of sampling method, it is worth noting what is meant by sampling, along with reasons why researchers are likely to select a sample. Taking a subset from chosen sampling frame or entire population is called sampling. Sampling can be used to make inference about a population or to make generalization in relation to existing theory. In essence, this depends on choice of sampling technique.
In general, sampling techniques can be divided into two types:
- Probability or random sampling
- Non- probability or non- random sampling
Before choosing specific type of sampling technique, it is needed to decide broad sampling technique. Figure 1 shows the various types of sampling techniques.
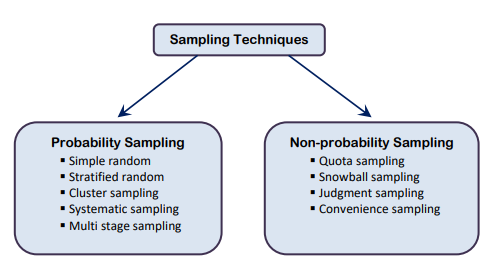
Figure 1. Sampling techniques
4. Stage 4: Determine Sample Size
In order to generalize from a random sample and avoid sampling errors or biases, a random sample needs to be of adequate size. What is adequate depends on several issues which often confuse people doing surveys for the first time. This is because what is important here is not the proportion of the research population that gets sampled, but the absolute size of the sample selected relative to the complexity of the population, the aims of the researcher and the kinds of statistical manipulation that will be used in data analysis. While the larger the sample the lesser the likelihood that findings will be biased does hold, diminishing returns can quickly set in when samples get over a specific size which need to be balanced against the researcher’s resources. To put it bluntly, larger sample sizes reduce sampling error but at a decreasing rate. Several statistical formulas are available for determining sample size.
There are numerous approaches, incorporating a number of different formulas, for calculating the sample size for categorical data.
n= p (100-p)z2/E2
n is the required sample size
P is the percentage occurrence of a state or condition
E is the percentage maximum error required
Z is the value corresponding to level of confidence required
There are two key factors to this formula[1]. First, there are considerations relating to the estimation of the levels of precision and risk that the researcher is willing to accept:
E is the margin of error(the level of precision) or the risk the researcher is willing to accept (for example, the plus or minus figure reported in newspaper poll results). In the social research a 5% margin of error is acceptable. So, for example, if in a survey on job satisfaction 40% of respondents indicated they were dissatisfied would lie between 35% and 45%. The smaller the value of E the greater the sample size required as technically speaking sample error is inversely proportional to the square root of n, however, a large sample cannot guarantee precision[4].
Z concern the level of confidence that the results revealed by the survey findings are accurate. What this means is the degree to which it can be ensured the characteristics of the population have been accurately estimated by the sample survey. Z is the statistical value corresponding to level of confidence required. The key idea behind this is that if a population were to be sampled repeatedly the average value of a variable or question obtained would be equal to the true population value. In management research the typical levels of confidence used are 95 percent (0.05: a Z value equal to 1.96) or 99 percent (0.01: Z=2.57). A 95 percent level of confidence implies that 95 out of 100 samples will have the true population value within the margin of error (E) specified.
The second key component of a sample size formula concerns the estimation of the variance or heterogeneity of the population (P). Management researchers are commonly concerned with determining sample size for issues involving the estimation of population percentages or proportions[2]. In the formula the variance of a proportion or the percentage occurrence of how a particular question, for example, will be answered is P(100-P). Where, P= the percentage of a sample having a characteristic , for example, the 40 % of the respondents who were dissatisfied with pay, and (100-P) is the percentage (60%) who lack the characteristic or belief. The key issue is how to estimate the value of P before conducting the survey? Bartlett et al.[3] suggest that researchers should use 50% as an estimate of P, as this will result in the maximization of variance and produce the maximum sample size[4].
The formula for determining sample size, of the population has virtually no effect on how well the sample is likely to describe the population and as Fowler[5] argues, it is most unusual for it (the population fraction) to be an important consideration when deciding on sample size[6].
Table 1 presents sample size that would be necessary for given combinations of precision, confidence levels, and a population percentage or variability of 50% (the figure which many researchers suggest to maximize variance).
Table 1: Sample size Based on Desired Accuracy
|
` |
Variance of the population P=50% |
|||||
|
Confidence level=95% Margin of error |
Confidence level=99% Margin of error |
|||||
|
Population Size |
5 |
3 |
1 |
5 |
3 |
1 |
|
50 |
44 |
48 |
50 |
46 |
49 |
50 |
|
75 |
63 |
70 |
74 |
67 |
72 |
75 |
|
100 |
79 |
91 |
99 |
87 |
95 |
99 |
|
150 |
108 |
132 |
148 |
122 |
139 |
149 |
|
200 |
132 |
168 |
196 |
154 |
180 |
198 |
|
250 |
151 |
203 |
244 |
181 |
220 |
246 |
|
300 |
168 |
234 |
291 |
206 |
258 |
295 |
|
400 |
196 |
291 |
384 |
249 |
328 |
391 |
|
500 |
217 |
340 |
475 |
285 |
393 |
485 |
|
600 |
234 |
384 |
565 |
314 |
452 |
579 |
|
700 |
248 |
423 |
652 |
340 |
507 |
672 |
|
800 |
260 |
457 |
738 |
362 |
557 |
763 |
|
1000 |
278 |
516 |
906 |
398 |
647 |
943 |
|
1500 |
306 |
624 |
1297 |
459 |
825 |
1375 |
|
2000 |
322 |
696 |
1655 |
497 |
957 |
1784 |
|
3000 |
341 |
787 |
2286 |
541 |
1138 |
2539 |
|
5000 |
357 |
879 |
3288 |
583 |
1342 |
3838 |
|
10000 |
370 |
964 |
4899 |
620 |
1550 |
6228 |
|
25000 |
378 |
1023 |
6939 |
643 |
1709 |
9944 |
|
50000 |
381 |
1045 |
8057 |
652 |
1770 |
12413 |
|
100000 |
383 |
1056 |
8762 |
656 |
1802 |
14172 |
|
250000 |
384 |
1063 |
9249 |
659 |
1821 |
15489 |
|
500000 |
384 |
1065 |
9423 |
660 |
1828 |
15984 |
|
1000000 |
384 |
1066 |
9513 |
660 |
1831 |
16244 |
The sample sizes reflect the number of obtained responses, and not necessarily the number of questionnaires distributed (this number is often increased to compensate for non-response). However, in most social and management surveys, the response rates for postal and e-mailed surveys are very rarely 100%. Probably the most common and time effective way to ensure minimum samples are met is to increase the sample size by up to 50% in the first distribution of the survey[7].
5. Stage 5: Collect Data
Once target population, sampling frame, sampling technique and sample size have been established, the next step is to collect data.
6. Stage 6: Assess Response Rate
Response rate is the number of cases agreeing to take part in the study. These cases are taken from original sample. In reality, most researchers never achieve a 100 percent response rate. Reasons for this might include refusal to respond, ineligibility to respond, inability to respond, or the respondent has been located but researchers are unable to make contact. In sum, response rate is important because each non response is liable to bias the final sample. Clearly defining sample, employing the right sampling technique and generating a large sample, in some respects can help to reduce the likelihood of sample bias.
References
- BREWETON, P. & MILLWARD, L. 2001. Organizational Research Methods, London, SAGE.
- ACKOFF, R. L. 1953. The Design of Social Research, Chicago, University of Chicago Press.
- BARTLETT, J. E., KOTRLIK, J. W. & HIGGINS, C. C. 2001. Organizational research: determining appropriate sample size in survey research. Learning and Performance Journal, 19, 43-50.
- BROWN, G. H. 1947. A comparison of sampling methods. Journal of Marketing, 6, 331-337.
- BRYMAN, A. & BELL, E. 2003. Business research methods, Oxford, Oxford University Press.
- DAVIS, D. 2005. Business Research for Decision Making, Australia, Thomson South-Western.
- FOWLER, F. J. 2002. Survey research methods, Newbury Park, CA, SAGE.

