Your browser does not fully support modern features. Please upgrade for a smoother experience.
Submitted Successfully!
 +1 credit
Thank you for your contribution! You can also upload a video entry or images related to this topic.
For video creation, please contact our Academic Video Service.
| Version | Summary | Created by | Modification | Content Size | Created at | Operation |
|---|---|---|---|---|---|---|
| 1 | Maria Silvia Binetti | + 2423 word(s) | 2423 | 2022-02-14 07:24:54 | | | |
| 2 | Conner Chen | Meta information modification | 2423 | 2022-02-17 02:35:08 | | |
Video Upload Options
We provide professional Academic Video Service to translate complex research into visually appealing presentations. Would you like to try it?
Cite
If you have any further questions, please contact Encyclopedia Editorial Office.
Binetti, M.S. Weather Radar. Encyclopedia. Available online: https://encyclopedia.pub/entry/19513 (accessed on 19 July 2026).
Binetti MS. Weather Radar. Encyclopedia. Available at: https://encyclopedia.pub/entry/19513. Accessed July 19, 2026.
Binetti, Maria Silvia. "Weather Radar" Encyclopedia, https://encyclopedia.pub/entry/19513 (accessed July 19, 2026).
Binetti, M.S. (2022, February 16). Weather Radar. In Encyclopedia. https://encyclopedia.pub/entry/19513
Binetti, Maria Silvia. "Weather Radar." Encyclopedia. Web. 16 February, 2022.
Copy Citation
The history of Weather Radar (abbreviation of RAdio Detecting And Ranging) begins during World War II, when military radar operators noticed extraneous echoes showing up on their display. David Atlas was one of the pioneers of radar meteorology, along with John Stewart Marshall, Walter Palmer and Richard Doviak. Weather radars send pulses of electromagnetic energy into the atmosphere, a microsecond of long microwave radiation to identify the presence of hydrometeors.
weather radar
1. Weather Radar
The history of Weather Radar (abbreviation of RAdio Detecting And Ranging) begins during World War II, when military radar operators noticed extraneous echoes showing up on their display. David Atlas was one of the pioneers of radar meteorology, along with John Stewart Marshall, Walter Palmer and Richard Doviak [1]. After the second world war, John Stewart Marshall and Walter Palmer investigated Z-R relationships in the Stormy Weather Group. Furthermore, Richard Doviak was the father of Doppler radar at the National Oceanic and Atmospheric Administration (NOAA) for storm forecasting. These are just some of the milestones in the origins of weather radar.
Weather radars send pulses of electromagnetic energy into the atmosphere, a microsecond of long microwave radiation to identify the presence of hydrometeors [2]. Hydrometeors from the Greek hýdōr-metéōros, which means literally “water that is high in the sky” represent all phenomena of condensation and precipitation of atmospheric humidity in liquid or solid particles. When the pulses strike an object such as rain, hail, or snow, Rayleigh scattering occurs and part of the energy is reflected back to the radar receiver (Figure 1) [1]. Rayleigh scattering takes place when the wavelengths are greater than the diameters of the hydrometeor particles. Different wavelengths identify particles of different sizes. Rayleigh scattering starts to become invalid when the hydrometeor diameters are large (e.g., 2–3 cm) compared to the wavelength of the X-band. The X-band has the shortest wavelength compared to the S and C bands.
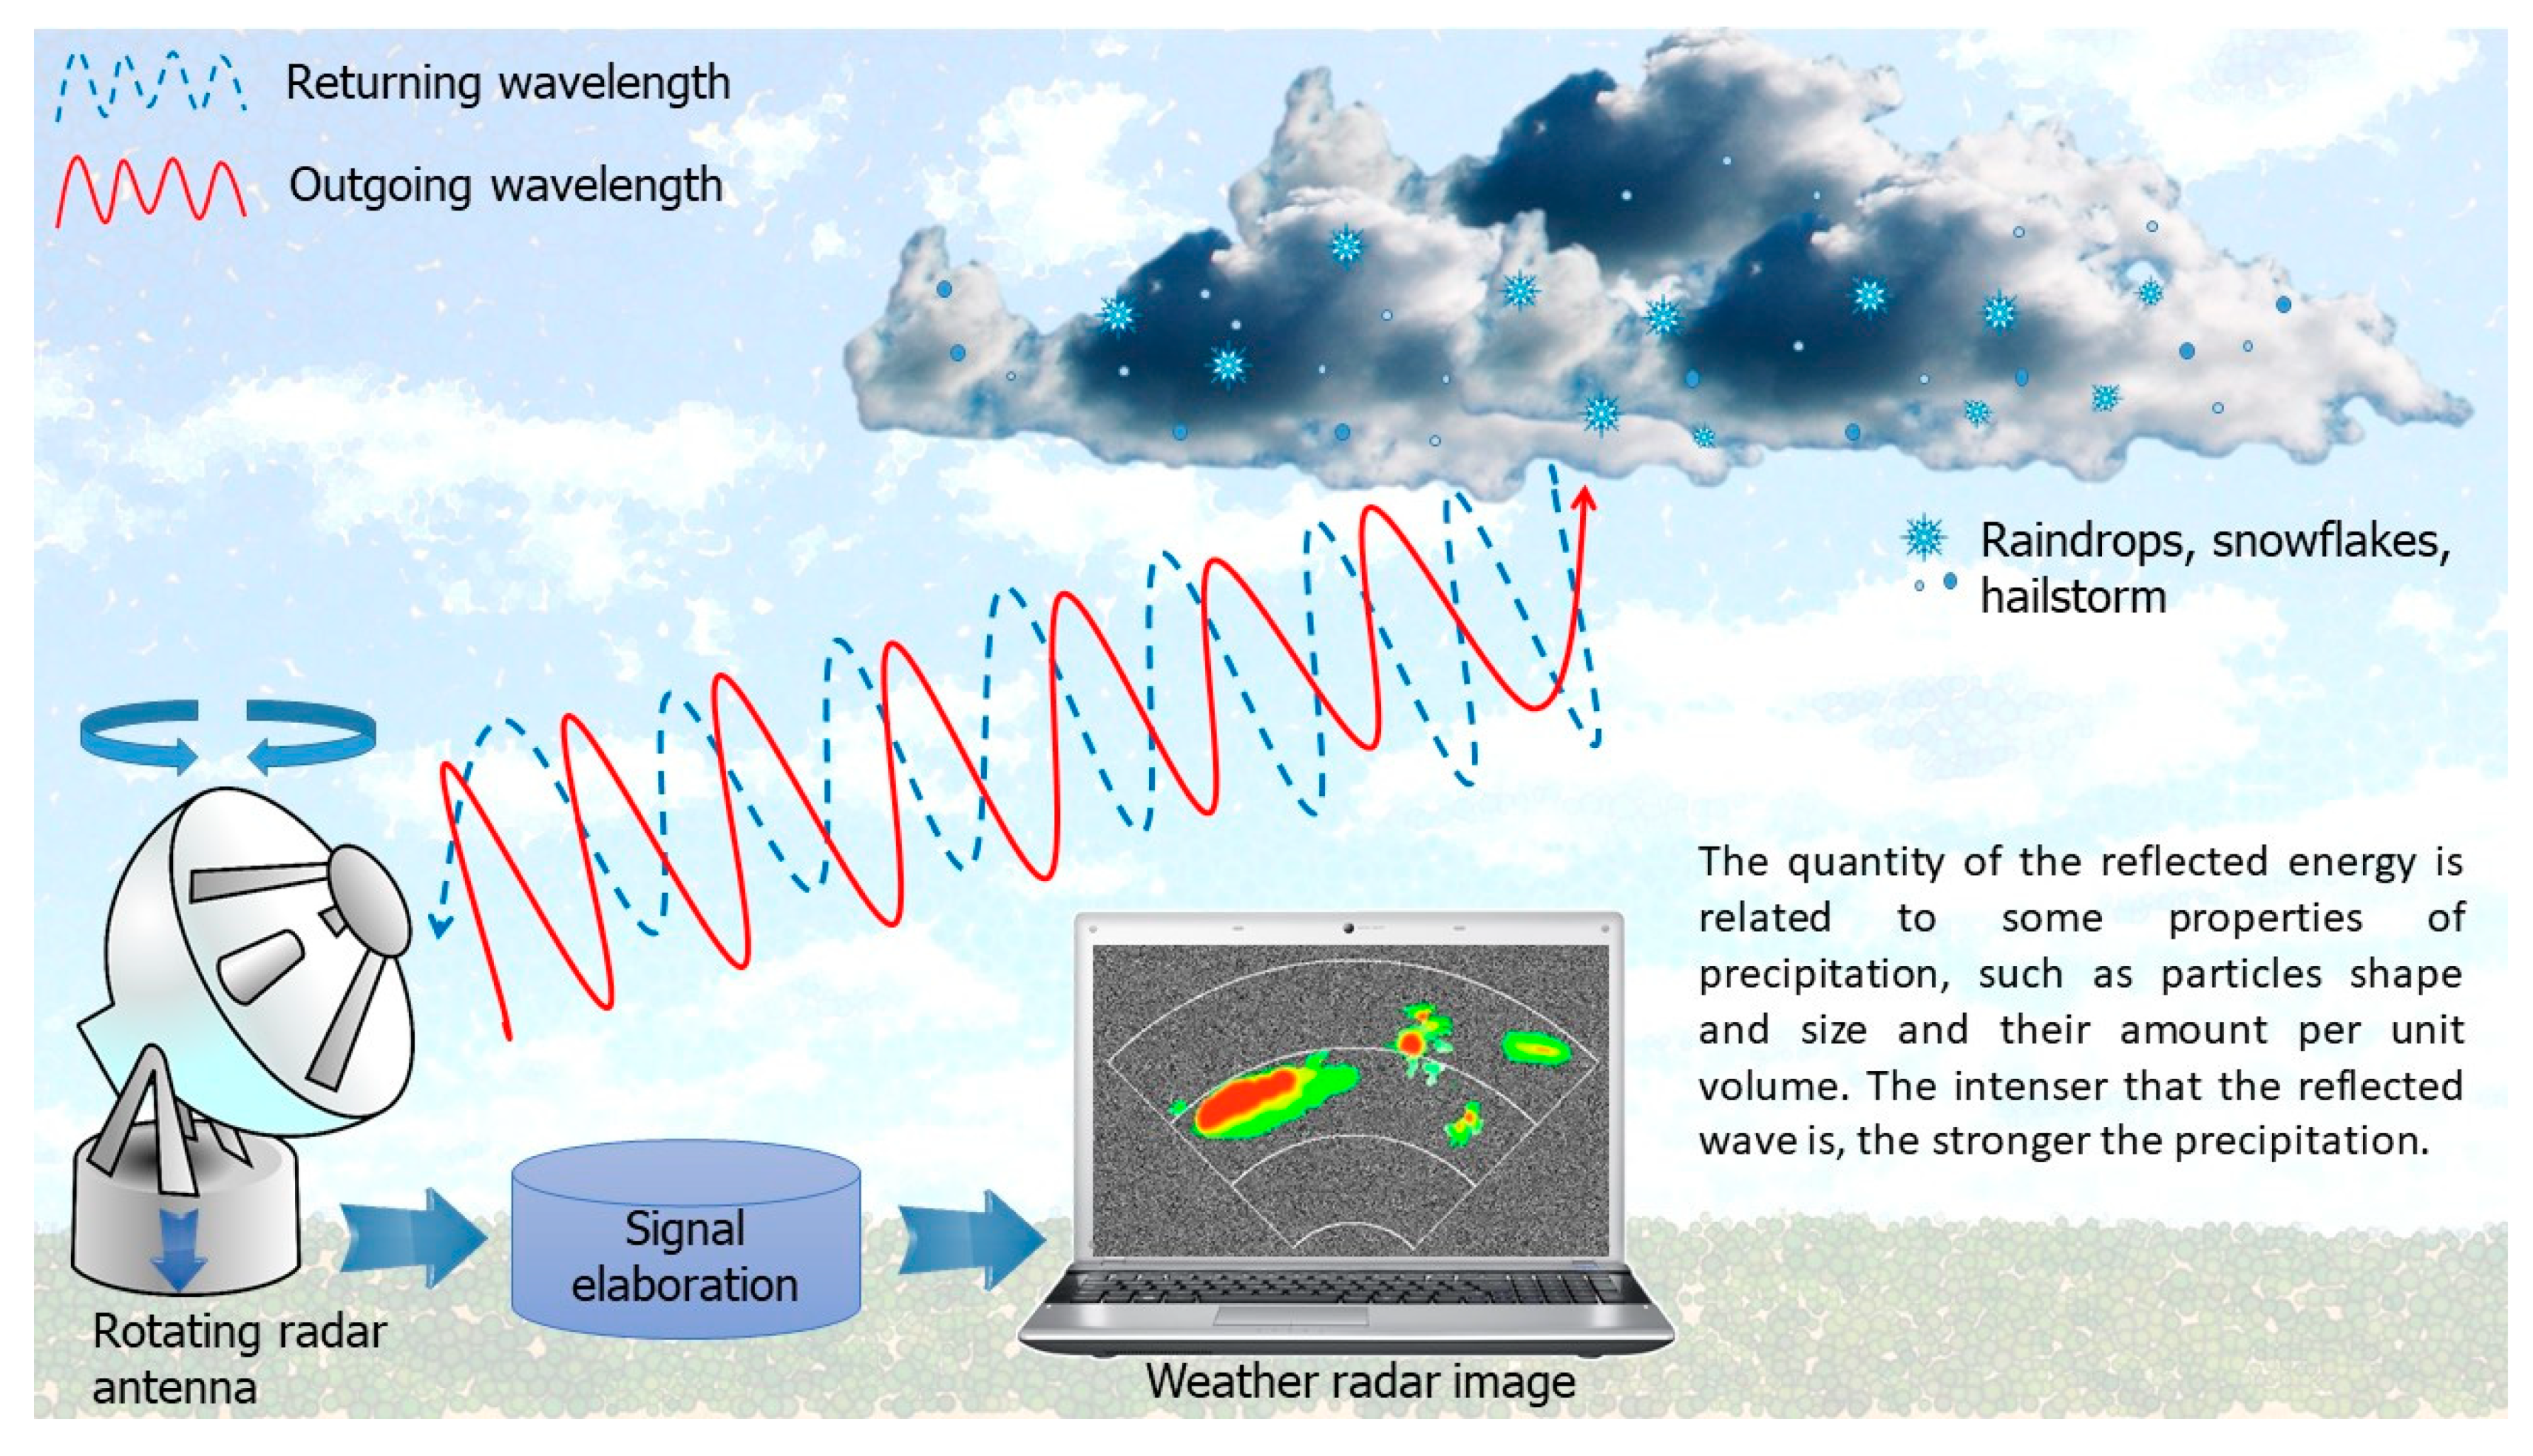
Figure 1. Weather radar principle of function. Weather radar image reworked from source [3].
Weather radar works in three different frequency bands: S, C and X. S-band radar has a longer wavelength (8–15 cm) and can provide rain detection up to 300 km. C-band radar is medium-range (4–8 cm) and measures up to 200 km, and finally, the X-band radar is the smallest wavelength (2.5–4 cm). These waves are well-suited for measuring up to a range of 50 km [4]. Further, L-band radar (15–30 cm), with a frequency of 1–2 GHz, is used for clear air turbulence studies, and K-band radar (0.75–1.2 or 1.7–2.5 cm), with a frequency of 27–40 and 12–18 GHz, is similar to the X-band, but more sensitive when compared to them. For example, in heavy rain, due to radar signal attenuation in the X-Band, the reflectivity information can be completely hidden from radar scans [5]. This does not happen for K-Bands.
Weather radars have five components: transmitter, antenna, radar processor, receiver, display system. The transmitter generates electromagnetic pulses and the antenna sends pulses into the atmosphere and receives the reflected pulses. The antenna dish can rotate 360 degrees horizontally and scan the atmosphere volume using different elevation angles. The radar processor analyses the received data, and the receiver identifies the signal and amplifies the weak signals received. Finally, the data system displays the radar data to their viewers.
The precipitation estimate can be driven from different measurement techniques, such as weather radar networks, rain gauge networks and meteorological satellites.
The weather radar equation is founded on the basic principles of radar, on the power of transmission, propagation and reception of echo signals:
where Pr is the received power, Pt is the transmitted power, G is the antenna gain, σ is the radar cross-section and λ is the transmitter’s wavelength [5]. The weather radar does not measure rainfall directly but instead uses an algorithm to estimate rainfall from radar observation [6][7]. The radar calculates rainfall intensities, R (mm h−1), from the observed radar reflectivity, Z (mm6 m−3), in single-polarized radar [8]. The rainfall intensity and reflectivity are related by a power law [9]. The coefficient of the power law relationship is required to transform reflectivity to rainfall rate [10]. Dual-polarized radar produces both horizontal and vertical electromagnetic waves to detect the shapes, size, density and distribution of water droplets in the atmosphere [11].
The radar reflectivity Z product displays echo intensity measured in decibels (dBZ). Depending on the software system or user preference, the colors display the different echo intensities, from very weak to very strong hydrometeors. For example, the green–light-blue is related to light rain precipitation when the dBZ value touches 20. The yellow (approximately 35 dBZ value) shows moderate precipitation, while red (approximately 50 dBZ value) is for heavy precipitation. The higher radar reflectivity is related to hailstones mixed in with the liquid hydrometeors (approximately 65 dBZ value).
The rain gauge network measures the accumulated rainfall as a function of time. This technique uses a point measurement with a temporal resolution of 1 min–1 h. The instruments count drop measure differently to disdrometers, which measure the statistical distribution of drop size [10].
Finally, meteorological satellites for rainfall estimation were developed to strengthen hydrological models and weather forecasting [12]. Rainfall estimates from the radar can also be combined with estimates from meteorological satellites, potentially strengthening the reliability of hydrological models and weather forecasts.
There are numerous sources of errors that affect the weather radar measurement. The errors are due to hardware error, radar beam geometry, scan strategy, the distance from the radar site, echoes from the non-meteorological target, orographic obstacles, attenuation signal and anomalous propagation of the radar beam [4][13][14]. It is important to be familiar with the errors of the radar measurement and the processing complexity.
2. Potential Use of Weather Radar Resources
Radar is used in various applications, such as military, nautical, aviation, marine, meteorology, biology and weather surveillance. Weather radars are essentially employed for measurement and forecasting atmospheric phenomena.
The drastic increase of extreme weather events has led to increased frequency and severity of flood events. Hus et al. [15] developed an automatically combined ground weather radar with images in real-time for flood monitoring. Closed-circuit television systems were combined with automatically combined ground weather radar, providing information regarding the water level in flood monitoring. This system allows one to make a quick evacuation decision to reduce the adverse effect. Rapant et al. [16] presented a method with a different technique to obtain a dynamic pluvial flash flooding hazard forecast. This approach uses weather radar data to carry information on the current precipitation distribution, watershed and drainage network. In more detail, the 2D weather radar data are transformed into 1D signals related to the section of watercourses. If the system detects danger, it sends a possible warning of flash flooding to neighbouring municipalities. The experimental result showed a substantial reduction in false alarms against imminent flash floods, including the saturation indicator.
Another application of weather radar is wildfire monitoring and filling in the knowledge gaps regarding dangerous fire conditions. Wildfires constitute considerable natural hazards, and Doppler radar can be used to identify the fire behaviour of wildfire plumes [17].
Maki et al. [18] analyse 3D weather radar data from volcanic eruption clouds to understand the ash-fall transportation. It is possible to construct a radar reflectivity microphysical model to quantify the eruption regimes [19]. Building off previous experimental observations, it is possible to achieve the classification of eruption regime and volcanic ash category and estimate ash concentration.
Voormansik et al. [20] presented a method to detect thunderstorm hail and lightning with C-band dual-polarization Doppler radar. These convective storms, associated with lightning and hail, cause financial losses and significant damage to infrastructure. The radar lightning estimation identifies which cells are rapidly growing and approaching the measures likely to produce lightning in the foreseeable future. The study is based on four years of the summer periods in Estonia; it was found that 33.9% of the identified cells produced lightning and 25.9% produced hail.
Weather radar can be used in biology to study bird migration at temporal end spatial scales. The detailed information on the areal movements of an organism can be explored to create interpreting regional-scale migration patterns and information in the landscape and aerial environment [21]. Polarimetric radar observation is used for bird detection. Furthermore, recent studies have been conducted using weather radars to explore the harmful influence of artificial light on migratory bird populations [22]. Using multi-year weather radar measurement, it has been shown that birds are attracted to artificial light while in flight, and this inhibits habitat selection. The choice of high-quality stopover habitat is crucial for the conservation of bird populations. Another study evaluated the spatial and temporal variation in nocturnal migration patterns that are affected by winds. This first continental-scale study used 70 weather radar stations in Europe for investigating the ecosystem consequences of large-scale bird movements [23]. Several studies report the impressive decline of bird population that defined the global biodiversity crisis [24].
Current weather radar literature research has investigated the offshore wind fluctuations for optimizing the administration of wind farms in real-time. Trombe et al. [25] present an automated decision-support system based on the collection of meteorological observations at high spatio-temporal resolutions to provide relevant inputs to prediction systems. Also of relevance is the interference of echoes from the wind farm to weather radar [26].
The use of weather radar also concerns human health. Using machine learning methods and Next Generation Weather Radar data, it is possible to estimate daily pollen over a 300 km × 300 km region at a resolution of 0.5 km × 0.5 km [27]. The models are developed using radar measurements of reflectivity, direction and speed of the wind, line of sight Doppler velocity and spectral width at the lowest two elevations to estimate the daily pollen dispersal. The study results provide pollen alerts and predict allergic pollen of different species.
Recent weather radar literature has investigated the Radar Simulator, which can reproduce realistic weather radar measurement [28][29][30]. The simulation starts from a known meteorological scenario to build processing algorithms.
The increasing use of weather radar generates a large amount of data transmission and storage. Zeng et al. [31] present a weather radar lossless compression approach called spatial and temporal prediction compression (STPC).
Regarding interference in weather radar, the growth of wireless telecommunication systems represents the primary concern with regards to guaranteeing radar data quality. The electromagnetic interference negatively affects the quantitative precipitation estimation and can lead to a biased hydrometeor classification [32]. Oh et al. [33] proposed a clutter elimination algorithm for the non-precipitation echo of radar data, such as anomalous propagation and interference, biological target and sea clutter.
Concerning airborne weather radar, the literature is extensive. Airborne weather radar detect potential weather hazards during flight. Li et al. [30] introduce a microphysics-based simulator applied in different weather scenarios to address the theoretical basis and uncertainties of hydrometeor scattering. Nepal et al. [34] present a radar implementation on a low-cost weather radar platform for multi-mission applications. Nekrasov et al. [35] developed a conceptual approach for measuring near-surface wind vectors with airborne weather radar to predict the future sea surface conditions and weather patterns.
3. Hydrologic Applications of Weather Radar
Surface precipitation measurements are extremely important in hydrology, climatology and meteorology studies. These data can be improved by using weather radar and conventional rain and snow gauges.
Recent advances in digital radar data management make it possible to provide high-resolution quantitative precipitation information (QPI) for a wide range of hydrological applications [36]. With the progress of Geographical Information System (GIS) technology, radar-based quantitative precipitation estimates (QPE) have enabled routine high-resolution hydrologic modeling worldwide [37]. Recent progress and changes in weather radar hydrologic applications make its use a crucial tool for water resource management. The main topics of growth concerning weather radar applied to hydrology related to: (i) radar QPE [38][39][40][41][42], (ii) multi-radar and multi-sensor precipitation analysis [43][44][45], (iii) hydrologic modelling [46][47][48], (iv) urban hydrologic and hydraulic applications [44][49][50][51][52], (v) precipitation frequency analysis [53][54], (vi) hydrometeorological process studies [55][56], (vii) precipitation nowcasting, forecasting [57], (viii) hydrometeorological applications [58].
Floods Forecasting
Catastrophic impacts caused by floods worldwide will tend to grow due to more frequent climate changes in the next few years [59]. A flood is an excess of water that inundates usually dry land, with tragic effects. The factors responsible for flooding include the greenhouse effect, seismic and neotectonics activities, excessive development, soil erosion, damming of rivers, deforestation, riverbed aggradation, subsidence and compaction of sediments, inadequate sediment accumulation and local relative sea-level rise [60]. The negative impact of flooding includes economic damage to structures, roadways and bridges, and especially life loss [61][62][63].
An essential component of flood management is implementing and improving flood forecasting and warning systems.
Over the past years, institutions have adopted different data collection systems for supporting flood management, including rainfall gauges, hydrological stations, humidity sensors, and weather data. Unlike in situ sensors capable of monitoring only a limited region, weather radar is remote sensing-based equipment that measures the volume of rainfall over an entire area instead of measuring a single point.
Recently, several countries have investigated using weather radar precipitation to improve situation awareness in a disaster and early warnings (e.g., floods). In a case study carried out in São Paulo, Brazil, in the period 2017–2018, crowdsensing and weather radar data together helped generate high-quality information at more satisfactory spatial and temporal resolutions to improve the decision-making related to weather-related disaster events. Rainfall data provided by two weather radars located in the city were used to validate flooded areas identified by volunteered information. Moreover, a clustering approach identified those flooded areas, which may support more informative decisions in flood management.
Based on the soil saturation, the physical-geographical characteristics of an area and QPEs and forecasts (QPFs) is possible to calculate a Flash Flood Indicator (FFI). This system is used at the Czech Hydrometeorological Institute to evaluate the risk of flash floods resulting from torrential rainfall events over the whole Czech Republic. To improve the accuracy of flash flood forecasting, accurate calculations of QPEs and QPFs are required [64].
Radar data were also used in 2021 to test a new method in the Czech Republic to forecast the flash flooding hazard usually occurring in very small, typically ungauged, watersheds using raw weather radar data and watercourse network. The developed method can provide a map of the flash flooding hazard distribution on the watercourse sections. This result allows an evaluation of the identified hazard and a risk estimation for inhabitants of the area, with a system of alerts for municipalities [16].
In Taiwan, taking advantage of a dense network of surveillance cameras installed in the city, an automatic ground weather radar (ARMT) and a closed-circuit television system were combined to develop images for real-time flood monitoring. The system integrates real-time ground radar echo images and automatically estimates a rainfall hotspot according to the cloud intensity, providing real-time warning information. The ARMT showed reliability between 83 and 92% using historical data input, while with real-time data, reliability slightly decreased from 79 to 93% [15].
References
- Bringi, V.; Zrnic, D. Polarization Weather Radar Development from 1970–1995: Personal Reflections. Atmosphere 2019, 10, 714.
- Battan, L.J. Radar Observation of the Atmosphere; University of Chicago Press: Chigago, IL, USA, 1981.
- File: Weather-Radar-Blind-Zone.png—Wikimedia Commons. Available online: https://commons.wikimedia.org/wiki/File:Weather-radar-blind-zone.png (accessed on 8 January 2022).
- Sokol, Z.; Szturc, J.; Orellana-Alvear, J.; Popová, J.; Jurczyk, A.; Célleri, R. The Role of Weather Radar in Rainfall Estimation and Its Application in Meteorological and Hydrological Modelling—A Review. Remote Sens. 2021, 13, 351.
- Rahimi, A.R.; Holt, A.R.; Upton, G.J.G.; Krämer, S.; Redder, A.; Verworn, H.R. Attenuation Calibration of an X-Band Weather Radar Using a Microwave Link. J. Atmos. Ocean. Technol. 2006, 23, 395–405.
- Bringi, V.N.; Chandrasekar, V. Polarimetric Doppler Weather Radar: Principles and Applications; Cambridge University Press: Cambridge, UK, 2001; p. 636.
- Anagnostou, E.N.; Krajewski, W.F.; Smith, J. Uncertainty quantification of mean-areal radar-rainfall estimates-Web of Science Core Collection. J. Atmos. Ocean. Technol. 1999, 16, 206–215. Available online: https://biblioproxy.cnr.it:3009/wos/woscc/full-record/WOS:000078683100003 (accessed on 24 November 2021).
- Mahmood, D.A. Estimation of Dual Polarization Weather Radar Variables. Al-Mustansiriyah J. Sci. 2018, 28, 1.
- Morin, E.; Krajewski, W.F.; Goodrich, D.C.; Gao, X.; Sorooshian, S. Estimating Rainfall Intensities from Weather Radar Data: The Scale-Dependency Problem-Web of Science Core Collection. 2003. Available online: https://biblioproxy.cnr.it:3009/wos/woscc/full-record/WOS:000185945200002 (accessed on 23 November 2021).
- Michaelides, S.; Levizzani, V.; Anagnostou, E.; Bauer, P.; Kasparis, T.; Lane, J.E. Precipitation: Measurement, remote sensing, climatology and modeling. Atmos. Res. 2009, 94, 512–533.
- Ku, J.M.; Na, W.; Yoo, C. Parameter estimation of a dual-pol radar rain rate estimator with truncated paired data. Water Supply 2020, 20, 2616–2629.
- Levizzani, V.; Schmetz, J.; Lutz, H.J.; Kerkmann, J.; Alberoni, P.P.; Cervino, M. Precipitation estimations from geostationary orbit and prospects for METEOSAT Second Generation. Meteorol. Appl. 2001, 8, 23–41.
- Villarini, G.; Krajewski, W.F. Review of the different sources of uncertainty in single polarization radar-based estimates of rainfall. Surv. Geophys. 2010, 31, 107–129.
- Ośródka, K.; Szturc, J.; Jurczyk, A. Chain of data quality algorithms for 3-D single-polarization radar reflectivity (RADVOL-QC system). Meteorol. Appl. 2014, 21, 256–270.
- Hsu, S.Y.; Chen, T.B.; Du, W.C.; Wu, J.H.; Chen, S.C. Integrate Weather Radar and Monitoring Devices for Urban Flooding Surveillance. Sensors 2019, 19, 825.
- Rapant, P.; Kolejka, J. Dynamic Pluvial Flash Flooding Hazard Forecast Using Weather Radar Data. Remote Sens. 2021, 13, 2943.
- McCarthy, N.; Guyot, A.; Dowdy, A.; McGowan, H. Wildfire and Weather Radar: A Review. J. Geophys. Res. Atmos. 2019, 124, 266–286.
- Maki, M.; Kim, Y.; Kobori, T.; Hirano, K.; Lee, D.I.; Iguchi, M. Analyses of three-dimensional weather radar data from volcanic eruption clouds. J. Volcanol. Geotherm. Res. 2021, 412, 107178.
- Marzano, F.S.; Barbieri, S.; Vulpiani, G.; Rose, W.I. Volcanic ash cloud retrieval by ground-based microwave weather radar. IEEE Trans. Geosci. Remote Sens. 2006, 44, 3235–3245.
- Voormansik, T.; Rossi, P.J.; Moisseev, D.; Tanilsoo, T.; Post, P. Thunderstorm hail and lightning detection parameters based on dual-polarization Doppler weather radar data. Meteorol. Appl. 2017, 24, 521–530.
- Kranstauber, B.; Bouten, W.; Leijnse, H.; Wijers, B.-C.; Verlinden, L.; Shamoun-Baranes, J.; Dokter, A.M. High-Resolution Spatial Distribution of Bird Movements Estimated from a Weather Radar Network. Remote Sens. 2020, 12, 635.
- McLaren, J.D.; Buler, J.J.; Schreckengost, T.; Smolinsky, J.A.; Boone, M.; Emiel van Loon, E.; Dawson, D.K.; Walters, E.L. Artificial light at night confounds broad-scale habitat use by migrating birds. Ecol. Lett. 2018, 21, 356–364.
- Nilsson, C.; Dokter, A.M.; Verlinden, L.; Shamoun-Baranes, J.; Schmid, B.; Desmet, P.; Bauer, S.; Chapman, J.; Alves, J.A.; Stepanian, P.M.; et al. Revealing patterns of nocturnal migration using the European weather radar network. Ecography 2019, 42, 876–886.
- Rosenberg, K.V.; Dokter, A.M.; Blancher, P.J.; Sauer, J.R.; Smith, A.C.; Smith, P.A.; Stanton, J.C.; Panjabi, A.; Helft, L.; Parr, M.; et al. Decline of the North American avifauna. Science 2019, 366, 120–124.
- Trombe, P.-J.; Pinson, P.; Vincent, C.; Bøvith, T.; Cutululis, N.A.; Draxl, C.; Giebel, G.; Hahmann, A.N.; Jensen, N.E.; Jensen, B.P.; et al. Weather radars—The new eyes for offshore wind farms? Wind. Energy 2014, 17, 1767–1787.
- Qian, Z.; Yang, C.; Xu, H.; Cui, Y.; Han, Y.; Zhao, C.; Lv, Q. Analysis and Study on the Interference of Wind Farms to the New Generation Weather Radar Echoes. In Proceedings of the 5th International Conference on Information Science and Control Engineering (ICISCE), Zhengzhou, China, 20–22 July 2018; pp. 1086–1092.
- Zewdie, G.K.; Lary, D.J.; Liu, X.; Wu, D.; Levetin, E. Estimating the daily pollen concentration in the atmosphere using machine learning and NEXRAD weather radar data. Environ. Monit. Assess. 2019, 191, 418.
- Lischi, S.; Lupidi, A.; Martorella, M.; Cuccoli, F.; Facheris, L.; Baldini, L. Advanced polarimetric doppler weather radar simulator. In Proceedings of the International Radar Symposium, Gdansk, Poland, 16–18 June 2014.
- Li, Z.; Perera, S.; Zhang, Y.; Zhang, G.; Doviak, R. Phased-Array Radar System Simulator (PASIM): Development and Simulation Result Assessment. Remote Sens. 2019, 11, 422.
- Li, Z.; Zhang, Y.; Zhang, G.; Brewster, K.A. A microphysics-based simulator for advanced airborne weather radar development. IEEE Trans. Geosci. Remote Sens. 2011, 49, 1356–1373.
- Zeng, Q.; He, J.; Shi, Z.; Li, X. Weather radar data compression based on spatial and temporal prediction. Atmosphere 2018, 9, 96.
- Vaccarono, M.; Chandrasekar, C.V.; Bechini, R.; Cremonini, R. Survey on Electromagnetic Interference in Weather Radars in Northwestern Italy. Environments 2019, 6, 126.
- Oh, Y.A.; Kim, H.L.; Suk, M.K. Clutter Elimination Algorithm for Non-Precipitation Echo of Radar Data Considering Meteorological and Observational Properties in Polarimetric Measurements. Remote Sens. 2020, 12, 3790.
- Nepal, R.; Zhang, Y.; Blake, W. Sense and Avoid Airborne Radar Implementations on a Low-Cost Weather Radar Platform. Aerospace 2017, 4, 11.
- Nekrasov, A.; Khachaturian, A.; Veremyev, V.; Bogachev, M. Sea Surface Wind Measurement by Airborne Weather Radar Scanning in a Wide-Size Sector. Atmosphere 2016, 7, 72.
- Barge, B.L.; Humphries, R.G.; Mah, S.J.; Kuhnke, W.K. Rainfall measurements by weather radar: Applications to hydrology. Water Resour. Res. 1979, 15, 1380–1386.
- Seo, D.J.; Habib, E.; Andrieu, H.; Morin, E. Hydrologic applications of weather radar. J. Hydrol. 2015, 531, 231–233.
- Wijayarathne, D.; Boodoo, S.; Coulibaly, P.; Sills, D. Evaluation of Radar Quantitative Precipitation Estimates (QPEs) as an Input of Hydrological Models for Hydrometeorological Applications. J. Hydrometeorol. 2020, 21, 1847–1864.
- Chen, H.; Chandrasekar, V. The quantitative precipitation estimation system for Dallas-Fort Worth (DFW) urban remote sensing network. J. Hydrol. 2015, 531, 259–271.
- Seo, B.C.; Krajewski, W.F. Correcting temporal sampling error in radar-rainfall: Effect of advection parameters and rain storm characteristics on the correction accuracy. J. Hydrol. 2015, 531, 272–283.
- Sandford, C.; Illingworth, A.; Thompson, R. The Potential Use of the Linear Depolarization Ratio to Distinguish between Convective and Stratiform Rainfall to Improve Radar Rain-Rate Estimates. J. Appl. Meteorol. Climatol. 2017, 56, 2927–2940.
- Kwon, S.; Jung, S.H.; Lee, G.W. Inter-comparison of radar rainfall rate using Constant Altitude Plan Position Indicator and hybrid surface rainfall maps. J. Hydrol. 2015, 531, 234–247.
- Scopus—Document Details—Comparison of Radar Algorithms for Quantitative Precipitation Estimations in the Canadian Precipitation Analysis (CaPA) from Operational Polarimetric Radars for Hydrological Applications|Signed in. Available online: https://www.scopus.com/record/display.uri?eid=2-s2.0-84964429128&origin=inward (accessed on 29 November 2021).
- Rafieeinasab, A.; Norouzi, A.; Kim, S.; Habibi, H.; Nazari, B.; Seo, D.-J.; Lee, H.; Cosgrove, B.; Cui, Z. Toward high-resolution flash flood prediction in large urban areas—Analysis of sensitivity to spatiotemporal resolution of rainfall input and hydrologic modeling. J. Hydrol. 2015, 531, 370–388.
- Kim, B.; Seo, D.J.; Noh, S.J.; Prat, O.P.; Nelson, B.R. Improving multisensor estimation of heavy-to-extreme precipitation via conditional bias-penalized optimal estimation. J. Hydrol. 2018, 556, 1096–1109.
- Influence of Rainfall Spatial Variability on Hydrological Modelling: Study by Simulations-Web of Science Core Collection. Available online: https://biblioproxy.cnr.it:3009/wos/woscc/full-record/WOS:000313597100083 (accessed on 29 November 2021).
- Quantifying Catchment-Scale Storm Motion and its Effects on Flood Response-Web of Science Core Collection. Available online: https://biblioproxy.cnr.it:3009/wos/woscc/full-record/WOS:000313597100084 (accessed on 29 November 2021).
- Dyer, J.L.; Garza, R.C. A comparison of precipitation estimation techniques over Lake Okeechobee, Florida. Weather Forecast. 2004, 19, 1029–1043.
- Wang, L.P.; Ochoa-Rodríguez, S.; Simões, N.E.; Onof, C.; Maksimović, Č. Radar-raingauge data combination techniques: A revision and analysis of their suitability for urban hydrology. Water Sci. Technol. 2013, 68, 737–747.
- Radar-Based Pluvial Flood Forecasting over Urban Areas: Redbridge Case Study-Web of Science Core Collection. Available online: https://biblioproxy.cnr.it:3009/wos/woscc/full-record/WOS:000313597100102 (accessed on 29 November 2021).
- Ochoa-Rodriguez, S.; Wang, L.P.; Willems, P.; Onof, C. A Review of Radar-Rain Gauge Data Merging Methods and Their Potential for Urban Hydrological Applications. Water Resour. Res. 2019, 55, 6356–6391.
- Ochoa-Rodriguez, S.; Wang, L.-P.; Gires, A.; Pina, R.D.; Reinoso-Rondinel, R.; Bruni, G.; Ichiba, A.; Gaitan, S.; Cristiano, E.; van Assel, J.; et al. Impact of spatial and temporal resolution of rainfall inputs on urban hydrodynamic modelling outputs: A multi-catchment investigation. J. Hydrol. 2015, 531, 389–407.
- Marra, F.; Morin, E. Use of radar QPE for the derivation of Intensity-Duration-Frequency curves in a range of climatic regimes. J. Hydrol. 2015, 531, 427–440.
- Eldardiry, H.; Habib, E.; Zhang, Y.; Graschel, J. Artifacts in Stage IV NWS Real-Time Multisensor Precipitation Estimates and Impacts on Identification of Maximum Series. J. Hydrol. Eng. 2017, 22, E4015003.
- Campos, E.; Wang, J. Numerical simulation and analysis of the April 2013 Chicago Floods. J. Hydrol. 2015, 531, 454–474.
- Wilson, A.M.; Barros, A.P. Landform controls on low level moisture convergence and the diurnal cycle of warm season orographic rainfall in the Southern Appalachians. J. Hydrol. 2015, 531, 475–493.
- Yu, F.; Zhuge, X.Y.; Zhang, C.W. Rainfall retrieval and nowcasting based on multispectral satellite images. Part II: Retrieval study on daytime half-hour rain rate. J. Hydrometeorol. 2011, 12, 1271–1285.
- Conti, F.l.; Francipane, A.; Pumo, D.; Noto, L.V. Exploring single polarization X-band weather radar potentials for local meteorological and hydrological applications. J. Hydrol. 2015, 531, 508–522.
- Kundzewicz, Z.; Kanae, S.; Seneviratne, S.; Handmer, J.; Nicholls, N.; Peduzzi, P.; Mechler, R.; Bouwer, L.M.; Arnell, N.; Mach, K.; et al. Flood risk and climate change: Global and regional perspectives. Hydrol. Sci. J. 2014, 59, 1–28.
- Khalequzzaman, M. Recent floods in Bangladesh: Possible causes and solutions. Nat. Hazards 1994, 9, 65–80.
- Amadio, M.; Scorzini, A.R.; Carisi, F.; Essenfelder, A.H.; Domeneghetti, A.; Mysiak, J.; Castellarin, A. Testing empirical and synthetic flood damage models: The case of Italy. Nat. Hazards Earth Syst. Sci. 2019, 19, 661–678.
- Alfieri, L.; Feyen, L.; Salamon, P.; Thielen, J.; Bianchi, A.; Dottori, F.; Burek, P. Modelling the socio-economic impact of river floods in Europe. Nat. Hazards Earth Syst. Sci. 2016, 16, 1401–1411.
- Pistrika, A.K.; Jonkman, S.N. Damage to residential buildings due to flooding of New Orleans after hurricane Katrina. Nat. Hazards 2010, 54, 413–434.
- Horita, F.A.; Martins, R.G.; Palma, G.; Vilela, R.B.; Bressiani, D.A.; de Albuquerque, J.P. Determining flooded areas using crowd sensing data and weather radar precipitation: A case study in Brazil. In Proceedings of the 15th International Conference on Information Systems for Crisis Response and Management, Rochester, NY, USA, 20–23 May 2018; Boersma, K., Tomaszewski, B., Eds.; Available online: http://wrap.warwick.ac.uk/102615 (accessed on 25 November 2021).
More
Information
Subjects:
Engineering, Environmental
Contributor
MDPI registered users' name will be linked to their SciProfiles pages. To register with us, please refer to https://encyclopedia.pub/register
:
View Times:
4.3K
Revisions:
2 times
(View History)
Update Date:
17 Feb 2022
Table of Contents


Notice
You are not a member of the advisory board for this topic. If you want to update advisory board member profile, please contact office@encyclopedia.pub.
OK
Confirm
Only members of the Encyclopedia advisory board for this topic are allowed to note entries. Would you like to become an advisory board member of the Encyclopedia?
Yes
No
${ textCharacter }/${ maxCharacter }
Submit
Cancel
Back
Comments
${ item }
|
${ item.createdUser.fullName }
${ item.createdAt }
${ item.vote }
${ item.reply }
Delete
${ reply.createdUser.fullName }
${ reply.createdAt }
${ reply.vote }
Delete
There is no reply to this comment~
${ item.replyTextCharacter }/${ item.replyMaxCharacter }
Submit
Cancel
More
No more~
There is no comment~
${ textCharacter }/${ maxCharacter }
Submit
Cancel
${ selectedItem.replyTextCharacter }/${ selectedItem.replyMaxCharacter }
Submit
Cancel
Confirm
Are you sure to Delete?
Yes
No