Your browser does not fully support modern features. Please upgrade for a smoother experience.
Submitted Successfully!
 +1 credit
Thank you for your contribution! You can also upload a video entry or images related to this topic.
For video creation, please contact our Academic Video Service.
| Version | Summary | Created by | Modification | Content Size | Created at | Operation |
|---|---|---|---|---|---|---|
| 1 | Diana Pinho | + 2233 word(s) | 2233 | 2022-02-10 07:05:40 | | | |
| 2 | Camila Xu | Meta information modification | 2233 | 2022-02-14 01:57:43 | | |
Video Upload Options
We provide professional Academic Video Service to translate complex research into visually appealing presentations. Would you like to try it?
Cite
If you have any further questions, please contact Encyclopedia Editorial Office.
Pinho, D.; Minas, G.; Carvalho, V.; Catarino, S. Fourier Transform Infrared (FTIR) Spectroscopy. Encyclopedia. Available online: https://encyclopedia.pub/entry/19380 (accessed on 25 July 2026).
Pinho D, Minas G, Carvalho V, Catarino S. Fourier Transform Infrared (FTIR) Spectroscopy. Encyclopedia. Available at: https://encyclopedia.pub/entry/19380. Accessed July 25, 2026.
Pinho, Diana, Graca Minas, Vítor Carvalho, Susana Catarino. "Fourier Transform Infrared (FTIR) Spectroscopy" Encyclopedia, https://encyclopedia.pub/entry/19380 (accessed July 25, 2026).
Pinho, D., Minas, G., Carvalho, V., & Catarino, S. (2022, February 11). Fourier Transform Infrared (FTIR) Spectroscopy. In Encyclopedia. https://encyclopedia.pub/entry/19380
Pinho, Diana, et al. "Fourier Transform Infrared (FTIR) Spectroscopy." Encyclopedia. Web. 11 February, 2022.
Copy Citation
Fourier transform infrared (FTIR) spectroscopy studies the interactions between matter and electromagnetic radiation that appear in the form of a spectrum, and has undergone significant development over the past decade, promising easier, rapid, and more objective diagnostics.
blood cells
fourier transform infrared (FTIR) spectroscopy
functional group
1. Introduction
Millions of blood test analyses are performed every day worldwide in order to provide blood diagnostic services for the patients [1]. Usually, these tests are performed in clinical laboratories, simultaneously using different devices and relying on different specialties [2]. These devices are needed to run routine blood tests [2] and examine multiple parameters to assist the physicians in haematology-, chemistry-, and immunology-related diagnosis, among others. They require human resources, dedicated facilities, and time, which, in an ideal device, should be less than one hour from taking a sample to printing out the results [3][4]. Moreover, the reagents needed to run all these tests are expensive, and most of them are toxic, having a significant direct and indirect effect on the environment [5].
Diagnostic devices currently available on the market rely on the same measuring techniques developed in the last century (mainly spectrophotometry or electrochemical assays) [6]. Meanwhile, viruses, bacteria, and fungi are rapidly evolving [7], pushing further the need to develop new, quick, and reliable diagnostic tools. The primary, commercially available measuring techniques for such devices are spectrophotometry, enzyme-linked immunosorbent assay (ELISA), electrophoresis, and blood cell counting or complete blood count (CBC). However, all of these methods have limitations. In ultraviolet–visible (UV–VIS) spectrophotometry, the main limitation is the requirement for sample and setup preparation time to avoid light interferences [8]. ELISA limitations are related to the cost of the assays due to the use of antibodies, the risk of cross-reactivity, the high background noise, and extended analysis time [9]. Electrophoresis requires a large sample for the assays, as well as high analysis precision [10]. Finally, CBC limitations are related to the manual examination of blood smears, difficulty recognising abnormal red cell shapes (such as fragmented cells), and high running costs [11]. Hence, the pressing need for new, fast, and precise analysing techniques.
Fourier transform infrared (FTIR) spectroscopy is a field that has undergone significant development over the past decade, promising easier, more rapid, and more objective diagnoses [12][13]. FTIR spectroscopy studies the interactions between matter and electromagnetic radiation that appear in the form of a spectrum. Each molecule has a spectrum fingerprint that makes it unique and allows it to be distinguished from other molecules [14]. FTIR spectroscopy is also an effective and nondestructive method for monitoring cellular alterations [15][16]. FTIR spectral analysis has allowed the characterisation of several organs’ diseases, as well as the quantification of different biomolecules such as proteins [16], nucleic acids [17][18], and lipids [19]. Several research documents highlighting the importance of spectroscopic techniques in cancer detection have been published in the literature [15][20][21]. FTIR focuses on the differentiation and characterisation of cells and tissues by looking at individual bands or groups to precisely identify the molecular conformations, bonding types, functional groups, and intermolecular interactions that compose the specimen [13][20].
2. Theoretical Considerations
Here the terminologies and concepts associated with FTIR spectroscopy, namely the IR region, IR radiation and molecular vibrations in biological matters, FTIR techniques, and Michelson interferometer, are presented.
2.1. Infrared Region
IR radiation is a group of electromagnetic waves (EMR) with wavelengths longer than visible radiation, invisible to the human eye. The IR region of the electromagnetic spectrum ranges in wavelengths from 0.8–100 µm, illustrated in Table 1 [22][23]. Typically, the IR is broken into three ranges, near-IR, mid-IR, and far-IR. Most of the IR used in medical applications are in the mid-IR range, considering radiation from the electromagnetic spectrum, in the wavenumber interval from 4000 cm−1 to 400 cm−1. The frequency of the absorbed radiation is responsible for each subatomic vibrational interaction, as schematised in Figure 1.
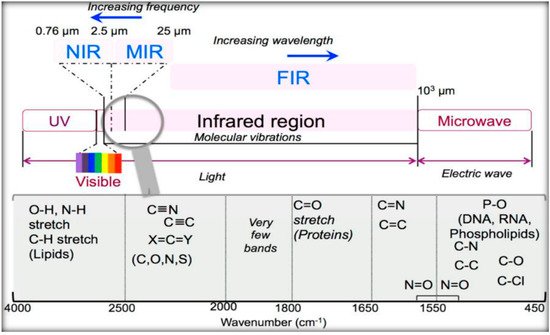
Figure 1. Scheme of the optical spectrum, focusing on the infrared region. Reprinted from [23], MDPI, under a Creative Commons Attribution (CC BY) license.
2.2. IR Radiation and Molecular Vibrations in Biological Matter
As a type of electromagnetic wave, IR propagates energy and momentum, with properties similar to both a wave and a particle—the photon. IR is emitted or absorbed by molecules as they change their rotational, vibrational motions. It excites wave modes in a molecule by changing them instantaneously, making it a helpful frequency variation for studying the molecular energy states with correct symmetry. Therefore, IR chemical analysis studies the absorption and transmission of photons in the IR region [24]. The IR spectrum of biological samples consists of a combination of the characteristic absorption bands of proteins, lipids, nucleic acids, and carbohydrates within that sample [25][26].
The protein absorption bands are often assigned to amino acid side groups or peptide backbone in the 1700 cm−1–1500 cm−1 range. The vibrational modes of the peptide backbone produce the amide I and II bands. The amide I band (1700 cm−1–1600 cm−1) is mainly associated with the bending vibration of the N–H bond. The bands of amides I and II are usually used to analyse the secondary protein structure [27]. The presence of absorption bands at 1450 cm−1 and 1400 cm−1 is due to asymmetric and symmetric methyl bending modes, respectively [28].
In the spectra of lipids, absorption bands are found in numerous spectral regions: the range of 3050 cm−1–2800 cm−1 for asymmetric and symmetric stretching vibrations of -CH2 and -CH3, the range of 1500 cm−1–1350 cm−1 for deformation vibrations of -CH2 and -CH3 from the acyl chains of lipids, the range of 1745 cm−1–1725 cm−1 for symmetric stretching vibrations of ester–carbonyl bond (C=O), and the range of 1270 cm−1–1000 cm−1 for odd (1240 cm−1) and symmetric (1080 cm−1) vibrations of -PO2- in phospholipids [29]. The IR spectra of nucleic acids are characterised in four spectral regions: the region of 1780 cm−1–1550 cm−1 for in-plane vibrations of double bonds of bases, the region of 1550 cm−1–1270 cm−1 for the deformation vibrations of bases that include the sugar vibrations, the region of 1270 cm−1–1000 cm−1 for vibrations of -PO2- and, finally, the region of 1000 cm−1–780 cm−1 for the vibrations of the sugar-phosphate backbone [30]. The carbohydrate spectra contain bands in the following ranges: the region of 3600 cm−1–3050 cm−1 is assigned to the stretching vibration of O-H, the range of 3050 cm−1–2800 cm−1 to the stretching vibrations of -CH3 and -CH2, the region of 1200 cm−1–800 cm−1 to the stretching vibrations of the C-O/C-C species, and, finally, the 1500 cm−1–1200 cm−1 relates to the deformational modes of the CH3/CH2 species [31]. In the blood analysis applications, the spectral bands of 3000 cm−1–2800 cm−1 are the most relevant ones for analysing red blood cells and platelets, while for the white blood cells, the most relevant band ranges are 513 cm−1–1445 cm−1. Thus, those targeted cells and corresponding spectral bands are the most used for blood analysis, particularly lab-on-a-chip applications.
2.3. Fourier Transform Infrared Spectroscopy (FTIR) Techniques
FTIR spectroscopy is a technique used to obtain the absorption or emission infrared spectrum of a solid, liquid, or gas [14][32]. The FTIR spectrometer simultaneously collects high-resolution information over a wide spectral range (between 4000 and 400 cm−1), a distinct advantage over a dispersive spectrometer, which estimates power over a narrow range of frequencies at once. The aim of spectroscopy techniques (FTIR or bright perceptible (UV–Vis) spectroscopy) is to quantify how much light a sample absorbs at each frequency [14]. The most direct approach, the “dispersive spectroscopy” method, consists of focusing a monochromatic light beam at a sample, measuring the amount of absorbed light, and recalculating it for each frequency [14]. Fourier transform spectroscopy is a less instinctive approach for obtaining similar data. Rather than focusing a monochromatic (single frequency) light emission at the sample, this strategy might focus a bar, or array, which contains numerous frequencies of light at once and measures how much of that beam is absorbed by the sample. Then, the wave is changed to contain a different mixture of frequencies giving a second data point. This cycle is repeated many times within a short period of time, and the information is acquired by a computer. For instance, the wave plotted in Figure 2, called an interferogram, is created by applying a broadband light source-one that contains the entire range of frequencies to be estimated. The light sparks into a Michelson interferometer (detailed in the next section), consisting of a special array of mirrors, one of which is moved by a motor. As this mirror moves, each light frequency in the column is occasionally obstructed, mediated, impeded, and transmitted by the interferometer. The different frequencies are tweaked at different rates so that the column exiting the interferometer has a different range at each second or mirror position [14][32].
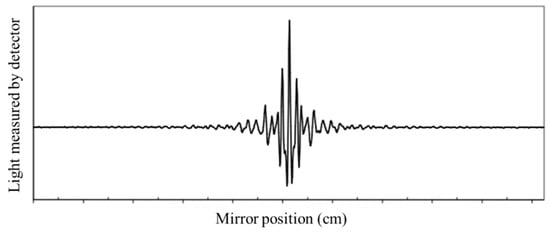
Figure 2. Example of a general FTIR interferogram. The central peak is positioned at the ZPD position (zero path difference or zero retardation), where the maximal amount of light passes through the interferometer to the detector.
Computational postprocessing based on Fourier frequencies is required to calculate the results (light pickup for each frequency) from the coarse raw information (light pickup for each mirror position), as presented in the example of Figure 2 [14][32]. Then, the Fourier transform converts a space (for this situation, the mirror’s distance in cm) into its opposite space (wavenumbers in cm−1).
The main limitations of FTIR spectroscopy relate to the tissue depth penetration of the infrared light, which only allows biochemical analysis of the tissues up to a few dozens of micrometers [20]. Additionally, in the conventional FTIR spectroscopy, which works in transmission mode and consequently with no incidence angle between emitter and sample, there is difficulty in assuring the reproducibility of the spacer thickness when using liquid samples [33].
The attenuated total reflectance Fourier transform (ATR -FTIR) technique as a complementary technique has helped FTIR spectroscopy overcome this limitation. ATR-FTIR is a particular FTIR spectroscopy method, which measures the reflected signal from a sample. In this reflectance setup, the IR radiation passes through a crystal with a high refractive index (typically with an angle of 45°) and undergoes total internal reflection before exiting the crystal and being directed to an IR detector [33][34]. ATR-FTIR has a lower penetration depth than conventional FTIR (around 200 nm) but, since it measures the reflected light, it is an adequate method for measuring high absorbing and high thickness samples that typically do not allow the transmission of IR radiation [33]. Additionally, this technique can direct measurements of gas, fluidic and thin-film solid-state samples without complex sample preparation and with enhanced surface sensitivity [33][34].
Finally, microscopic FTIR (micro-FTIR) [35] relates to another particular FTIR technique that couples an IR spectrometer to a visible light microscope in order to achieve better sensitivity when detecting condensed-phase compounds [36] and is adequate for measuring solid or liquid thin films samples. In this technique, the microscope focuses the IR laser beam on the sample, and the measurement mainly comes from the target focal point, meaning that even a short displacement in the laser beam or the sample could provide a significant difference in the results. Therefore, micro-FTIR distinguishes by allowing local measuring of a particular point in the sample, while the conventional FTIR gives the average information from a complete homogenised sample [35][36].
Besides helping to identify organic compounds based on their specific IR spectral fingerprint, FTIR also has a relevant role in detecting alterations or pathological states of the molecules and samples, leading to different spectra between patients and healthy controls. In the presence of pathology, the IR spectrum of a sample will change, either by changing its intensity or shifting its peak frequencies [37]. These shifts can be due to multiple chemical alterations in the molecules’ composition, including weakening of the bonds, decreasing mass of the molecules, or even shifting the stretching vibrations due to temperature variations, which will change the vibrational frequencies of the bands. More details on this can be found elsewhere [37].
2.4. Michelson Interferometer
The Michelson Interferometer technique was adapted for FTIR so that the light from the polychromatic IR source, effectively a blackbody radiator, is collimated and directed onto a beam splitter, with 50% of the photons by the fixed mirror and 50% transmitted by the movable mirror [32]. In this configuration, light is reflected from the two mirrors back to the beam splitter, and some fraction of the original light passes into the sample compartment Figure 3.
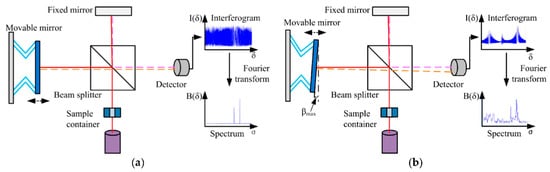
Figure 3. Schematic diagram of a Michelson interferometer configured for FTIR. (a) An ideal Michelson interferometer; (b) a Michelson interferometer with the movable mirror tilting. The continuous and dashed lines represent the different directions of light. Reprinted from [32], MDPI, under a Creative Commons Attribution (CC BY) license.
There, the light is focused on the sample. When leaving the sample compartment, the light is refocused on the detector. The difference in the optical path length between the two mirrors to the interferometer is known as the retardation or optical path difference (OPD) [32]. An interferogram (as in Figure 2) is obtained by varying the retardation and recording the signal from the detector for different retardation values. When no sample is present, the interferogram profile depends on the variation of the source intensity and splitter efficiency with wavelength. This results in a maximum at zero retardation when there is constructive interference at all wavelengths, followed by a series of wiggles [32]. This problem is critical in the case of zero default when there is constructive interference within the smallest wavelengths followed by a series of wigglers. The location of the null default is determined by locating the purpose of the excessive intensity within the interferogram. When a pattern is given away, the course interferogram is modulated with the aid of the absorption bands within the pattern (as exemplified in Figure 3) [32].
References
- O’Sullivan, J.W.; Stevens, S.; Hobbs, F.D.R.; Salisbury, C.; Little, P.; Goldacre, B.; Bankhead, C.; Aronson, J.K.; Perera, R.; Heneghan, C. Temporal trends in use of tests in UK primary care, 2000–2015: Retrospective analysis of 250 million tests. BMJ 2018, 363, k4666.
- National Academies of Sciences, Engineering, and Medicine. Improving Diagnosis in Health Care; National Academies Press: Washington, DC, USA, 2015.
- Rohde, T.; Martinez, R. Equipment and Energy Usage in a Large Teaching Hospital in Norway. J. Healthc. Eng. 2015, 6, 419–434.
- Pati, H.P.; Singh, G. Turnaround Time (TAT): Difference in Concept for Laboratory and Clinician. Indian J. Hematol. Blood Transfus. 2012, 30, 81–84.
- National Research Council (US) Committee on Prudent Practices in the Laboratory. Prudent Practices in the Laboratory: Handling and Management of Chemical Hazards: Updated Version; National Academies Press (US): Washington, DC, USA, 2011. Available online: https://www.ncbi.nlm.nih.gov/books/NBK55878/ (accessed on 1 June 2021).
- Luppa, P.B.; Müller, C.; Schlichtiger, A.; Schlebusch, H. Point-of-care testing (POCT): Current techniques and future perspectives. Trends Anal. Chem. 2011, 30, 887–898.
- Cole, L.; Kramer, P.R. Bacteria, Virus, Fungi, and Infectious Diseases. In Human Physiology, Biochemistry and Basic Medicine; Academic Press: Cambridge, MA, USA, 2016; pp. 193–196.
- Morris, R. Spectrophotometry. Curr. Protoc. Essent. Lab. Tech. 2015, 11, 2.1.1–2.1.30.
- Olaniyan, M.F. Lecture Notes on Laboratory Instrumentation and Techniques, 1st ed.; Achievers University: Owo-Nigeria, Nigeria, 2017; pp. 1–244.
- Orange County Biotechnology Education Collaborative, “Introduction to Biotechnology”, LibreTexts. 2013, pp. 1–148. Available online: https://batch.libretexts.org/print/Letter/Finished/bio-36736/Full.pdf (accessed on 1 July 2021).
- How an Automated Blood Cell Counter Works? Medsource Ozone Biomedicals. 2020. Available online: https://www.ozonebio.com/india/product-detail/alphacount-60#insights (accessed on 1 July 2021).
- Diem, M.; Chiriboga, L.; Lasch, P.; Pacifio, A. IR spectra and IR spectral maps of individual normal and cancerous cells. Biopolymers 2002, 67, 349–353.
- Byrne, H.J.; Bonnier, F.; McIntyre, J.; Parachalil, D.R. Quantitative analysis of human blood serum using vibrational spectroscopy. Clin. Spectrosc. 2020, 2, 100004.
- Griffiths, P.R.; de Haseth, J.A. Fourier Transform Infrared Spectrometry; John Wiley & Sons: New York, NY, USA, 1986.
- Mantsch, H.H.; Chapman, D. Infrared Spectroscopy of Biomolecules; John Wiley & Sons Inc.: New York, NY, USA, 1996.
- Cooper, E.A.; Knutson, K. Fourier transform infrared spectroscopy investigations of protein structure. Vaccine Des. 1995, 7, 101–143.
- Liquier, J.; Taillandier, E. Infrared spectroscopy of nucleic acids. In Infrared Spectroscopy of Biomolecules; Mantsch, H.H., Chapman, D., Eds.; Wiley-Liss: New York, NY, USA, 1996; pp. 131–158.
- Banyay, M.; Sarkar, M.; Graslund, A. A library of IR bands of nucleic acids in solution. Biophys. Chem. 2003, 104, 477–488.
- Brandenburg, K.; Seydel, U. Infrared spectroscopy of glycolipids. Chem. Phys. Lipids 1998, 96, 23–40.
- Mostaço-Guidolin, L.B.; Murakami, L.S.; Nomizo, A.; Bachmann, L. Fourier transform infrared spectroscopy of skin cancer cells and tissues. Appl. Spectros. Rev. 2009, 44, 438–455.
- Gremlich, H.U. Infrared and Raman Spectroscopy of Biological Materials; Marcel Dekker: New York, NY, USA, 2001.
- Near, Mid and Far-Infrared (dur.ac.uk), Infrared Processing and Analysis Center, NASA Official: Brian Dunbar. 10 April 2009. Available online: http://www.icc.dur.ac.uk/~tt/Lectures/Galaxies/Images/Infrared/Regions/irregions.html (accessed on 1 June 2021).
- Balan, V.; Mihai, C.T.; Cojocaru, F.D.; Uritu, C.M.; Dodi, G.; Botezat, D.; Gardikiotis, I. Vibrational Spectroscopy Fingerprinting in Medicine: From Molecular to Clinical Practice. Materials 2019, 12, 2884.
- Bramson, M.A. Infrared Radiation: A Handbook for Applications; Springer: New York, NY, USA, 1968.
- Talari, A.C.S.; Martinez, M.A.G.; Movasaghi, Z.; Rehman, S.; Rehman, I.U. Advances in Fourier transform infrared (FTIR) spectroscopy of biological tissues. Appl. Spectrosc. Rev. 2017, 52, 456–506.
- Movasaghi, Z.; Rehman, S.; Rehman, I.U. Fourier Transform Infrared (FTIR) Spectroscopy of Biological Tissues. Appl. Spectrosc. Rev. 2008, 43, 134–179.
- Barth, A. Infrared spectroscopy of proteins. Biochim. Biophys. Acta Bioenerg. 2007, 1767, 1073–1101.
- Fringeli, V.P. Membrane Spectroscopy; Springer: New York, NY, USA, 1981.
- Casal, H.L.; Mantsch, H.H. Polymorphic phase behaviour of phospholipid membranes studied by infrared spectroscopy. Biochim. Biophys. Acta Rev. Biomembr. 1984, 779, 381–401.
- Siebert, P.H.F. Vibrational Spectroscopy in Life Science; John Wiley & Sons: Berlin/Heidelberg, Germany, 2008.
- Wiercigroch, E.; Szafraniec, E.; Czamara, K.; Pacia, M.Z.; Majzner, K.; Kochan, K.; Kaczor, A.; Baranska, M.; Malek, K. Raman and infrared spectroscopy of carbohydrates: A review. Spectrochim. Acta Part A Mol. Biomol. Spectrosc. 2017, 185, 317–335.
- Chai, J.; Zhang, K.; Xue, Y.; Liu, W.; Chen, T.; Lu, Y.; Zhao, G. Review of MEMS Based Fourier Transform Spectrometers. Micromachines 2020, 11, 214.
- Grdadolnik, J. ATR-FTIR Spectroscopy: Its Advantages and Limitations. Acta Chim. Slov. 2002, 49, 631–642.
- Jelle, B.P.; Nilsen, T.N.; Hovde, P.J.; Gustavsen, A. Accelerated Climate Aging of Building Materials and their Characterization by Fourier Transform Infrared Radiation Analysis. J. Build. Phys. 2012, 36, 99–112.
- La Russa, M.F.; Ruffolo, S.A.; Barone, G.; Crisci, G.M.; Mazzoleni, P.; Pezzino, A. The Use of FTIR and Micro-FTIR Spectroscopy: An Example of Application to Cultural Heritage. Int. J. Spectrosc. 2009, 2009, 893528.
- Liu, Y.; Yang, Z.; Desyaterik, Y.; Gassman, P.L.; Wang, H.; Laskin, A. Hygroscopic Behavior of Substrate-Deposited Particles Studied by micro-FT-IR Spectroscopy and Complementary Methods of Particle Analysis. Anal. Chem. 2008, 80, 633–642.
- Coates, J. Interpretation of Infrared Spectra, A Practical Approach. In Encyclopedia of Analytical Chemistry; Meyers, R.A., McKelvy, M.L., Eds.; John Wiley & Sons Ltd.: Chichester, UK, 2000.
More
Information
Subjects:
Instruments & Instrumentation
Contributors
MDPI registered users' name will be linked to their SciProfiles pages. To register with us, please refer to https://encyclopedia.pub/register
:
View Times:
3.5K
Revisions:
2 times
(View History)
Update Date:
14 Feb 2022
Table of Contents


Notice
You are not a member of the advisory board for this topic. If you want to update advisory board member profile, please contact office@encyclopedia.pub.
OK
Confirm
Only members of the Encyclopedia advisory board for this topic are allowed to note entries. Would you like to become an advisory board member of the Encyclopedia?
Yes
No
${ textCharacter }/${ maxCharacter }
Submit
Cancel
Back
Comments
${ item }
|
${ item.createdUser.fullName }
${ item.createdAt }
${ item.vote }
${ item.reply }
Delete
${ reply.createdUser.fullName }
${ reply.createdAt }
${ reply.vote }
Delete
There is no reply to this comment~
${ item.replyTextCharacter }/${ item.replyMaxCharacter }
Submit
Cancel
More
No more~
There is no comment~
${ textCharacter }/${ maxCharacter }
Submit
Cancel
${ selectedItem.replyTextCharacter }/${ selectedItem.replyMaxCharacter }
Submit
Cancel
Confirm
Are you sure to Delete?
Yes
No