Your browser does not fully support modern features. Please upgrade for a smoother experience.
Submitted Successfully!
 +1 credit
Thank you for your contribution! You can also upload a video entry or images related to this topic.
For video creation, please contact our Academic Video Service.
| Version | Summary | Created by | Modification | Content Size | Created at | Operation |
|---|---|---|---|---|---|---|
| 1 | Shanshan Zhang | + 4104 word(s) | 4104 | 2022-01-27 05:10:32 | | | |
| 2 | Bruce Ren | -1 word(s) | 4103 | 2022-02-11 02:43:14 | | | | |
| 3 | Bruce Ren | -1 word(s) | 4103 | 2022-02-11 02:45:33 | | | | |
| 4 | Bruce Ren | Meta information modification | 4103 | 2022-02-15 05:14:31 | | | | |
| 5 | Bruce Ren | Meta information modification | 4103 | 2022-02-15 05:18:58 | | |
Video Upload Options
We provide professional Academic Video Service to translate complex research into visually appealing presentations. Would you like to try it?
Cite
If you have any further questions, please contact Encyclopedia Editorial Office.
Zhang, S. Host Cyanobacteria Killing by Novel Lytic Cyanophage YongM. Encyclopedia. Available online: https://encyclopedia.pub/entry/19350 (accessed on 29 June 2026).
Zhang S. Host Cyanobacteria Killing by Novel Lytic Cyanophage YongM. Encyclopedia. Available at: https://encyclopedia.pub/entry/19350. Accessed June 29, 2026.
Zhang, Shanshan. "Host Cyanobacteria Killing by Novel Lytic Cyanophage YongM" Encyclopedia, https://encyclopedia.pub/entry/19350 (accessed June 29, 2026).
Zhang, S. (2022, February 11). Host Cyanobacteria Killing by Novel Lytic Cyanophage YongM. In Encyclopedia. https://encyclopedia.pub/entry/19350
Zhang, Shanshan. "Host Cyanobacteria Killing by Novel Lytic Cyanophage YongM." Encyclopedia. Web. 11 February, 2022.
Copy Citation
Cyanobacteria are autotrophic prokaryotes that can proliferate robustly in eutrophic waters through photosynthesis. This can lead to outbreaks of lake “water blooms”, which result in water quality reduction and environmental pollution that seriously affect fisheries and aquaculture. The use of cyanophages to control the growth of cyanobacteria is an important strategy to tackle annual cyanobacterial blooms. YongM is a novel lytic cyanophage with a broad host spectrum and high efficiency in killing its host, cyanobacteria FACHB-596. However, changes in cyanophage protein profile during infestation and killing of the host remains unknown.
cyanophage
Nostoc sp.
label-free quantitative proteomics
photosynthesis
substance metabolism
energy metabolism
1. Introduction
Water eutrophication is a global water pollution problem that causes massive production of cyanobacteria [1][2]. The latter can lead to a cyanobacteria bloom, causing huge economic and environmental losses [3][4][5]. Cyanophages are a group of viruses that specifically infect prokaryotic cyanobacteria [6][7][8][9], playing a very important role in the regulation of the population and influencing evolution [10]. These viruses are biological control agents and have great potential for controlling harmful blooms of cyanobacteria [11]. However, most reported cyanophages have strong host specificity, a narrow cyanobacteria-killing spectrum, and a long lysis cycle [12][13]. For example, MA-LMM01, isolated from Lake Mikata, Japan [14], could only infect a toxic strain of Microcystis aeruginosa and had a long incubation period [15][16]. The Podoviridae cyanophages Pf-WMP3 [17] and Pf-WMP4 [18] can infect the same host cyanobacteria, but with a narrow algaecidal spectrum. Infection experiments have shown that S-LBS1 takes about four days to induce cyanobacterial lysis, and only in strain TCC793 of Synechococcus sp. [19]. In addition, newly discovered cyanophages in the last 2–3 years, such as PA-SR01, only lysed Pseudanabaena sp. KCZY-C8 [20]. Mic1 was only infective to its host, Microcystis wesenbergii FACHB-1339 [21]. Cyanophages S-H68 and S-B68, isolated from Bohai Sea waters, had incubation periods as long as 41 and 49 h, respectively [22][23]. Cyanobacterial blooms are usually formed by mixed outbreaks of multiple cyanobacteria with a rapid reproduction rate [24][25]. Therefore, application of existing cyanophages to treat cyanobacterial blooms is limited [26][27].
Cyanophage infection of cyanobacteria involves multiple proteins, and conventional methods cannot systematically analyze their mechanisms of action in a high throughput fashion. The quantitative proteomics system is a powerful approach in investigating the pivotal proteins involved in the cyanophage’s infection of host cyanobacteria and deciphering the cyanobacteria-killing mechanism of cyanophages. Studies on Prochlorococcus sp. MED4 and its cyanophage P-SSP7 have shown that infection is followed by complex gene expression dynamics, but little is known about the initial cyanophage-host interactions [28]. The infection of the cyanophage S-SM1 with polycoccus WH8102 has been studied with an isotope-labeled proteomic approach to determine the uptake of extracellular nitrogen and its use in biosynthesis of viral and host proteins [29]. The effect on photosynthesis of the cyanophage P-TIM68 carrying PSI and PSII-related genes during infection of the host MIT9515 in tropical oceans showed that P-TIM68 may maintain or even manipulate host photosynthesis [30]. Genomics, proteomics, and transcriptomics have been used to trace Shine–Dalgarno sequence differences in Synechocystis sp., Microcystis aeruginosa, cyanophage, tobacco chloroplasts, and Arabidopsis chloroplasts [31]. However, off-label quantitative proteomics have not been used to investigate the mechanism of cyanophage infestation of host cyanobacteria. Also, further research is needed on the kinetics, phagocytosis pattern, and mechanism of interaction between the cyanophage and host [32].
The newly isolated Myoviridae cyanophage from water samples of Kunming Dianchi Lake, YongM, has efficient lysis characteristics and can rapidly infest and lyse its host Nostoc sp. FACHB-596 within 24 h. YongM was able to lyse 18 of 33 tested cyanobacteria strains, indicating a broad spectrum of lysis hosts. The lysis characteristics of YongM have been studied by exposure experiments and absorbance measurements. The color change of the host solution was not obvious 1 h after YongM infestation, but it turned yellow after 8 h, representing the lysis phase. This lysis efficiency is more rapid and efficient than any strain reported so far and it can be potentially applied to control cyanobacterial blooms. Therefore, the host cyanobacteria 1 and 8 h after YongM infestation were used for quantitative proteomic comparison. DEPs in the host were screened and the expression characteristics were bioinformatically analyzed. GO analysis revealed that after infection, most of the DEPs were associated with photosynthesis, light response, precursor metabolites and energy production, and metabolic processes of organic nitrogen compounds. KEGG pathway enrichment results indicated that metabolic pathways, such as photosynthesis, photosynthesis-antenna protein, oxidative phosphorylation, ribosome, carbon fixation, and glycolysis/glycoisomerization were significantly altered in the infested host cyanobacteria. In addition, there were several key, differentially expressed proteins, such as photosystem I P700 chlorophyll-a apolipoprotein, carbon dioxide concentration mechanism protein, and cytochrome B. These may serve as hotspots for the study of the YongM-host interaction mechanism. They can also provide genetic resources and a theoretical basis for future cyanophage transformation to produce efficient and broad-spectrum cyanophages, and to understand their interaction with the hosts.
2. Host Cyanobacteria Killing by Novel Lytic Cyanophage YongM
2.1. Effect of YongM Infection on Host Growth
YongM was added to log-phase host cyanobacteria FACHB-596 cells and was incubated under a circadian rhythm (alternate 12 h dark and light periods). The color change of the cyanobacteria solution is not obvious after 1 h, where YongM is still in the latent phase, but the solution turned yellow after 8 h (Figure 1), indicating that the phagosome was in lysis phase. The susceptibility of 33 cyanobacterial strains to YongM is shown in Table 1.
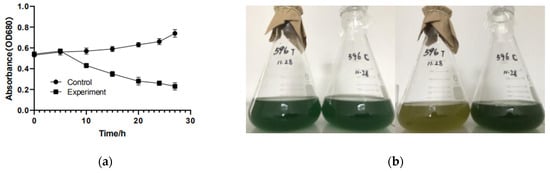
Figure 1. Growth of host cyanobacteria FACHB-596 after cyanophage YongM infection. (a) Host cyanobacteria FACHB-596 absorbance versus infection time by YongM; (b) Phenotypic changes of YongM-infected host cyanobacteria FACHB-596 cells after 1 h (left) and 8 h (right).
Table 1. Host range analysis of YongM against 33 cyanobacterial strains.
| Orders | Family | Species | Strains | Susceptibility | Origin |
|---|---|---|---|---|---|
| Chroococcales | Microcystaceae | Microcystis aeruginosa | FACHB-905 | + | China |
| FACHB-925 | − | Australia | |||
| FACHB-942 | − | China | |||
| FACHB-469 | + | France | |||
| FACHB-924 | − | Australia | |||
| FACHB-1326 | − | China | |||
| FACHB-912 | − | China | |||
| M. wesenbergii | FACHB-908 | + | China | ||
| FACHB-1112 | − | China | |||
| FACHB-1317 | − | China | |||
| FACHB-1318 | − | China | |||
| FACHB-929 | + | Japan | |||
| M. viridis | FACHB-979 | + | Japan | ||
| M. Flos-aquae | FACHB-1028 | + | China | ||
| Microcystis sp. | FACHB-915 | + | France | ||
| M. elabens | FACHB-916 | − | Japan | ||
| M. Panniformis | FACHB-1757 | − | China | ||
| M. ichthyoblabe Kutz | FACHB-1294 | − | China | ||
| FACHB-1409 | + | China | |||
| Chroococcacaea | Chroococcus sp. | FACHB-193 | + | China | |
| Nostocales | Aphanizomenonaceae | Aphanizomenon flos-aquae | FACHB-1039 | − | China |
| FACHB-1040 | + | China | |||
| Anabaena flos-aquae | FACHB-245 | + | USA | ||
| Anabaena sp. | FACHB-418 | + | France | ||
| Dolichospermum flos-aquae | FACHB-1255 | + | China | ||
| Nostocaceae | Nostoc sp. | FACHB-596 | + | China | |
| Oscillatoriale | Microcoleaceae | Planktothrix agardhii | FACHB-1166 | − | China |
| FACHB-920 | + | Japan | |||
| Planktothricoides raciborskii | FACHB-881 | + | China | ||
| Oscillatoriaceae | Oscillatoria planctonica | FACHB-708 | + | China | |
| Hormogonales | Scytonemataceae | Plectonema | FACHB-402 | − | USA |
| FACHB-240 | − | USA | |||
| Synechococcales | Synechococcaceae | Synechococcus sp. | FACHB-805 | + | Australia |
2.2. Altered FACHB-596 Protein Expression Profile Caused by YongM Infection
Logarithmic stage host cyanobacteria FACHB-596 infested with YongM after 1 h and 8 h were used as experimental groups (T1 and T8, respectively), whereas cells not exposed to the cyanophage were used as control (C1 and C8, respectively). Proteomic and bioinformatic analyses showed up to 573 proteins differentially expressed after cyanophage infection. Principal component analysis (PCA) of these DEPs (Figure 2a) showed a small separation between the samples in the same group, but a large separation for samples belonging to different groups. This indicates that the experiments were reproducible, and the data was reliable. This also suggests that there are protein expression changes between experimental and control groups.
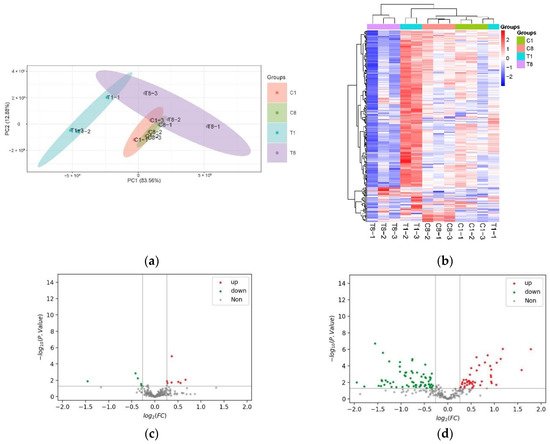
Figure 2. Changes in protein expression in host cyanobacteria caused by YongM infection. (a) PCA of DEPs; (b) heat map; (c,d) volcanic maps of DEPS after 1 h infection (c) and 8 h infection (d).
To visualize the changes in the FACHB-596 cyanobacteria cells altered proteome caused by YongM infection, DEPs were clustered and heatmaps were drawn (Figure 2b). A total of 12 DEPs (5 down-regulated and 7 up-regulated) were significantly altered after 1 h of infection compared to the control (Figure 2c). The most down-regulated protein was the 50S ribosomal protein L23 (A0A1Z4KLJ5_ANAVA), whereas the most up-regulated protein was the ATP-dependent zinc metalloproteinase FtsH (Q8YXF2_NOSS1). After 8 h, 112 DEPs (67 down-regulated and 45 up-regulated) were altered (Figure 2d). The most down-regulated protein being peroxidase 2 family protein/glutaminase (Q8YWR3_NOSS1) and the most up-regulated protein being photosystem I P700 chlorophyll-a apolipoprotein A1 (A0A1Z4M5R2_MICDP).
2.3. Functional Analysis of DEPs
The number of DEPs individually expressed during 1 h and 8 h after infection in the YongM-infected and uninfected host cells were 127, 74, 74 and 43, respectively. The top 3 statistics of DEPs (Table 2) show that after 1 h of infection, only the membrane-bound, ATP-dependent zinc metalloproteinase FtsH, generally conserved in prokaryotes, was significantly up-regulated. This protein degrades proteins with low thermodynamic stability and lacks unfolding enzyme activity. This suggests that it may be part of a prokaryotic self-protection mechanism to check whether proteins are folded correctly. Ribosomal protein S14, one of the major constituent proteins of small subunit 30 S, is significantly up-regulated in bacteria, cyanobacteria, and plants, indicating enhanced translational activity and high protein synthesis. An additional All4042 protein of unknown function was also significantly up-regulated. The significantly down-regulated outer membrane efflux protein (Alr2887 protein) forms a trimeric channel that can export a variety of substrates in Gram-negative bacteria. After 8 h of infection, photosystem I P700 chlorophyll-a apolipoprotein A1 was significantly up-regulated. This is a membrane protein complex that uses light energy to mediate the transfer of electrons from plastid proteins to ferric oxide reducing proteins and is primarily involved in cyanobacterial photosynthesis. Carbon dioxide concentration mechanism protein is present in a number of autotrophic and non-autotrophic multiple polyhedral shell proteins (CcmK), therefore it may be related to CO2 utilization. A significantly down-regulated protein was the late competence development protein (A0A1Z4IAM0) that produces an adaptive response to external stimuli and is required for cellular uptake of exogenous DNA from the environment leading to transforming capacity. The latter is prevalent in bacteria and may be involved in gene transfer. The significantly down-regulated photosystem I reaction center subunit IV, present on the matrix side of the cystoid membrane, can form complexes with ferricoxigenin and ferricoxigenin oxidoreductase at the photosystem I reaction center and is associated with cyanobacterial photosynthesis. The phycocyanin β subunit, a phycobilisome protein, collects light energy through water-soluble complexes of the phycobilisome, which are attached to the outer surface of the cystoid membrane and can transfer absorbed energy to the photosynthetic reaction center with >95% efficiency.
Table 2. The three most significant DEPs in host cyanobacteria induced by YongM infection of FACHB-596 cells. ↑: significantly up-regulated; ↓: significantly down-regulated.
| Accession | Protein Name | p Value | Adj. p-Value | T1:C1 | T8:C8 |
|---|---|---|---|---|---|
| Q8YXF2 | ATP-dependent zinc metalloproteinase FtsH | 0.008218777 | 0.52091175 | 1.5848247↑ | |
| Q8YPZ8 | All4042 protein | 0.020302562 | 0.55631214 | 1.4674468↑ | |
| A0A6P0S0D5 | 30S ribosomal protein S14 | 0.014660408 | 0.53405772 | 1.4211440↑ | |
| Q8YT39 | Alr2887 protein | 0.005383913 | 0.45763262 | 0.7740167↓ | |
| Q8YTI1 | All2736 protein | 0.001327486 | 0.16925451 | 0.7467759↓ | |
| A0A1Z4KLJ5 | 50Sribosomal protein L23 | 0.01222975 | 0.52091175 | 0.3643173↓ | |
| A0A1Z4M5R2 | Photosystem I P700 chlorophyll-a apolipoprotein A1 | 0.000000967 | 0.0000825 | 3.42825728↑ | |
| Q8YYI1 | Carbon Dioxide Concentration Mechanism protein | 0.000305335 | 0.00390828 | 2.98863046↑ | |
| Q8YTI1 | All2736 protein | 0.000000887 | 0.0000825 | 2.26210112↑ | |
| A0A1Z4IAM0 | Unknown functional protein | 0.000000195 | 0.0000499 | 0.33966838↓ | |
| A0A1Z4KN79 | Argininosuccinate synthase | 0.030938777 | 0.07920326 | 0.28915421↓ | |
| Q8YWR3 | Peroxidase 2 family of proteins/glutaminase | 0.009777517 | 0.04120970 | 0.25880121↓ |
In summary, after 8 h of infection, host cells showed a weakened defense against exogenous nucleic acid. Expression of argininosuccinate synthase was reduced, resulting in the inhibition of the penultimate step in arginine biosynthesis. This makes it impossible to form argininosuccinate, AMP, and pyrophosphate from citrulline and aspartate.
2.4. GO Analysis of DEPs
GO analysis revealed that the main biological process of DEPs after 1 h of infection was protein metabolism. Cellular components were mainly intrinsic to the membrane, and molecular functions were mainly long- and medium-chain fatty acid-coenzyme ligase activity and fatty acid ligase activity (Figure 3a). After 8 h of infection, the main biological processes of DEPs were precursor metabolites and energy production, photosynthesis, and light reaction. The cellular components were mainly cells and their cell membrane parts. The molecular functions were mainly related to electron transfer activity (Figure 3b). In addition, DEPs were also involved in carbon fixation in photosynthesis, amino acid synthesis, and biosynthesis of antibiotics.
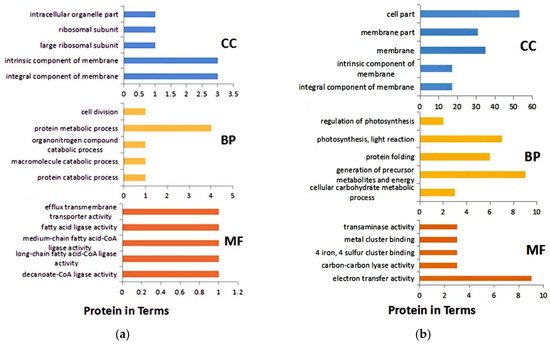
Figure 3. GO analysis of DEPs. (a) after 1 h infection; (b) after 8 h infection. BP: Biological process; CC: Cell composition; MF: Molecular function.
2.5. KEGG Pathway Analysis of DEPs
KEGG Pathway analysis is the analysis of information networks connecting known molecular interactions, such as metabolic pathways, complexes, and biochemical reactions. The KEGG Pathway was used to analyze DEPs through the MaxQuant Cloud Platform for Integrative Analysis of Genomic Data Collection. Four metabolic pathways, involving 7 DEPs, were significantly enriched 1 h after infections, and 4 of them showed elevated DEPs, accounting for 57.1% (Figure 4a). A total of 41 pathways involving 141 DEPs were enriched 8 h after infection, and six metabolic pathways were significantly enriched with DEPs common to all of them. For example, the photosynthesis-related protein (A0A5Q0GEQ2) was involved in both photosynthesis-related and oxidative phosphorylation metabolic pathways (Figure 4b). Six metabolic pathways were significantly enriched after 1 h and 8 h containing 39 DEPs (Table 3). Among the DEPs found in all pathways, 116 DEPs down-regulated (82.3%), suggesting that 8 h after infection most protein expression in the host cyanobacteria was inhibited, resulting in a significant decrease in metabolic activity and a weakening of the vital processes. Enriched pathways (Figure 4) included those directly related to cyanobacteria pigment synthesis and energy supply, such as ribosome metabolism, carbon fixation, oxidative phosphorylation, energy metabolism, photosynthesis, and secondary metabolites (e.g., phenylpropanoids and dicarboxylic acids).
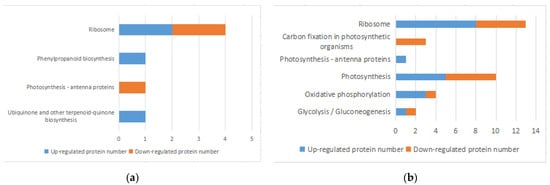
Figure 4. Enrichment of KEGG pathway in DEPs. (a,b) KEGG enrichment histogram of DEPs after 1 h infection (a) and after 8 h infection (b).
Table 3. List of DEPs involved in metabolic pathways after infection of host cyanobacteria FACHB-596 cells by YongM.
| KEGG Pathway | Protein Name | Protein Description | Upward/Downward |
|---|---|---|---|
| Photosynthesis-antennal proteins | ApcB | Allophycocyanin β subunit | Down |
| CpcB | Phycocyanin associated rod junction protein | Up | |
| Ribosomal | L23 | Ribosomal large subunit protein L23 | Down |
| L2 | Ribosomal large subunit protein L2 | Down | |
| S14 | Ribosomal small subunit protein S14 | Up | |
| L35 | Ribosomal large subunit protein L35 | Up | |
| L3 | Ribosomal large subunit protein L3 | Down | |
| L4 | Ribosomal large subunit protein L4 | Down | |
| L22 | Ribosomal large subunit protein L22 | Down | |
| L29 | Ribosomal large subunit protein L29 | Up | |
| L5 | Ribosomal large subunit protein L5 | Down | |
| S5 | Ribosomal small subunit protein S5 | Up | |
| L13 | Ribosomal large subunit protein L13 | Up | |
| L1 | Ribosomal large subunit protein L1 | Up | |
| L35 | Ribosomal large subunit protein L35 | Up | |
| S6 | Ribosomal small subunit protein S6 | Down | |
| L21 | Ribosomal large subunit protein L21 | Up | |
| S16 | Ribosomal small subunit protein S16 | Up | |
| S1 | Ribosomal small subunit protein S1 | Up | |
| Oxidative phosphorylation | NdhK | NAD (P) H-quinone oxidoreductase subunit K(EC:7.1.1.2) | Down |
| alpha | F-type H+/Na+ transporter ATPase subunit α (EC:7.1.2.2 7.2.2.1) | Up | |
| b | ATPase B subunit | Up | |
| OSCP | F type H~+ transport ATPase subunit | Up | |
| Photosynthesis | Psb-A | Photosystem II P680 reaction center D1 protein (EC:1.10.3.9) | Down |
| Psb-O | Photosystem II oxygen evolution enhancer protein 1 | Down | |
| Psb-U | Photosystem IIPsbU protein | Down | |
| Psb-V | Photosystem II cytochrome C550 | Down | |
| Psb27 | Photosystem IIPsb27 protein | Up | |
| PsaA | Photosystem I P700 chlorophyll-a apolipoprotein A1 | Up | |
| PetA | Acocytochrome F | Up | |
| PetE | plastocyanin | Down | |
| alpha | F-type H+/Na+ transporter ATPase subunit α (EC:7.1.2.2 7.2.2.1) | Up | |
| b | ATPase B subunit | Up | |
| Carbon fixation | 2.7.9.1 | Pyruvate, orthophosphate dikinase | Down |
| 4.1.1.39 | Ribulose bisphosphate carboxylase large chain | Down | |
| 2.7.2.3 | phosphoglyceric kinase | Down | |
| 2.7.9.1 | Pyruvate, orthophosphate dikinase | Down | |
| Glycolysis and gluconeogenesis | 2.7.2.3 | phosphoglyceric kinase | Down |
| 2.3.1.12 | Pyruvate dehydrogenase E2 component (dihydrolipamidoacetyltransferase) | Up |
2.5.1. Analysis of Photosynthetic DEPs
The phycobilisomes consist of multiple photosynthetic light-harvesting proteins (i.e., photosynthesis-associated haptoglobin) attached to the outer surface of the cystoid membrane [33]. Cyanobacteria collects light energy through multiple light-harvesting proteins in this complex and transfers the absorbed energy to photosynthetic reaction centers with an efficiency greater than 95%. Among these light-harvesting proteins, phycocyanin is the core component of the water-soluble complex, receiving and transferring energy to the chlorophyll of the cystoid membrane [34]. When YongM infested the host for 1 h, the expression of phycocyanin in the host was reduced, the light-harvesting ability was weakened whereas photosynthesis was inhibited. In contrast, after 8 h YongM infiltration, we observed elevated phycocyanin-related rod-linked proteins, which contributed to light uptake and increased photosynthetic efficiency.
The PSII oxygen precipitation complex (OEC) consists of five subunits, PsbO, PsbP, PsbQ, PsbU, and PsbV [35], which can be photolyzed by water to provide protons for PSI. Its P680 reaction center contains chlorophyll a, which photolyzes water and produces ATP using a proton pump [36]. The P700 reaction center of PSI contains chlorophyll, which absorbs electrons and associated hydrogen delivered from PSII to reduce NADP+ to NADPH. Both ATP and NADPH are then used in light-independent dark reactions, culminating in the conversion of carbon dioxide to glucose and the release of oxygen as a byproduct. PSII is a multisubunit protein-pigment complex in which the core, chlorophyll, and β-carotene bind mainly to the haptoglobin CP43 (PsbC) and CP47 (PsbB), which transmit excitation energy to the reaction center proteins PsbA and PsbD, combining all redox-active cofactors involved in energy conversion [37][38]. After 8 h of infection, the subunits responsible for water photolysis, PsbO, PsbP, PsbQ, and PetE related to photosynthetic electron transport were all down regulated, whereas the photoresponsive phase was suppressed. The up-regulated proteins were Psb27, a highly conserved component of photosystem II consisting of four helices [39], PsaA, a membrane-integrated protein involved in constituting PSI [40] and the cytochrome complex PetA [41], a protein associated with senescence whose up-regulation may indicate that photosynthesis was almost stagnant, and cells were in a state of senescence.
In addition to the above pathway, all DEPs in the carbon fixation pathway were down-regulated after 8 h; phosphoglycerate kinase (PGK), present in all living organisms, catalyzes the interconversion of ATP and ADP and is highly conserved throughout evolution, converting 1,3-diphosphoglycerate to 3-phosphoglycerate in the second step of glycolysis and forming a molecule of ATP [42]. In most cells, this reaction is essential for ATP production in aerobic bacteria, fermentation in anaerobic bacteria, and carbon fixation in plants. Ribulose diphosphate carboxylase large subunit (RbcL) is the macromolecular subcomplex site of Rubsico, and the RbcX protein has been identified as possessing a chaperone-like protein function, as it contributes to the correct assembly of RbcL and RbcS subunits during Rubsico biosynthesis [43]. This metabolic pathway is complemented by down-regulated pyruvate phosphate dikinase, which catalyzes the reversible conversion of ATP to AMP, pyrophosphate, and phosphoenolpyruvate (PEP). These two enzymes are essential for carbon fixation in cyanobacteria cells, resulting in an inadequate energy supply mechanism during carbon fixation and blocked organic matter synthesis in the host cyanobacteria.
2.5.2. Analysis of Energy Metabolism DEPs
After 8 h of infection, expression of ubiquinone oxidoreductase, an enzyme that catalyzes the transfer of electrons from NADH to ubiquinone and is associated with proton translocation across membranes, was reduced. This is the largest and most complex enzyme in the respiratory chain. In cyanobacteria, the three subunits NdhM, NdhN, and NdhO of the NDH-1 complex influence the electron flow around PSI by providing additional ATP for plastids and photosynthesis in cyanobacteria [44]. The NADH dehydrogenase I complex transfers electrons through FMN and Fe-sulfur centers to quinones in the respiratory and photosynthetic chains and couples redox reactions to proton transport, resulting in proton redox energy conserved as a proton gradient [45][46]. Also, among the upregulated expression proteins, alpha is transmembrane ATPases, which are membrane-bound enzyme complexes/ion transport proteins that use ATP hydrolysis to drive proton translocation across membranes. There are also transmembrane ATPases that work in reverse, using energy in the proton gradient and transmembrane ion flow across the ATPase proton channel to drive ATP synthesis. b is F-ATPase, also known as ATP synthase, a type of transmembrane ATPase that hydrolyzes ATP in bacteria to generate a proton gradient [47][48]. The above suggests that infection by YongM results in the restriction of proton transport during oxidative phosphorylation of the host.
In addition, two DEPs, one up-regulated and another down-regulated, were involved in the glycolytic and gluconeogenic metabolic pathways after 8 h of infection. The up-regulated protein is the 2-oxoacid dehydrogenase acyltransferase, which catalyzes the overall conversion of α-ketoacid to acyl-CoA and CO2 [49], whereas the down-regulated one is PGK, which is involved in the carbon fixation pathway that is also down-regulated. This protein could catalyze the interconversion of ATP and ADP. Thus, the infestation of YongM may prevent host glycolysis and gluconeogenesis pathways from proceeding normally by regulating the overall conversion of α-keto acid to acyl-CoA and carbon dioxide and the expression of catalytic enzymes that convert ATP and ADP.
2.5.3. Analysis of Translation Function DEPs
Ribosomes are organelles present in all organisms that use mRNA as a template for the targeted synthesis of genetic information carried by genes. About 1/3 of the ribosome mass consists of proteins that are named small subunit proteins (S1 to S31) and large subunit proteins (L1 to L44), based on their ribosomal subunit size. Many ribosomal proteins, especially those of the large subunit, have long finger-like protrusions that extend into the rRNA core and stabilize their structure. In the large subunits, about 1/3 of the 23S rRNA nucleotides are at least in Van der Waals contact with the protein, while L22 interacts with all six structural domains of the 23S rRNA. The proteins S4 and S7 of the starting 16S rRNA assembly are located at the junctions of five and four RNA helices, respectively, and can be used to organize and stabilize the tertiary structure of the rRNA [50][51].
After 1 h of exposure, we observed a decrease in protein expression of ribosomal large subunit proteins L25 and L2, which are known to bind 23S rRNA and have peptidyl transferase activity in E. coli. Among the proteins with elevated expression, S14 is one of the proteins from the small subunit of the ribosome. This protein is required for the assembly of 30S particles in E. coli and may also be responsible for determining the conformation of 16S rRNA at the A site [52]. Cyanobacteria are Gram-negative bacteria, and the function of its ribosomal proteins is similar to that of E. coli. After 8 h of infection, the number of proteins with elevated expression increased significantly, e.g., L1, the largest protein from the ribosomal subunit, with RNA binding site highly conserved and RNA chaperone activity. Compared with 1 h, differentially expressed ribosomal proteins were significantly increased after 8 h. Five large subunit proteins associated with ribosomal rRNA core stability were up-regulated (L29, L13, L1, L35, L21) which facilitate the stable translation of mRNA and sustained protein synthesis. In addition, the expression of the S5 protein, which is closely related to the function of 30S small subunit assembly and can reduce the rate of translation errors, was also up regulated. We speculate that this is consistent with the high vital activity of the cyanophage after 8 h, when they are in the stage of cleavage.
2.6. Structural and Functional Proteins of YongM
Amplification, concentration, and mass spectrometry (LC-MS/MS) analysis of YongM were performed to further validate the results obtained. By delineating and comparing the functional modules of the predicted Open Reading Frames (ORFs) and the actual identified proteins by mass spectrometry (Figure 5b,c), we found that 32 proteins (33.34% of the predicted ORFs) out of 93 predicted proteins (Figure 5a) in the YongM genome could be identified by mass spectrometry proteomics. These included 14 structural proteins, 5 functional proteins, and 13 unknown functional proteins (Table 4), most of which were encoded by the identified structural genes. The molecular weights of the identified proteins were very close to the predicted values. In addition, we identified two lysozymes (Anabaena phage Elbi) and a single lysozyme (Nostoc phage N1) by protein profiling, encoded by the predicted ORFs at position 41 and 86 of the YongM genome, with sizes of 99 kDa and 12.65 kDa, respectively. Four genes were related to DNA anabolism: thymidylate kinase, DNA polymerase, nucleic acid endonuclease, and alkaline phosphatase, which may contribute to the rapid infection and proliferation of YongM [53]. Therefore, we speculate that the lysis efficiency of YongM is inextricably linked to its own dual lytic enzymes and DNA synthesis-related proteins. In addition, the ability of YongM to lyse its host within 12 h and its relatively wide host range may also be attributed to its multiple restriction endonucleases and methylesterases. YongM may serve as a model for future studies on the interaction between these enzymes and freshwater cyanobacteria.
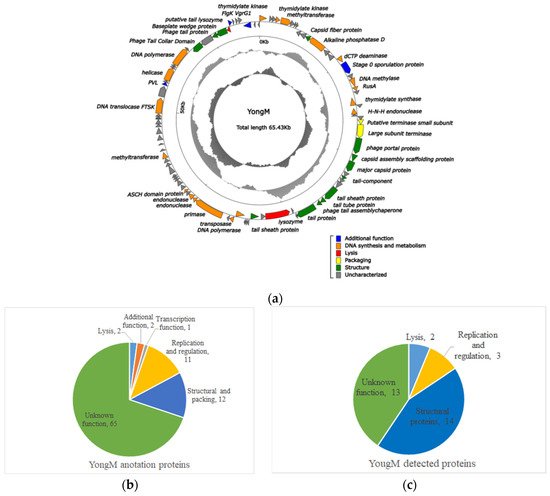
Figure 5. Comparison of predicted ORFs of YongM with proteins identified by proteomics. (a) Genome map of YongM; (b) heat map of DEPs due to cyanophage YongM infestation of host cyanobacteria FACHB-596 cells; (c) protein function/metabolic pathway and proportion of YongM detected proteins.
Table 4. Protein profile identification results of YongM.
| No. | Location | Description | Score | Coverage |
|---|---|---|---|---|
| 1 | 20651.21748 | putative major capsid protein (Nostoc phage A1) | 10,458 | 86% |
| 2 | 23869.25389 | tail sheath protein (Nostoc phage A1) | 4372 | 46% |
| 3 | 57421.58554 | tail collar protein (Nostoc phage A1) | 2265 | 24% |
| 4 | 25487.25996 | tail tube protein (Nostoc phage A1) | 2101 | 91% |
| 5 | 18162.19766 | hypothetical protein (Nostoc phage A1) | 1811 | 62% |
| 6 | 29345.32047 | lysozyme (Anabaena phage Elbi) | 1151 | 30% |
| 7 | 5775.7658 | alkaline phosphatase D family protein (Salinivenus lutea) | 1132 | 35% |
| 8 | 26714.28780 | tail protein (Nostoc phage A1) | 1119 | 34% |
| 9 | 60572.61747 | baseplate J tail protein (Nostoc phage N1) | 1048 | 44% |
| 10 | 5256.5762 | Capsid fiber protein | 1037 | 61% |
| 11 | 58577.59965 | tail fiber protein (Nostoc phage N1) | 995 | 42% |
| 12 | 21893.22378 | hypothetical protein (Nostoc phage A1) | 925 | 49% |
| 13 | 19898.20644 | putative outer membrane protein (Nostoc phage A1) | 912 | 49% |
| 14 | 61784.62131 | lysozyme (Nostoc phage N1) | 672 | 73% |
| 15 | 4580.5233 | hypothetical protein (Nostoc phage A1) | 453 | 24% |
| 16 | 32813.33661 | hypothetical protein (Nostoc phage N1) | 376 | 37% |
| 17 | 8358.9086 | hypothetical protein (Nostoc phage A1) | 288 | 20% |
| 18 | 59997.60572 | tail collar protein (Nostoc phage A1) | 198 | 30% |
| 19 | 23110.23832 | hypothetical protein (Nostoc phage A1) | 169 | 25% |
| 20 | 7738.8361 | hypothetical protein (Nostoc phage A1) | 156 | 40% |
| 21 | 62202.62531 | hypothetical protein | 101 | 64% |
| 22 | 32074.32541 | hypothetical protein | 100 | 26% |
| 23 | 63660.64472 | Baseplate structural protein | 71 | 11% |
| 24 | 22375.22701 | putative tail-component | 66 | 19% |
| 25 | 22706.23113 | hypothetical protein | 57 | 18% |
| 26 | 15042.15680 | hypothetical protein (Nostoc phage A1) | 29 | 6% |
| 27 | 42619.43221 | hypothetical protein (Microcystis phage Me-ZS1) | 29 | 6% |
| 28 | 55094.57100 | DNA polymerase delta catalytic subunit | 19 | 1% |
| 29 | 3.722 | Thymidylate kinase (EC 2.7.4.9) | 19 | 7% |
| 30 | 20661.26102 | tail length tape-measure protein (Microcystis phage Me-ZS1) | 16 | 2% |
| 31 | 41382.41699 | hypothetical protein (Microcystis phage Me-ZS1) | 14 | 6% |
| 32 | 26900.27886 | tail tube protein (Microcystis phage Me-ZS1) | 13 | 4% |
References
- Gilbert, P.M. Eutrophication, harmful algae and biodiversity—Challenging paradigms in a world of complex nutrient changes. Mar. Pollut. Bull. 2017, 124, 591–606.
- Hu, X.; Zhang, R.; Ye, J.; Xu, X.; Zhang, Y.; Wu, C. Monitoring and research of microcystins and environmental factors in a typical artificial freshwater aquaculture pond. Environ. Sci. Pollut. Res. 2018, 25, 5921–5933.
- Harke, M.J.; Steffen, M.M.; Gobler, C.J.; Otten, T.G.; Wilhelm, S.W.; Wood, S.A.; Paerl, H.W. A review of the global ecology, genomics, and biogeography of the toxic cyanobacterium, Microcystis spp. Harmful Algae 2016, 54, 4–20.
- Chen, L.; Chen, J.; Zhang, X.; Xie, P. A review of reproductive toxicity of microcystins. J. Hazard. Mater. 2016, 301, 381–399.
- Suttle, C. Viruses in the sea. Nature 2005, 437, 356–361.
- Safferman, R.S.; Cannon, R.E.; Desjardins, P.R.; Gromov, B.V.; Haselkorn, R.; Sherman, L.A.; Shilo, M. Classification and nomenclature of viruses of cyanobacteria. Intervirology 1983, 19, 61–66.
- Mirzaei, M.K.; Eriksson, H.; Kasuga, K.; Haggård-Ljungquist, E.; Nilsson, A.S. Genomic, Proteomic, Morphological, and Phylogenetic Analyses of vB_EcoP_SU10, a Podoviridae Phage with C3 Morphology. PLoS ONE 2014, 10, e116294.
- Safferman, R.S.; Morris, M.E. Algal virus:isolation. Science 1963, 140, 679–680.
- Brussaard, C.; Wilhelm, S.W.; Thingstad, F.; Weinbauer, M.G.; Bratbak, G.; Heldal, M.; Kimmance, S.A.; Middelboe, M.; Nagasaki, K.; Paul, J.H.; et al. Global-scale processes with a nanoscale drive: The role of marine viruses. ISME J. 2008, 2, 575–578.
- Roux, S.; Brum, J.R.; Dutilh, B.E.; Sunagawa, S.; Duhaime, M.B.; Loy, A.; Poulos, B.T.; Solonenko, N.; Lara, E.; Poulain, J.; et al. Ecogenomics and potential biogeochemical impacts of globally abundant ocean viruses Ocean microbes drive biogeochemical cycling on a global scale. Nature 2016, 537, 689–693.
- Lin, W.; Li, D.F.; Sun, Z.T.; Tong, Y.; Yan, X.; Wang, C.; Zhang, X.; Pei, G. A novel freshwater cyanophage vB_MelS-Me-ZS1 infecting bloom-forming cyanobacterium Microcystis elabens. Mol. Biol. Rep. 2020, 47, 7979–7989.
- Jonge, P.A.; Nobrega, F.L.; Brouns, S.J.J.; Dutilh, B.E. Molecular and Evolutionary Determinants of Bacteriophage Host Range. Trends Microbiol. 2019, 27, 51–63.
- Silpe, J.E.; Bassler, B.L. A Host-Produced Quorum-Sensing Autoinducer Controls a Phage Lysis-Lysogeny Decision. Cell 2019, 176, 268–280.
- Yoshida, T.; Nagasaki, K.; Takashima, Y.; Shirai, Y.; Tomaru, Y.; Takao, Y.; Sakamoto, S.; Hiroishi, S.; Ogata, H. Ma-LMM01 infecting toxic Microcystis aeruginosa illuminates diverse cyanophage genome strategies. J. Bacteriol. 2008, 190, 1762–1772.
- Xia, H.; Li, T.; Deng, F.; Hu, Z. Freshwater cyanophages. Virol. Sin. 2013, 28, 253–259.
- Yoshida-Takashima, Y.; Yoshida, M.; Ogata, H.; Nagasaki, K.; Hiroishi, S.; Yoshida, T. Cyanophage infection in the bloom-forming cyanobacteria Microcystis aeruginosa in surface freshwater. Microbes Environ. 2012, 27, 350–355.
- Liu, X.; Kong, S.; Shi, M.; Fu, L. Genomic Analysis of Freshwater Cyanophage Pf-WMP3 Infecting Cyanobacterium Phormidium foveolarum: The Conserved Elements for a Phage. Microb. Ecol. 2008, 56, 671–680.
- Liu, X.; Shi, M.; Kong, S.; Gao, Y.; An, C. Cyanophage Pf-WMP4, a T7-like phage infecting the freshwater cyanobacterium Phormidium foveolarum: Complete genome sequence and DNA translocation. Virology 2007, 366, 28–39.
- Zhong, K.X.; Suttle, C.A.; Baudoux, A.C.; Derelle, E.; Colombet, J.; Cho, A.; Caleta, J.; Six, C.; Jacquet, S. A New Freshwater Cyanosiphovirus Harboring Integrase. Front. Microbiol. 2018, 9, 2204.
- Zhang, D.; You, F.; He, Y.; Shu, H.; Gin, Y. Isolation and Characterization of the First Freshwater Cyanophage Infecting Pseudanabaena. J. Virol. 2020, 94, e00682-20.
- Yang, F.; Jin, H.; Wang, X.; Li, Q.; Zhang, J.; Cui, N.; Jiang, Y.; Chen, Y.; Wu, Q.; Zhou, C.; et al. Genomic Analysis of Mic1 Reveals a Novel Freshwater Long-Tailed Cyanophage. Front. Microbiol. 2020, 11, 484.
- Xue, C.; Liu, X.; Wang, Q.; Lin, T.; Wang, M.; Liu, Q.; Shao, H.; Jiang, Y. The isolation and genome sequencing of a novel cyanophage S-H68 from the Bohai Sea, China. Mar. Genom. 2020, 53, 100739.
- Huang, L.; Liu, Q.; Liu, X.; Wang, Q.; Jiang, Y. Isolation and Complete Genome Sequence of a Novel Cyanophage S-B68. Curr. Microbiol. 2020, 77, 2385–2390.
- Sukenik, A.; Kaplan, A. Cyanobacterial Harmful Algal Blooms in Aquatic Ecosystems: A Comprehensive Outlook on Current and Emerging Mitigation and Control Approaches. Microorganisms 2021, 9, 1472.
- Paerl, H.W.; Fulton, R.S.; Moisander, P.H.; Dyble, J. Harmful freshwater algal blooms, with an emphasis on cyanobacteria. Sci. World J. 2001, 1, 76–113.
- Ulius, S.; Mazur-Marzec, H.; Vitonyt, I.; Kvederaviciute, K.; Holmfeldt, K. Insights into cyanophage-mediated dynamics of nodularin and other non-ribosomal peptides in Nodularia spumigena. Harmful Algae 2018, 78, 69–74.
- Eigemann, F.; Schwartke, M.; Schulz-Vogt, H. Niche separation of Baltic Sea cyanobacteria during bloom events by species interactions and autecological preferences. Harmful Algae 2018, 72, 65–73.
- Murata, K.; Zhang, Q.; Galaz-Montoya, J.G.; Fu, C.; Coleman, M.L.; Osburne, M.S.; Schmid, M.F.; Sullivan, M.B.; Chisholm, S.W.; Chiu, W. Visualizing Adsorption of Cyanophage P-SSP7 onto Marine Prochlorococcus. Sci. Rep. 2017, 7, 44176.
- Waldbauer, J.R.; Coleman, M.L.; Rizzo, A.I.; Campbell, K.L.; Zhang, L. Nitrogen sourcing during viral infection of marine cyanobacteria. Proc. Natl. Acad. Sci. USA 2019, 116, 15590–15595.
- Fridman, S.; Flores-Uribe, J.; Larom, S.; Alalouf, O.; Liran, O.; Yacoby, I.; Béjà, O. A myovirus encoding both photosystem I and II proteins enhances cyclic electron flow in infected Prochlorococcus cells. Nat. Microbiol. 2017, 2, 1350–1357.
- Wei, Y.; Xia, X. Unique Shine-Dalgarno Sequences in Cyanobacteria and Chloroplasts Reveal Evolutionary Differences in Their Translation Initiation. Genome Biol. Evol. 2019, 11, 3194–3206.
- Šulčius, S.; Šimoliūnas, E.; Alzbutas, G.; Gasiūnas, G.; Jauniškis, V.; Kuznecova, J.; Miettinen, S.; Nilsson, E.; Meškys, R.; Roine, E.; et al. Genomic Characterization of Cyanophage vB_AphaS-CL131 Infecting Filamentous Diazotrophic Cyanobacterium Aphanizomenon flos-aquae Reveals Novel Insights into Virus-Bacterium Interactions. Appl. Environ. Microbiol. 2019, 85, e01311-18.
- Maccoll, R. Allophycocyanin and energy transfer. Biochim. Biophys. Acta (BBA)-Bioenerg. 2004, 1657, 73–81.
- Jiang, T.; Zhang, J.P.; Chang, W.R.; Liang, D.C. Crystal structure of R-phycocyanin and possible energy transfer pathways in the phycobilisome. Biophys. J. 2001, 81, 1171–1179.
- Thornton, L.E.; Ohkawa, H.; Roose, J.L.; Kashino, Y.; Keren, N.; Pakrasi, H.B. Homologs of plant PsbP and PsbQ proteins are necessary for regulation of photosystem ii activity in the cyanobacterium Synechocystis 6803. Plant Cell 2004, 16, 2164–2175.
- Shi, L.X.; Schröder, W.P. The low molecular mass subunits of the photosynthetic supracomplex, photosystem II. Biochim. Biophys Acta 2004, 1608, 75–96.
- Kamiya, N.; Shen, J.R. Crystal structure of oxygen-evolving photosystem II from Thermosynechococcus vulcanus at 3.7-A resolution. Proc. Natl. Acad. Sci. USA 2003, 100, 98–103.
- Raymond, J.; Blankenship, R.E. The evolutionary development of the protein complement of photosystem 2. Biochim. Biophys. Acta (BBA)-Bioenerg. 2004, 1655, 133–139.
- Huang, G.; Xiao, Y.; Pi, X.; Zhao, L.; Zhu, Q.; Wang, W.; Kuang, T.; Han, G.; Sui, S.; Shen, J. Supplementary Information for Structural insights into a dimeric Psb27-photosystem II complex from a cyanobacterium Thermosynechococcus vulcanus.pdf. Proc. Natl. Acad. Sci. USA 2021, 118, e2018053118.
- Webber, A.N.; Malkin, R. Photosystem I reaction-centre proteins contain leucine zipper motifs. A proposed role in dimer formation. FEBS Lett. 1990, 264, 1–4.
- Panavas, T.; Pikula, A.; Reid, P.D.; Rubinstein, B.; Walker, E.L. Identification of senescence-associated genes from daylily petals. Plant Mol. Biol. 1999, 40, 237–248.
- Watson, H.C.; Walker, N.P.; Shaw, P.J.; Bryant, T.N.; Wendell, P.L.; Fothergill, L.A.; Perkins, R.E.; Conroy, S.C.; Dobson, M.J.; Tuite, M.F. Sequence and structure of yeast phosphoglycerate kinase. EMBO J. 1982, 1, 1635–1640.
- Tarnawski, M.; Krzywda, S.; Bialek, W.; Jaskolski, M.; Szxzepaniak, A. Structure of the RuBisCO chaperone RbcX from the thermophilic cyanobacterium Thermosynechococcus elongatus. Acta Cryst. Sect. F Struct. Biol. Cryst. Commun. 2011, 67, 851–857.
- Battchikova, N.; Zhang, P.; Rudd, S.; Ogawa, T.; Aro, E.M. Identification of NdhL and Ssl1690 (NdhO) in NDH-1L and NDH-1M complexes of Synechocystis sp. PCC 6803. J. Biol. Chem. 2005, 280, 2587–2595.
- Rumeau, D.; Bécuwe-Linka, N.; Beyly, A.; Louwagie, M.; Garin, J.; Peltier, G. New subunits NDH-M, -N, and -O, encoded by nuclear genes, are essential for plastid Ndh complex functioning in higher plants. Plant Cell 2005, 17, 219–232.
- Zhang, P.; Battchikova, N.; Paakkarinen, V.; Katoh, H.; Iwai, M.; Ikeuchi, M.; Pakrasi, H.; Ogawa, T.; Aro, E.M. Isolation, subunit composition and interaction of the NDH-1 complexes from Thermosynechococcus elongatus BP-1. Biochem. J. 2005, 390, 513–520.
- Wilkens, S.; Zhang, Z.; Zheng, Y. A structural model of the vacuolar ATPase from transmission electron microscopy. Micron 2005, 36, 109–126.
- Leyva, J.; Bianchet, M.A.; Amzel, L.M. Understanding ATP synthesis: Structure and mechanism of the F1-ATPase (Review). Mol. Membr. Biol. 2003, 20, 27–33.
- Mattevi, A.; Obmolova, G.; Kalk, K.H.; Westphal, A.H.; Kok, A.D.; Hol, W.G. Refined Crystal Structure of the Catalytic Domain of Dihydrolipoyl Transacetylase (E2p) from Azotobacter vinelandii at 2·6 Å Resolution. J. Mol. Biol. 1993, 230, 1183–1199.
- Maguire, B.A.; Zimmermann, R.A. The Ribosome in Focus. Cell 2001, 104, 813–816.
- Sanyal, S.C.; Liljas, A. The end of the beginning: Structural studies of ribosomal proteins. Curr. Opin. Struct. Biol. 2000, 10, 633–636.
- Chan, Y.L.; Suzuki, K.; Olvera, J.; Wool, I.G. Zinc finger-like motifs in rat ribosomal proteins S27 and S29. Nucleic Acids Res. 1993, 21, 649–655.
- Hertveldt, K.; Lavigne, R.; Pleteneva, E.; Sernova, N.; Kurochkina, L.; Korchevskii, R.; Robben, J.; Mesyanzhinov, V.; Krylov, V.N.; Volckaert, G. Genome comparison of pseudomonas aeruginosa large phages. J. Mol. Biol. 2005, 354, 536–545.
More
Information
Subjects:
Microbiology
Contributor
MDPI registered users' name will be linked to their SciProfiles pages. To register with us, please refer to https://encyclopedia.pub/register
:
View Times:
791
Revisions:
5 times
(View History)
Update Date:
15 Feb 2022
Table of Contents


Notice
You are not a member of the advisory board for this topic. If you want to update advisory board member profile, please contact office@encyclopedia.pub.
OK
Confirm
Only members of the Encyclopedia advisory board for this topic are allowed to note entries. Would you like to become an advisory board member of the Encyclopedia?
Yes
No
${ textCharacter }/${ maxCharacter }
Submit
Cancel
Back
Comments
${ item }
|
${ item.createdUser.fullName }
${ item.createdAt }
${ item.vote }
${ item.reply }
Delete
${ reply.createdUser.fullName }
${ reply.createdAt }
${ reply.vote }
Delete
There is no reply to this comment~
${ item.replyTextCharacter }/${ item.replyMaxCharacter }
Submit
Cancel
More
No more~
There is no comment~
${ textCharacter }/${ maxCharacter }
Submit
Cancel
${ selectedItem.replyTextCharacter }/${ selectedItem.replyMaxCharacter }
Submit
Cancel
Confirm
Are you sure to Delete?
Yes
No