 +1 credit
| Version | Summary | Created by | Modification | Content Size | Created at | Operation |
|---|---|---|---|---|---|---|
| 1 | Zhibo Gao | + 1458 word(s) | 1458 | 2022-01-20 07:10:50 | | | |
| 2 | Yvaine Wei | Meta information modification | 1458 | 2022-02-08 03:09:38 | | |
Video Upload Options
Heatwave events (HWEs) have strong impacts on human health, ecosystems, and sustainable social development. In the future, the increase in HWEs over the Yangtze River Basin (YRB) region is likely to be associated with the enhancement of the western-Pacific subtropical high (WPSH) and South-Asian high (SAH), and this enhancement was also greater under SSP585. The results from the high-resolution simulation of the RCM can provide an important reference for disaster prevention and mitigation in the future.
1. Introduction
Reliable weather and climate forecasts of Heatwave events (HWEs) are essential for risk mitigation and early-warning systems [1]. Most global climate models (GCMs), with resolutions from 100 km to 200 km, are generally good in capturing large-scale circulation [2][3][4], but they are not efficient enough to represent the fine-scale processes of the atmosphere, as well as the terrain and land-use distribution, which makes it difficult to accurately characterize regional HWEs [5][6][7][8]. Regional climate models (RCMs), with refined grid spacing and solid-model physics, can address the abovementioned problems associated with GCMs very well [9][10][11]. Several studies have indicated that RCMs are believed to provide more added value in their simulations with respect to GCMs [12][13][14][15]. Based on the above facts, it is important and meaningful to use RCMs to study the mechanisms and variation of HWEs in a certain area [16][17][18].
The Yangtze River Basin (YRB) is one of the core regions for the occurrence of HWEs in China [19]. A large number of studies have focused on how HWEs in this region are generated from the perspective of large-scale circulation anomalies [19][20], variability in the sea-surface temperature (SST) [21], and anomalous boundary characteristics in observational diagnostics [22]. Li, Xiao, and Zhao [20] suggested that the occurrence of HWEs is strongly associated with the joint effects of the western-Pacific subtropical high (WPSH) and the South-Asian high (SAH). In addition, Teng and Branstator [23] pointed out that the East-Asian jet stream (EAJS) can act as a waveguide to adjust the intensity and position of the WPSH through quasi-zonal teleconnections, which further influence the HWEs in the YRB region. It is also indicated that the strong SST anomaly over the mid-North Atlantic connects to the WPSH and East-Asian upper-level westerlies via the teleconnection wave train and can further contribute to the variability of HWEs over the YRB region [24].
2. Characteristics of HWEs in the Historical Period
3. Projection of HWEs
4. Conclusions
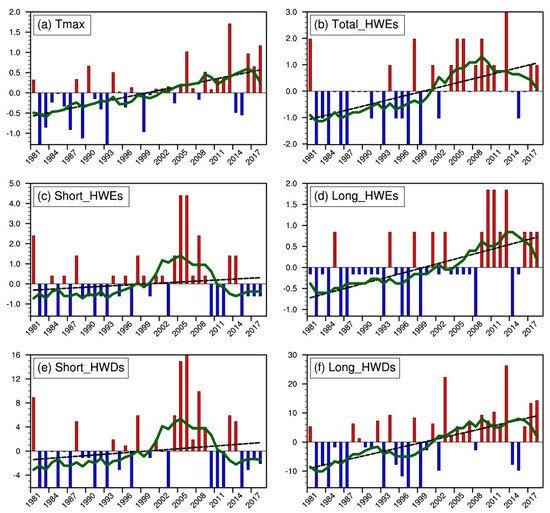
- During the 1981–2018 historical period, the Tmax, long-lived HWEs, and total HWEs in the YRB area all showed an obvious upward trend, and the turning point occurred in approximately 2000. Although the upward trend of short-lived HWEs was relatively small overall, there was a significant increase in certain regions, such as Henan, Sichuan, and the eastern coastal region. At the same time, the high incidence of long-lived HWEs was mainly concentrated in Hubei, Hunan, and eastern Sichuan provinces.
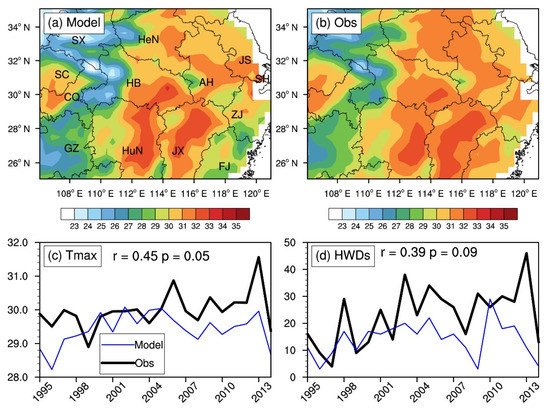
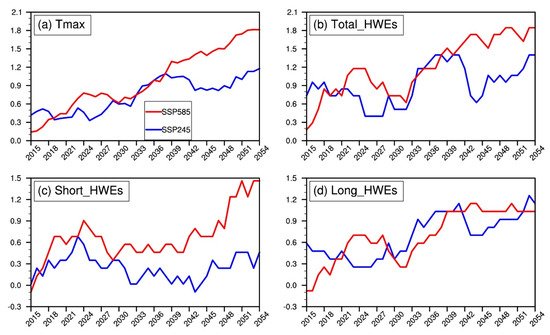
- Through the high-resolution simulation during the reference period, it was found that the WRF model can simulate the daily Tmax very well, which provides reliability for the projections. The projection results show that Tmax, long-lived HWEs, and total HWEs will increase obviously in both scenarios, and the upward trend of SSP585 is even greater. Short-lived HWEs will also increase under the SSP585 scenario, but they are relatively stable overall under SSP245. For SSP245, in the northern region, the daily Tmax will rise faster, and short-lived HWEs will increase, while the long-lived HWEs will rise significantly in the southern YRB. However, both short-lived and long-lived HWEs will increase in each subregion of the YRB under the SSP585 scenario.
- In both future scenarios, the geopotential heights at 500 hPa and 200 hPa over the YRB will increase, which may imply that both the WPSH and SAH will be enhanced, and this is more pronounced in the SSP585 scenario. Changes in the WPSH and SAH have an important impact on the HWEs of the YRB. The long-lived HWEs are caused by the joint effect of the WPSH and SAH, and this joint effect will also affect the short-lived HWEs under the SSP585 scenario. As mentioned in the fourth part, the detailed physical mechanism of the impact of geopotential height on HWEs still needs further study in the future.
References
- Yang, J.; Zhu, T.; Gao, M.; Lin, H.; Wang, B.; Bao, Q. Late-July barrier for subseasonal forecast of summer daily maximum temperature over Yangtze River Basin. Geophys. Res. Lett. 2018, 45, 12610–12615.
- Torres-Alavez, J.A.; Giorgi, F.; Kucharski, F.; Coppola, E.; Castro-García, L. ENSO teleconnections in an ensemble of CORDEX-CORE regional simulations. Clim. Dyn. 2021, 57, 1445–1461.
- Lin, L.; Gettelman, A.; Xu, Y.; Wu, C.; Wang, Z.; Rosenbloom, N.; Bates, S.C.; Dong, W. CAM6 simulation of mean and extreme precipitation over Asia: Sensitivity to upgraded physical parameterizations and higher horizontal resolution. Geosci. Model Dev. 2019, 12, 3773–3793.
- Anand, A.; Bhowmick, M.; Mishra, S.K.; Sahany, S.; Reddy Telukuntla, C.V. Response of Indian monsoon to increase of resolution in NCAR-CAM5. Atmos. Res. 2019, 221, 12–26.
- Yan, Y.; Tang, J.; Wang, S.; Niu, X.; Le, W. Uncertainty of land surface model and land use data on WRF model simulations over China. Clim. Dyn. 2021, 57, 1833–1851.
- Gao, Z.; Zhu, J.; Guo, Y.; Yan, X.; Wang, X.; Li, H.; Li, S. Comparison of different land-surface perturbation methods in short-range ensemble forecasts. Atmos. Ocean. Sci. Lett. 2021, 14, 100045.
- Kong, X.; Wang, A.; Bi, X.; Li, X.; Zhang, H. Effects of horizontal resolution on hourly precipitation in AGCM simulations. J. Hydrometeorol. 2020, 21, 643–670.
- Liang, X.-Z.; Sun, C.; Zheng, X.; Dai, Y.; Xu, M.; Choi, H.I.; Ling, T.; Qiao, F.; Kong, X.; Bi, X.; et al. CWRF performance at downscaling China climate characteristics. Clim. Dyn. 2018, 52, 2159–2184.
- Zhu, X.; Wei, Z.; Dong, W.; Ji, Z.; Wen, X.; Zheng, Z.; Yan, D.; Chen, D. Dynamical downscaling simulation and projection for mean and extreme temperature and precipitation over central Asia. Clim. Dyn. 2020, 54, 3279–3306.
- Tian, L.; Jin, J.; Wu, P.; Niu, G.-y.; Zhao, C. High-resolution simulations of mean and extreme precipitation with WRF for the soil-erosive Loess Plateau. Clim. Dyn. 2020, 54, 3489–3506.
- Cardoso, R.M.; Soares, P.M.M.; Miranda, P.M.A.; Belo-Pereira, M. WRF high resolution simulation of Iberian mean and extreme precipitation climate. Int. J. Clim. 2013, 33, 2591–2608.
- Yun, Y.; Liu, C.; Luo, Y.; Gao, W. Warm-season mesoscale convective systems over eastern China: Convection-permitting climate model simulation and observation. Clim. Dyn. 2021, 57, 3599–3617.
- Gao, Z.; Zhu, J.; Guo, Y.; Luo, N.; Fu, Y.; Wang, T. Impact of land surface processes on a record-Breaking rainfall event on May 06–07, 2017, in Guangzhou, China. J. Geophys. Res. Atmos. 2021, 126, e2020JD032997.
- Yun, Y.; Liu, C.; Luo, Y.; Liang, X.; Huang, L.; Chen, F.; Rasmmusen, R. Convection-permitting regional climate simulation of warm-season precipitation over Eastern China. Clim. Dyn. 2019, 54, 1469–1489.
- Guo, Z.; Fang, J.; Sun, X.; Yang, Y.; Tang, J. Sensitivity of summer precipitation simulation to microphysics parameterization over Eastern China: Convection-permitting regional climate simulation. J. Geophys. Res. Atmos. 2019, 124, 9183–9204.
- Kong, X.; Wang, A.; Bi, X.; Wang, D. Assessment of temperature extremes in China using RegCM4 and WRF. Adv. Atmos. Sci. 2019, 36, 363–377.
- Fita, L.; Polcher, J.; Giannaros, T.M.; Lorenz, T.; Milovac, J.; Sofiadis, G.; Katragkou, E.; Bastin, S. CORDEX-WRF v1.3: Development of a module for the weather research and forecasting (WRF) model to support the CORDEX community. Geosci. Model Dev. 2019, 12, 1029–1066.
- Yu, E.; Sun, J.; Chen, H.; Xiang, W. Evaluation of a high-resolution historical simulation over China: Climatology and extremes. Clim. Dyn. 2014, 45, 2013–2031.
- Qi, X.; Yang, J.; Gao, M.; Yang, H.; Liu, H. Roles of the tropical/extratropical intraseasonal oscillations on generating the heat wave over Yangtze River valley: A numerical study. J. Geophys. Res. Atmos. 2019, 124, 3110–3123.
- Li, N.; Xiao, Z.; Zhao, L. A recent increase in long-lived heatwaves in China under the joint influence of South Asia and Western North Pacific subtropical highs. J. Clim. 2021, 34, 7167–7179.
- Yang, K.; Zhang, J.; Wu, L.; Wei, J. Prediction of summer hot extremes over the middle and lower reaches of the Yangtze River valley. Clim. Dyn. 2018, 52, 2943–2957.
- Gao, M.; Wang, B.; Yang, J.; Dong, W. Are peak summer sultry heat wave days over the Yangtze–Huaihe River Basin predictable? J. Clim. 2018, 31, 2185–2196.
- Teng, H.; Branstator, G. Tropospheric waveguide teleconnections and their seasonality. J. Atmos. Sci. 2017, 74, 1513–1532.
- Sun, J. Record-breaking SST over mid-North Atlantic and extreme high temperature over the Jianghuai–Jiangnan region of China in 2013. Chin. Sci. Bull. 2014, 59, 3465–3470.

