 +1 credit
| Version | Summary | Created by | Modification | Content Size | Created at | Operation |
|---|---|---|---|---|---|---|
| 1 | Maria Duhagon | + 2695 word(s) | 2695 | 2022-01-19 04:23:43 | | | |
| 2 | Yvaine Wei | + 12 word(s) | 2707 | 2022-01-29 03:07:41 | | |
Video Upload Options
Prostate cancer is a major health problem worldwide. MiR-183 is an oncomiR and a candidate biomarker in prostate cancer, affecting various pathways responsible for disease initiation and progression. Overall, cell adhesion was uncovered as a major pathway controlled by miR-183 in prostate cancer, and ITGB1 was identified as a relevant mediator of this effect.
1. Introduction
2. Expression of MiR-183 Is Increased in Tumor Tissue and Associates with Worse Clinical Features in PrCa
| Cohort | Clinical Parameter | Conditions Compared | Ratio between Conditions | p-Value |
|---|---|---|---|---|
| MSKCC | Tissue type | Primary tumor vs. Normal | 3.3 ± 2.4 | <0.0001 |
| Metastasis vs. Normal | 5.3 ± 4.1 | <0.0001 | ||
| PSA at diagnosis | High vs. Low | 1.5 ± 1.1 | 0.0182 | |
| Preoperative PSA | High vs. Low | 2.5 ± 1.9 | <0.0001 | |
| Time until recurrence (month) | Shorter vs. Longer | 1.3 ± 1.9 | 0.0195 | |
| PRAD-TCGA | Tissue type | Primary tumor vs. Normal | 4.3 ± 3.0 | <0.0001 |
| Biochemical recurrence | YES vs. NO | 1.3 ± 1.1 | 0.0404 | |
| Clinical T | T3-T4 vs. T1-T2 | 1.5 ± 1.3 | 0.0020 | |
| Gleason Score | 8-9-10 vs. 6-7 | 1.4 ± 1.0 | <0.0001 | |
| Pathologic N | N1 vs. N0 | 1.3 ± 0.9 | 0.0030 |
3. Overexpression of MiR-183 in Prostate Cells Causes a Decrease in Cell Adhesion In Vitro
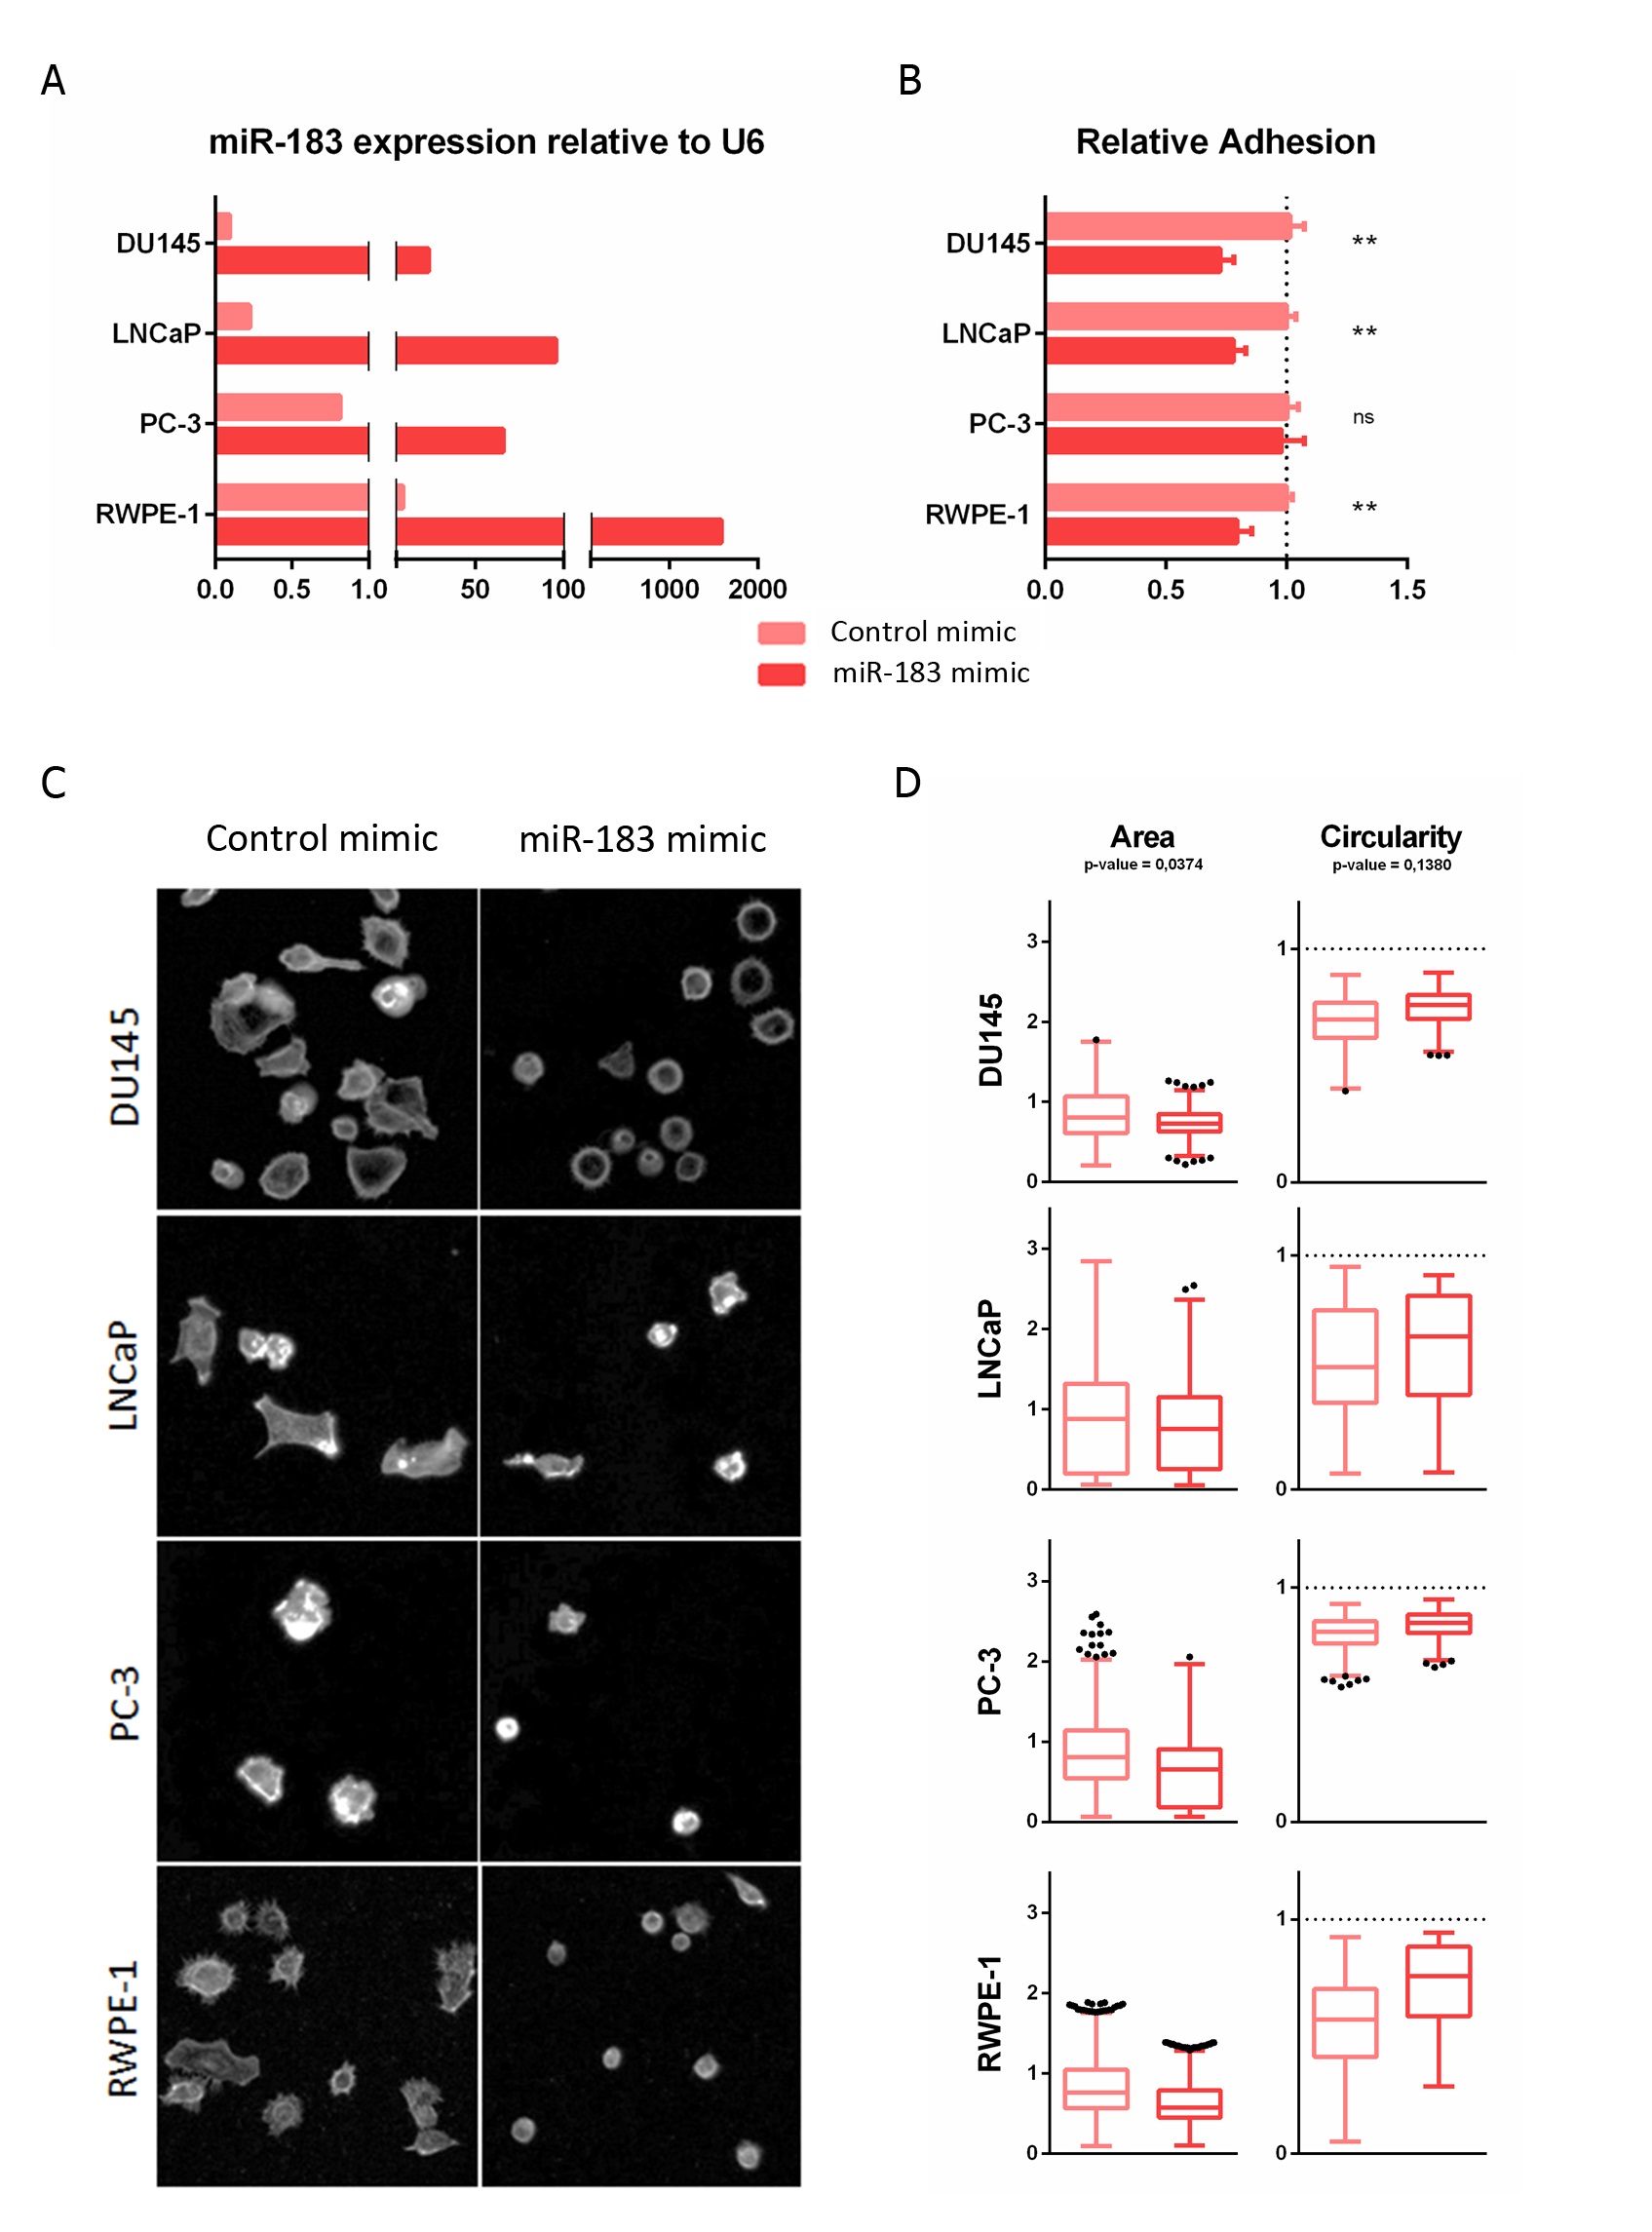
The modulation of miR-183 expression after transfection was confirmed by qRT-PCR (Figure 1A). Quantitatively, miR-183-overexpressing DU145, LNCaP and RWPE-1 cells showed statistically significant decreases in adhesion, to 0.73 ± 0.06 (27%), 0,78 ± 0.05 (22%) and 0.79 ± 0.06 (21%), respectively, relative to the control cells (p-value < 0.01), while overexpressing PC-3 cells showed no significant change in adhesion relative to control cells in this experimental condition (Figure 1B). Since adhesion is a complex process, involving not only cell receptors binding to substrate ligands but also the modulation of intracellular signaling and the cytoskeleton, this entry sought to analyze the morphological spreading during adhesion by microscopic visualization of the actin cytoskeleton using phalloidin staining (Figure 1C). After 3 h of seeding, the overexpression of miR-183 produced a decrease in the area (p-value = 0.0374) and a tendency to increase the circularity (p-value = 0.1380) of the cells relative to the control transfected cells (Figure 1D). Therefore, both the quantitative and qualitative results were consistent with a reduction of the ability of the cells to adhere to the plate surface.
4. ITGB1 Regulation by MiR-183 May by Mediated by a Direct Interaction with the ITGB1 3′UTR in Prostate Cancer
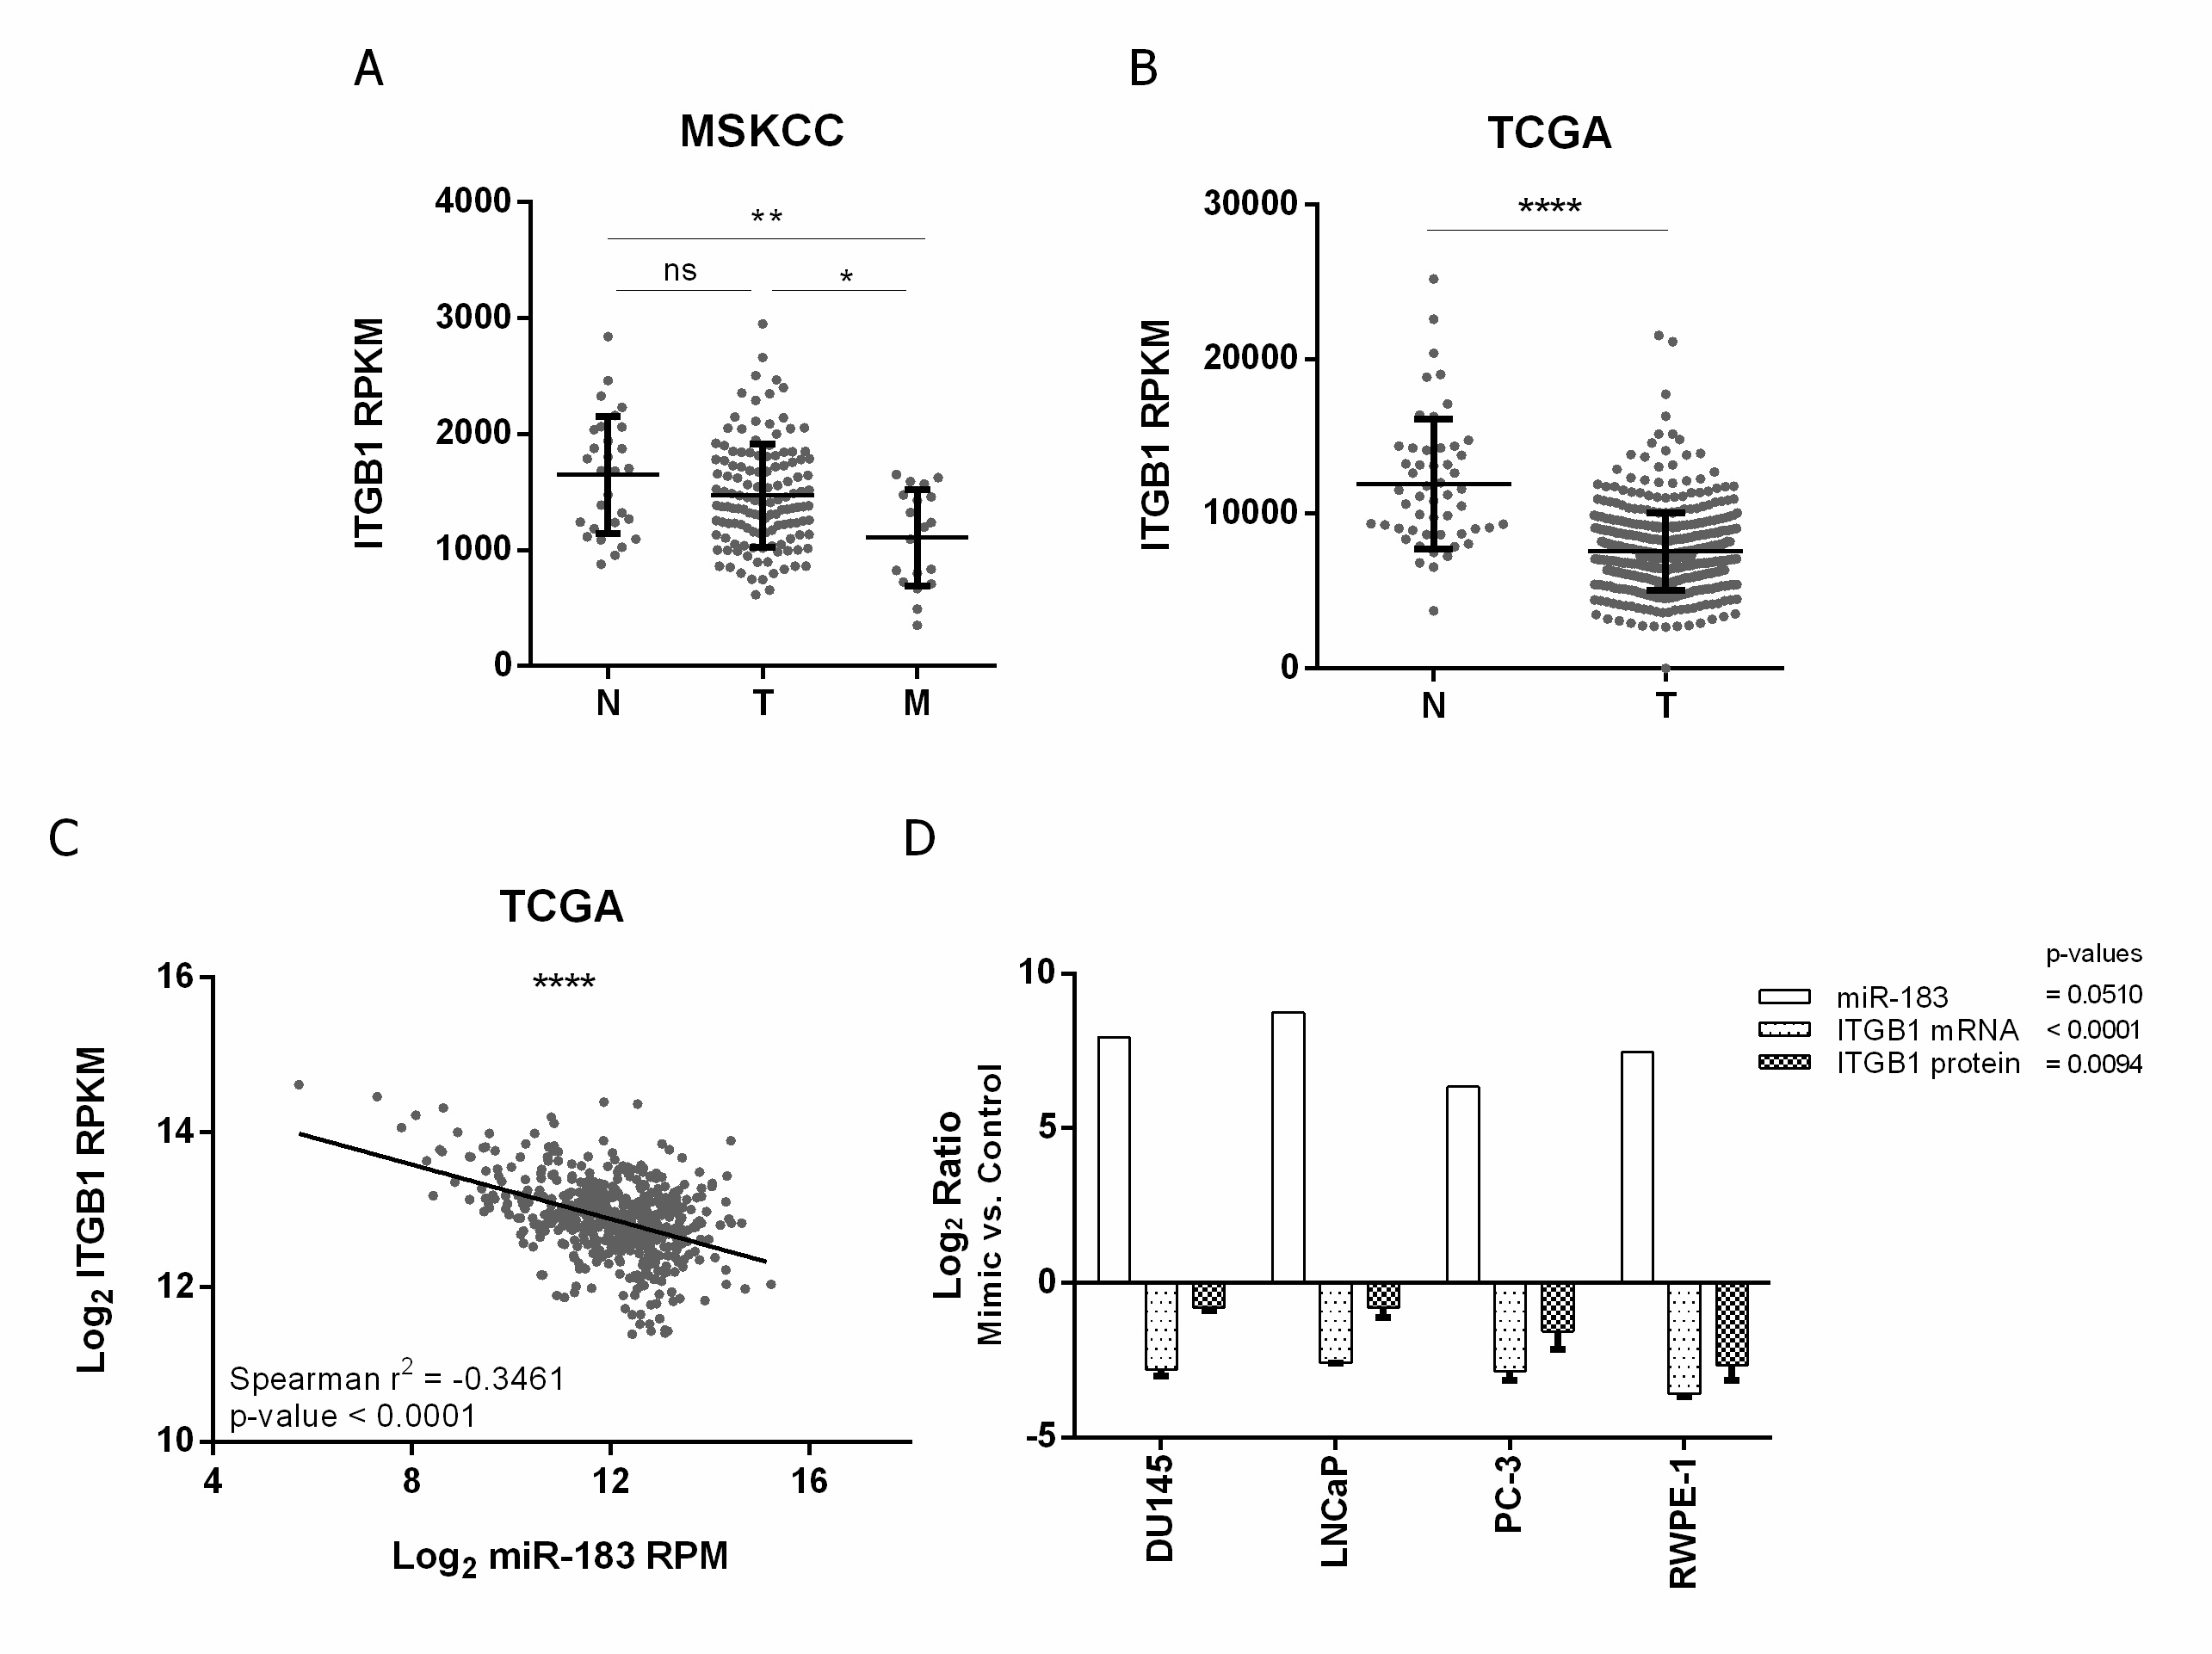
Figure 2. Expression of ITGB1 and its association with miR-183 expression in PrCa. (A,B) association of ITGB1 mRNA expression (RPKM) with tissue status in the MSKCC [28] and PRAD-TCGA cohorts, respectively. N = normal, T = primary tumor, M = metastatic tissue. A Mann–Whitney test was applied to assess the statistical significance of the difference between conditions. (C) Correlation between ITGB1 mRNA (Log2 RPKM) and miR-183 (Log2 RPM) expression in metastatic, primary tumor and normal tissue samples from the PRAD-TCGA project, evaluated by a Spearman correlation test. (D) Effect of miR-183 on ITGB1 expression in four PrCa cell lines. Cells were transfected with 20 nM of miR-183 mimic or control RNA. MiR-183 (normalized to RNAU6) and ITGB1 mRNA (normalized to BACT and GAPDH) levels (2−∆∆CT) were assessed by RT-qPCR 72 h after transfection in 2 technical replicates per cell line. ITGB1 protein levels (mean fluorescence intensity) were assessed by flow cytometry 72 h after transfection in at least three independent experiments per cell line. The results of the ratio between miR-183 mimic and control are shown as Log2. A paired t-test was performed considering the four cell lines as biological replicates to assess the statistical significance between conditions. p-value * <0.05, ** <0.01, **** <0.0001, ns = not significant.
To confirm the negative effect of miR-183 on ITGB1 expression in vitro, ITGB1′s mRNA and protein levels were quantified after the forced overexpression of miR-183 in normal and tumor prostate cell lines relative to the control RNA. The mRNA level of ITGB1 decreased 0.1 ± 0.0 (Log2 −2.8, 90%) in DU145, 0.2 ± 0.0 (Log2 −2.6, 80%) in LNCaP, 0.1 ± 0.0 (Log2 −2.9, 90%) in PC-3 and 0.1 ± 0.0 (Log2 3.6, 90%) in RWPE-1 upon miR-183 mimic transfection (p-value < 0.0001). Accordingly, the protein level of ITGB1, measured by flow cytometry with an anti-ITGB1 antibody, was significantly reduced to 0.6 ± 0.0 (Log2 −0.8, 40%) in DU145, 0.6 ± 0.1 (Log2 −0.8, 40%) in LNCaP, 0.4 ± 0.1 (Log2 −1.6, 60%) in PC-3 and 0.2 ± 0.1 (Log2 −2.7, 80%) in RWPE-1 (p-value = 0.0094) (Figure 2D).
The entry next sought to investigate if this repressive effect is due to a direct sequence-specific complementary interaction between ITGB1 mRNA and miR-183 in the prostate tissue. It was initially visualized that the mapping distribution of AGO-PAR-CLIP reads containing the 6-mer miR-183 complementary site along the 3′UTR of the ITGB1 gene from Hamilton et al. [19]. TargetscanHuman [20] predicts three sites for miR-183 in the 3′UTR of ITGB1: a 7merm8 site conserved among vertebrates (position 623–629 nt), an 8-mer site poorly conserved among vertebrates (position 1012–1019 nt) and a 6-mer site (position 83–87 nt). The most covered region of the ITGB1 3′ UTR bearing the 6-mer site complementary to the miR-183 seed in the AGO-PAR-CLIP dataset of PrCa cell lines turned out to be the 7merm8 binding site of miR-183 conserved among vertebrates (GUGCCAU) (Figure 3A). The T-C transition identified in that AGO footprint occurs in 38% of the reads at the U base of ITGB1 transcript, corresponding with position 9 of the miRNA (unpaired), consistent with the characteristics of the PAR-CLIP reads of prototypical miRNA interaction sites (which occur at U positions between the 8 and 13th 5’of the interaction site [21]). This mapping pattern supports a direct interaction of miR-183 on this ITGB1 seed site in prostate cells. Thus, a 140 bp region of the ITGB1 3´UTR comprising this site was cloned into a luciferase reporter plasmid (Figure 3A) and mutations in the 7merm8 conserved putative binding site were introduced for miR-183 (Figure 3B). The luciferase activity of the wild type (wt) ITGB1 3′UTR was significantly reduced to 0.73 when miR-183 was overexpressed by transfection in RWPE-1 cells compared to the transfection of a control RNA (p-value < 0.001). Furthermore, the mutation of three nucleotides in the putative binding site of miR-183 caused a partial loss of this repression to 0.85 (44% recovery, p-value < 0.05) (Figure 3C).
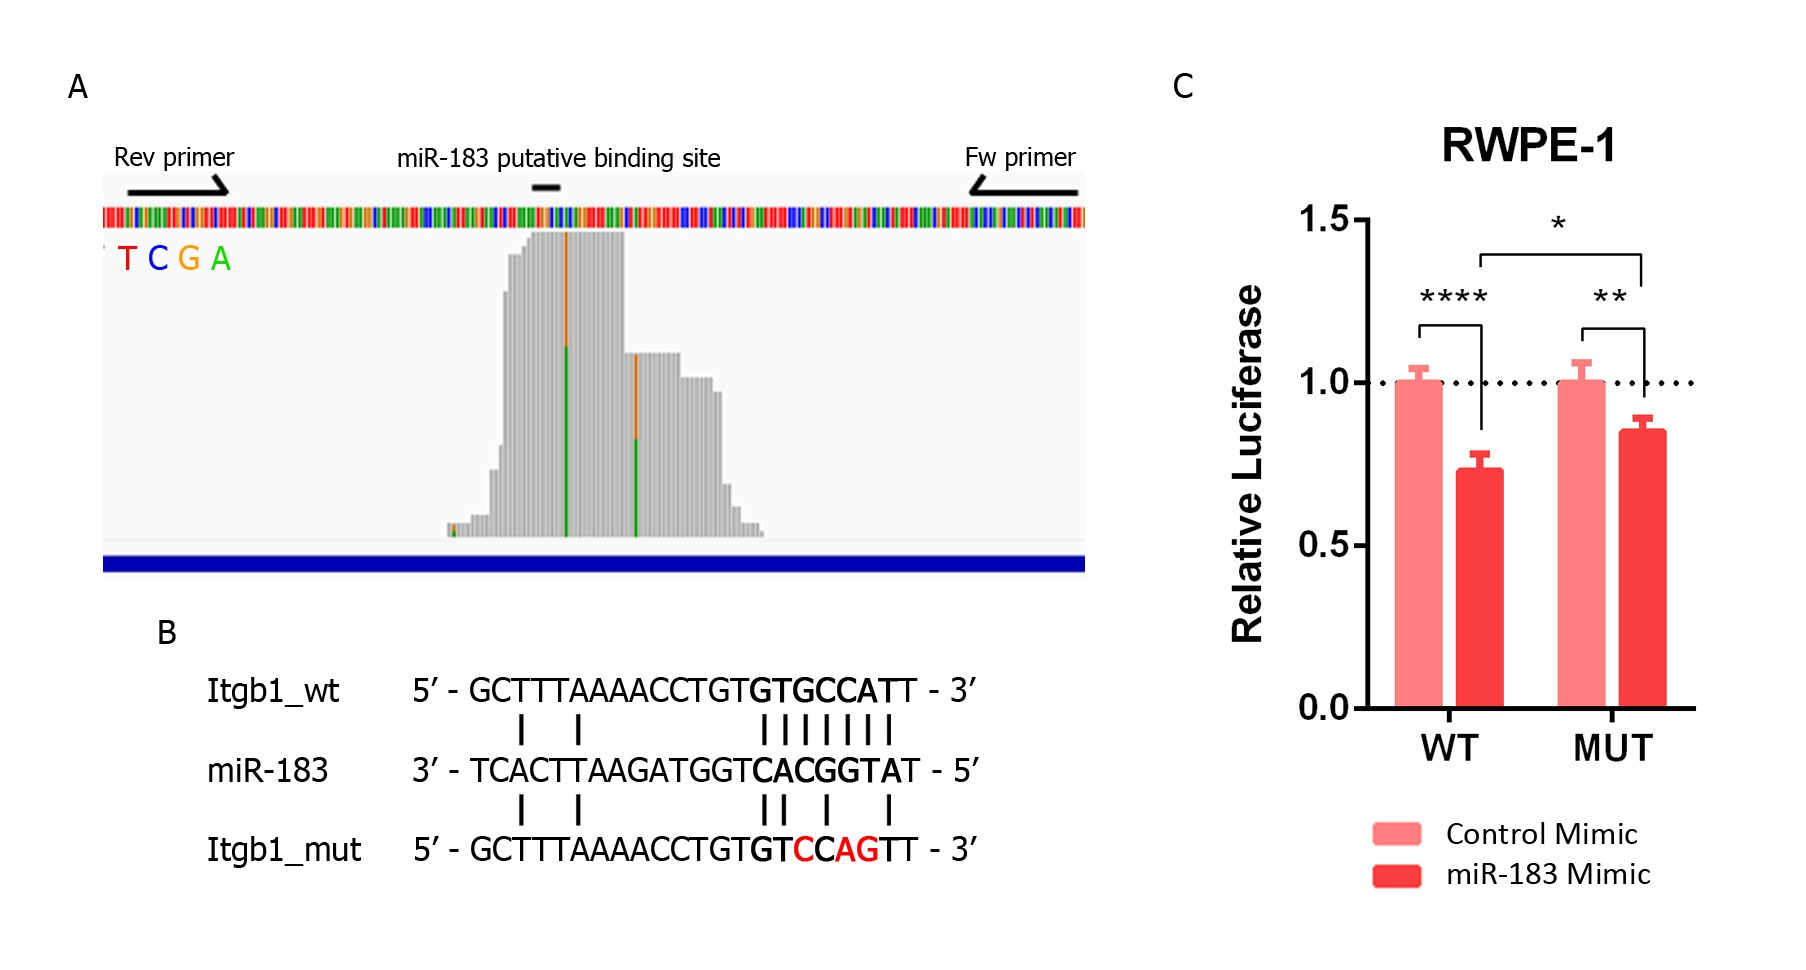
Figure 3. Validation of the direct miR-183 and ITGB1 mRNA interaction in PrCa. (A) Mapping of prostate cell line reads along the putative binding site of miR-183 on ITGB1′s 3′UTR extracted from AGO-PAR-CLIP RNA-seq data [31]. The base identity is represented by four colors, as indicated. Perfect base matches and mismatches (due to base substitutions caused by the photoactivatable ribonucleoside crosslinking) are represented as gray and colored bars, respectively. Forward and reverse primers used to clone the miR-183 binding site of the ITGB1 3′UTR in pmiRGLO are indicated by arrows. The image is a modified screenshot of the IGV Software [42]. (B) Base pairing between miR-183 and the conserved miR-183 putative binding site on ITGB1 wild type and mutated 3′UTR cloned in pmirGLO for reporter gene assays. (C) Reporter gene assay using pmiRGLO, bearing the region of the 3′UTR of ITGB1 with the miR-183 wild type or mutated site, co-transfected with miR-183 mimic or control RNA in the RWPE-1 cell line. Luciferase activity was measured 48 h after transfection. The mean ± SD of four independent experiments is shown. A two-way ANOVA was applied to test the statistical significance of the differences between conditions. p-value * <0.05, ** <0.01, **** <0.0001.
Overall, the results indicate that a negative regulation of ITGB1 by miR-183 may be operative in prostate cancer patient tissue, as well as in cell lines, and might contribute to prostate cancer biology.
5. The Inhibition of Cell Adhesion Provoked by miR-183 May Be Due to a Reduction of Focal Adhesions Mediated by ITGB1 Downregulation
Aiming to evaluate if the modulation of cell adhesion caused by miR-183 (Figure 2) is mediated by ITGB1, this work first incubated untransfected prostate cells with a monoclonal antibody against ITGB1 known to block cell adhesion [22], or an antibody against the nuclear transcription factor TWIST as a control, and measured cell adhesion to the cell culture plate. A decrease in cell adhesion of 0.43 ± 0.05 (57%) in DU145, 0.76 ± 0.06 (24%) in PC-3 and 0.66 ± 0.09 (34%) in RWPE-1 was observed (Figure 4A), resembling the effect of miR-183 overexpression. LNCaP cells did not change cell adhesion under these experimental conditions (Figure 4A). These results indicate that ITGB1 blockade produces a similar effect to miR-183 overexpression in this experimental setting, making it a suitable mediator of the miR-183 adhesive phenotype.
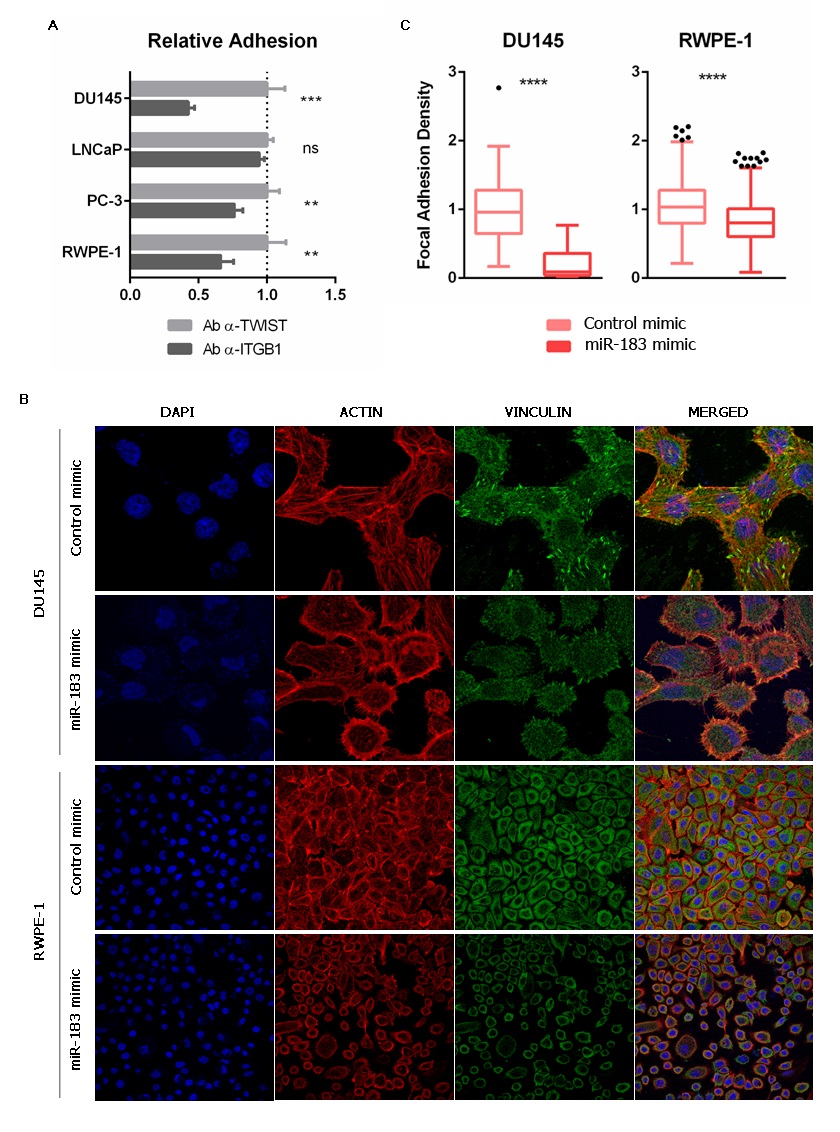
Figure 4. Effect of miR-183 on the number of focal adhesions. (A) Effect of ITGB1 blockade on cell adhesion. Untransfected cells were incubated with an antibody against ITGB1 (ab24693 Abcam) or TWIST (ab50887 Abcam), seeded on polystyrene 96-well plates and allowed to adhere for 0.5 or 1 h (depending on the cell line). Non-adherent cells were removed, and the remaining cells were quantified using CellTiter-Glo (Promega). The results of at least three independent replicates were normalized to the control and are shown as means ± SD. An unpaired t-test was applied to assess the statistical significance of the difference between conditions. (B) Immunocytochemistry of vinculin of prostate cells overexpressing miR-183. Seventy-two hours after transfection of 20 nM of miR-183, the cells were fixed, permeabilized and immunostained for vinculin using an Alexa Fluor 488-conjugated secondary antibody. Nuclei and filamentous actin were counterstained with DAPI and phalloidin-Alexa Fluor 568, respectively. The images were collected on a confocal microscope using a 63X oil immersion objective. Scale bars show 25 μm. Representative images are shown. (C) Effect of miR-183 on focal adhesion density. Quantification of focal adhesions per cell in vinculin immunocytochemical images of the DU145 and RWPE-1 cell lines. Images were processed using ImageJ. A Mann–Whitney test was applied to test the statistical significance of the difference between conditions. p-value ** <0.01, *** <0.001, **** <0.0001.
The interaction between the ECM and the integrins results in the assembly of specialized structures called focal adhesions (FA). They are highly specialized domains of the plasma membrane, consisting of clusters of integrins that form the closest contact with matrix proteins on the extracellular side, and represent the sites where converging actin filaments terminate and interact with integrins on the cytoplasmic side [23]. A variety of biological process involving changes in cell contractility require a change in the number and distribution of focal adhesions [24]. Interestingly, one of the most common integrins found in focal adhesions is α5β1 [25]. Considering that miR-183 and ITGB1 have opposite effects on cell adhesion and meet criteria for a miRNA/target RNA pair, the entry then investigated if miR-183 affects the number of the focal adhesions in the prostate cell line models. For this purpose, the entry measured FA using an antibody against the scaffold focal adhesion protein vinculin in DU145 and RWPE-1 cells overexpressing miR-183, employing identical conditions as those of the experiments shown in Figure 2. Indeed, a decrease was found in the number of FA per cell in cells overexpressing miR-183 relative to those overexpressing the control RNA (Figure 4B,C). This observation suggests that miR-183-mediated reduction of cell adhesion could be due to a reduction of the focal adhesions, which is consistent with a downregulation of ITGB1.
6. Conclusions
The entry have confirmed the oncogenic expression pattern of miR-183 in the largest PrCa cohorts publicly available (and in South American patients), and found positive associations with clinical parameters that were not yet reported (PSA prior to radical prostatectomy, shorter time until recurrence, biochemical recurrence, clinical T stage and pathologic N status). Therein, a positive association was also found between miR-183 expression and PSA at diagnosis and biopsy, pathologic Gleason Score and pathological T stage, that has been reported before [3][4]. Cell attachment, spreading assays and focal adhesion quantification of miR-183-overexpressing cells confirmed the predicted reduction in cell adhesion. ITGB1 was validated as a major target of repression by miR-183 as well as a mediator of cell adhesion in response to miR-183. The reporter gene assay and PAR-CLIP read mapping suggest that ITGB1 may be a direct target of miR-183. The negative correlation between miR-183 and ITGB1 expression in prostate cancer cohorts supports their interaction in the clinical set. Overall, cell adhesion was uncovered as a major pathway controlled by miR-183 in prostate cancer, and ITGB1 was identified as a relevant mediator of this effect.
References
- Xu, S.; Witmer, P.D.; Lumayag, S.; Kovacs, B.; Valle, D. MicroRNA (MiRNA) Transcriptome of Mouse Retina and Identification of a Sensory Organ-Specific MiRNA Cluster. J. Biol. Chem. 2007, 282, 25053–25066.
- Cao, D.; Di, M.; Liang, J.; Shi, S.; Tan, Q.; Wang, Z. MicroRNA-183 in Cancer Progression. J. Cancer 2020, 11, 1315–1324.
- Li, D.; Hao, X.; Song, Y. Identification of the Key MicroRNAs and the MiRNA-MRNA Regulatory Pathways in Prostate Cancer by Bioinformatics Methods. Biomed Res. Int. 2018, 2018, 6204128.
- Ueno, K.; Hirata, H.; Shahryari, V.; Deng, G.; Tanaka, Y.; Tabatabai, Z.L.; Hinoda, Y.; Dahiya, R. MicroRNA-183 Is an Oncogene Targeting Dkk-3 and SMAD4 in Prostate Cancer. Br. J. Cancer 2013, 108, 1659–1667.
- Schaefer, A.; Jung, M.; Mollenkopf, H.-J.; Wagner, I.; Stephan, C.; Jentzmik, F.; Miller, K.; Lein, M.; Kristiansen, G.; Jung, K. Diagnostic and Prognostic Implications of MicroRNA Profiling in Prostate Carcinoma. Int. J. Cancer 2009, 126, 1166–1176.
- Waseem, M.; Ahmad, M.K.; Serajuddin, M.; Bhaskar, V.; Sankhwar, S.N.; Mahdi, A.A. MicroRNA-183-5p: A New Potential Marker for Prostate Cancer. Indian J. Clin. Biochem. 2019, 34, 207–212.
- Martens-Uzunova, E.S.; Jalava, S.E.; Dits, N.F.; Van Leenders, G.J.L.H.; Møller, S.; Trapman, J.; Bangma, C.H.; Litman, T.; Visakorpi, T.; Jenster, G. Diagnostic and Prognostic Signatures from the Small Non-Coding RNA Transcriptome in Prostate Cancer. Oncogene 2012, 31, 978–991.
- Katz, B.; Reis, S.T.; Viana, N.I.; Morais, D.R.; Moura, C.M.; Dip, N.; Silva, I.A.; Iscaife, A.; Srougi, M.; Leite, K.R.M. Comprehensive Study of Gene and MicroRNA Expression Related to Epithelial-Mesenchymal Transition in Prostate Cancer. PLoS ONE 2014, 9, e113700.
- Gao, W.; Lin, S.; Cheng, C.; Zhu, A.; Hu, Y.; Shi, Z.; Zhang, X.; Hong, Z. Long Non-Coding RNA CASC2 Regulates Sprouty2 via Functioning as a Competing Endogenous RNA for MiR-183 to Modulate the Sensitivity of Prostate Cancer Cells to Docetaxel. Arch. Biochem. Biophys. 2019, 665, 69–78.
- Hua, X.; Liu, Z.; Zhou, M.; Tian, Y.; Zhao, P.P.; Pan, W.H.; Li, C.X.; Huang, X.X.; Liao, Z.X.; Xian, Q.; et al. LSAMP-AS1 Binds to MicroRNA-183–5p to Suppress the Progression of Prostate Cancer by up-Regulating the Tumor Suppressor DCN. EBioMedicine 2019, 50, 178–190.
- Mihelich, B.L.; Khramtsova, E.A.; Arva, N.; Vaishnav, A.; Johnson, D.N.; Giangreco, A.A.; Martens-Uzunova, E.; Bagasra, O.; Kajdacsy-Balla, A.; Nonn, L. MiR-183-96-182 Cluster Is Overexpressed in Prostate Tissue and Regulates Zinc Homeostasis in Prostate Cells. J. Biol. Chem. 2011, 286, 44503–44511.
- Paziewska, A.; Mikula, M.; Dabrowska, M.; Kulecka, M.; Goryca, K.; Antoniewicz, A.; Dobruch, J.; Borowka, A.; Rutkowski, P.; Ostrowski, J. Candidate Diagnostic MiRNAs That Can Detect Cancer in Prostate Biopsy. Prostate 2018, 78, 178–185.
- Song, C.J.; Chen, H.; Chen, L.Z.; Ru, G.M.; Guo, J.J.; Ding, Q.N. The Potential of MicroRNAs as Human Prostate Cancer Biomarkers: A Meta-Analysis of Related Studies. J. Cell. Biochem. 2018, 119, 2763–2786.
- Larne, O.; Martens-Uzunova, E.; Hagman, Z.; Edsjö, A.; Lippolis, G.; Den Berg, M.S.V.V.; Bjartell, A.; Jenster, G.; Ceder, Y. MiQ—A Novel MicroRNA Based Diagnostic and Prognostic Tool for Prostate Cancer. Int. J. Cancer 2013, 132, 2867–2875.
- Dai, Y.; Gao, X. Inhibition of Cancer Cell-Derived Exosomal MicroRNA-183 Suppresses Cell Growth and Metastasis in Prostate Cancer by Upregulating TPM1. Cancer Cell Int. 2021, 21.
- Dambal, S.; Baumann, B.; McCray, T.; Williams, L.T.; Richards, Z.; Deaton, R.; Prins, G.S.; Nonn, L. The MiR-183 Family Cluster Alters Zinc Homeostasis in Benign Prostate Cells, Organoids and Prostate Cancer Xenografts. Sci. Rep. 2017, 7, 7704.
- Taylor, B.S.; Schultz, N.; Hieronymus, H.; Gopalan, A.; Xiao, Y.; Carver, B.S.; Arora, V.K.; Kaushik, P.; Cerami, E.; Reva, B.; et al. Integrative Genomic Profiling of Human Prostate Cancer. Cancer Cell 2010, 18, 11–22.
- Moro, L.; Dolce, L.; Cabodi, S.; Bergatto, E.; Erba, E.B.; Smeriglio, M.; Turco, E.; Retta, S.F.; Giuffrida, M.G.; Venturino, M.; et al. Integrin-Induced Epidermal Growth Factor (EGF) Receptor Activation Requires c-Src and P130Cas and Leads to Phosphorylation of Specific EGF Receptor Tyrosines. J. Biol. Chem. 2002, 277, 9405–9414.
- Hamilton, M.P.; Rajapakshe, K.I.; Bader, D.A.; Cerne, J.Z.; Smith, E.A.; Coarfa, C.; Hartig, S.M.; McGuire, S.E. The Landscape of MicroRNA Targeting in Prostate Cancer Defined by AGO-PAR-CLIP. Neoplasia 2016, 18, 356–370.
- Agarwal, V.; Bell, G.W.; Nam, J.W.; Bartel, D.P. Predicting Effective MicroRNA Target Sites in Mammalian MRNAs. Elife 2015, 4, e05005.
- Hafner, M.; Landthaler, M.; Burger, L.; Khorshid, M.; Hausser, J.; Berninger, P.; Rothballer, A.; Ascano, M.; Jungkamp, A.C.; Munschauer, M.; et al. Transcriptome-Wide Identification of RNA-Binding Protein and MicroRNA Target Sites by PAR-CLIP. Cell 2010, 141, 129–141.
- Schnapp, L.M.; Hatch, N.; Ramos, D.M.; Klimanskaya, I.V.; Sheppard, D.; Pytela, R. The Human Integrin A8β1 Functions as a Receptor for Tenascin, Fibronectin, and Vitronectin. J. Biol. Chem. 1995, 270, 23196–23202.
- Berrier, A.L.; Yamada, K.M. Cell–Matrix Adhesion. J. Cell. Physiol. 2007, 213, 565–573.
- Kuo, J.-C. Focal Adhesions Function as a Mechanosensor. Mechanotransduction 2014, 126, 55–73.
- Zhong, X.; Rescorla, F.J. Cell Surface Adhesion Molecules and Adhesion-Initiated Signaling: Understanding of Anoikis Resistance Mechanisms and Therapeutic Opportunities. Cell. Signal. 2012, 24, 393–401.


