Your browser does not fully support modern features. Please upgrade for a smoother experience.
Submitted Successfully!
 +1 credit
Thank you for your contribution! You can also upload a video entry or images related to this topic.
For video creation, please contact our Academic Video Service.
| Version | Summary | Created by | Modification | Content Size | Created at | Operation |
|---|---|---|---|---|---|---|
| 1 | Seung Gyun Choi | + 2800 word(s) | 2800 | 2022-01-19 09:05:23 | | | |
| 2 | Jessie Wu | -3 word(s) | 2797 | 2022-01-28 10:24:33 | | | | |
| 3 | Jessie Wu | -3 word(s) | 2797 | 2022-01-28 10:27:09 | | | | |
| 4 | Jessie Wu | -3 word(s) | 2797 | 2022-01-28 10:28:05 | | |
Video Upload Options
We provide professional Academic Video Service to translate complex research into visually appealing presentations. Would you like to try it?
Cite
If you have any further questions, please contact Encyclopedia Editorial Office.
Choi, S.G. Consumption Behavior of Single-Member Households in Vietnam. Encyclopedia. Available online: https://encyclopedia.pub/entry/18954 (accessed on 27 May 2026).
Choi SG. Consumption Behavior of Single-Member Households in Vietnam. Encyclopedia. Available at: https://encyclopedia.pub/entry/18954. Accessed May 27, 2026.
Choi, Seung Gyun. "Consumption Behavior of Single-Member Households in Vietnam" Encyclopedia, https://encyclopedia.pub/entry/18954 (accessed May 27, 2026).
Choi, S.G. (2022, January 28). Consumption Behavior of Single-Member Households in Vietnam. In Encyclopedia. https://encyclopedia.pub/entry/18954
Choi, Seung Gyun. "Consumption Behavior of Single-Member Households in Vietnam." Encyclopedia. Web. 28 January, 2022.
Copy Citation
Food-consumption value (FCV) is a main determinant of food-consumption behavior. Value is a key factor in understanding social phenomena and, even when people are not conscious of the value, our behavior is influenced by individual values.
Vietnam
home meal replacement (HMR)
1. Introduction
These rapid social and economic changes in terms of urbanization and shrinking household size have also contributed to the growth of the home meal replacement (HMR) market [1][2][3][4], with the Vietnamese HMR market especially being expected to grow further. In Vietnam’s HMR-related market, the growth of the convenience store market, which is the main purchase channel for HMR, and the contraction of the traditional market, are in line with increased income levels due to urbanization and the emergence of young consumers [5].
Vietnam has a background in HMR market growth and has been selected as a country where Southeast Asian companies locate if they want to further advance as part of the growth of the global HMR market [6]. However, although the HMR market in Vietnam is expected to grow significantly, studies of its likely composition and size are limited. In particular, there are practically no studies on the food-consumption value of HMR in Vietnam and relevant purchase behaviors, including the actions of single-member households [7]. For example, the relationships between personal value, marketing attitude, trust in nutrients, and convenience-food-store use [8]; and the impact on the attitude and purchase intention of Korean ginseng products [9] should be analyzed.
Vietnam society has a complex mix of values due to its diverse ethnic composition and colonial history, which are expected to affect FCV and behavior. When targeting overseas markets, it is essential to define product concepts and prepare marketing strategies that reflect the product needs of local people, based on product safety, legality, and fairness. Furthermore, understanding the food-consumption-related values that consumers have can play an important role in setting marketing directions and devising strategies for the food industry, thus providing an opportunity to secure a competitive advantage in the market [10].
2. Descriptive Statistics
The characteristics of the research targets are presented in Table 1.
Table 1. General characteristics of subjects.
| Category | Item | N (%) |
|---|---|---|
| Gender | Male | 125 (50.0) |
| Female | 125 (50.0) | |
| Age | 19–24 | 62 (24.8) |
| 25–29 | 64 (25.6) | |
| 30–34 | 62 (24.8) | |
| 35 or above | 62 (24.8) | |
| Marital status | Single | 246 (98.4) |
| Separated | 4 (1.6) | |
| Education | High school graduate or lower | 55 (22.0) |
| Junior college graduate | 32 (12.8) | |
| University graduate | 152 (60.8) | |
| Graduate student or higher | 11 (4.4) | |
| Occupation | Self-employed | 33 (13.2) |
| Labor staff | 39 (15.6) | |
| Professional practice | 158 (63.2) | |
| Student | 20 (8.0) | |
| Monthly income (100,000 VND) (100,000 VND = $4.4) |
45~<75 | 72 (28.8) |
| 75~<150 | 99 (39.6) | |
| 150~<300 | 54 (21.6) | |
| 300~<450 | 17 (6.8) | |
| 450≤ | 8 (3.2) | |
| Total | 250 (100.0) | |
Regarding gender, 50% of the respondents were men and 50% women. In terms of age, there were groups aged 19–24 (62 people, 24.8%), 25–29 (64 people, 25.6%), 30–34 (62 people, 24.8%), and 35 or older (62 persons, 24.8%). Regarding marital status, 246 people (98.4%) were single, i.e., the majority. As for the level of education, 73.6% of the respondents had college or university education, while, in terms of occupation, 158 people had professional occupations (63.2%), 39 people had blue-collar jobs (i.e., labor staff) (15.6%), and 26 people were self-employed (10.4%). The income levels are as follows: 99 people earned between 7,500,000 and 14,000,000 VND (39.6%), 72 earned 4,500,000–7,499,999 VND (28.8%), and 54 people earned 15,000,000–29,999,999 VND (21.6%).
3. Categorization of Food-Consumption Value
The results of factor and reliability analyses for the categorization of FCV are presented in Table 2. The varimax rotation method was used, and the number of factors was based on an eigenvalue of ≥1.0. As a result of applying a factor loading of 0.5 or higher to secure validity, 10 items with a lower factor loading were excluded from the total of 46. Eight factors were finally derived, with a total of 36 items, and the total variance explanatory power was 70.68%. Cronbach’s α values for all factors were 0.7 or above, indicating high reliability.
Table 2. Cluster classification based on the FCV of single-member households in Vietnam (mean ± SD).
| Cluster | Cluster 1 Pursuing-Simplicity-and-Convenience Type (n = 90) |
Cluster 2 Considering-Multiple-Options Type (n = 113) |
Cluster 3 Pursuing-Family-Safety Type (n = 47) |
Total | F-Value | |
|---|---|---|---|---|---|---|
| Factor | ||||||
| Family | 4.44 ± 1.37 b | 6.08 ± 0.69 a | 6.03 ± 0.68 a | 5.48 ± 1.26 | 78.13 *** | |
| Health | 4.96 ± 1.29 b | 5.81 ± 1.02 a | 4.17 ± 1.35 c | 5.19 ± 1.34 | 34.41 *** | |
| Price and Product | 5.94 ± 1.06 | 5.96 ± 1.09 | 6.02 ± 0.77 | 5.96 ± 1.02 | 0.11 | |
| Time | 4.43 ± 1.54 a | 4.90 ± 1.65 a | 3.50 ± 1.54 b | 4.47 ± 1.66 | 12.91 *** | |
| Package | 4.92 ± 1.10 b | 5.82 ± 0.85 a | 5.23 ± 1.03 b | 5.39 ± 1.06 | 21.83 *** | |
| Safety | 6.13 ± 1.01 | 6.30 ± 0.71 | 6.45 ± 0.55 | 6.27 ± 0.81 | 2.52 | |
| Convenience | 5.67 ± 1.14 b | 6.14 ± 0.68 a | 4.43 ± 1.33 c | 5.65 ± 1.18 | 48.46 *** | |
| Situation | 5.49 ± 1.27 a | 5.62 ± 1.14 a,b | 5.11 ± 1.40 b | 5.48 ± 1.25 | 2.80 | |
Note: *** p < 0.001. A seven-point scale was used (1 = strongly disagree, and 7 = strongly agree). a,b,c Differences in the same row are significantly different when Scheffe’s test is used.
A cluster analysis was performed by setting eight FCV factor scores obtained from the factor analysis as a reference variable. As a result of using the K-means clustering method, it was desirable to classify them into three groups; the characteristics of each cluster were examined through the average values of the factor scores per group and the central points of each cluster.
Cluster 1 regarded time and situational values as being more important than Cluster 3, while showing the second-highest value among the three clusters in terms of convenience value. For this reason, it was named pursuing-simplicity-and-convenience type. Cluster 2 considered health, packaging design, and convenience value important, and, compared to other clusters, it put more weight on family values than the pursuing-simplicity-and-convenience cluster and indicated a higher time value than Cluster 3. As for food consumption, as the cluster appeared to consider diverse factors in general, it was named the considering-multiple-options type. Finally, Cluster 3 put more weight on family values than the cluster pursuing simplicity and convenience. Although there was no significant difference, this indicated that they thought the highest value was in safety, and this was named the pursuing-family-safety type accordingly.
4. Comparison of Preference by HMR Type and by Cluster
As a result of analyzing the preferences by dividing the HMR types into RTE, RTH, RTC, and RTP, the preference for RTH was 5.74 (1 = not preferred at all, and 7 = very much preferred), and the preference for RTE was 5.71. In terms of the differences in the preferences for each HMR type by cluster, the cluster pursuing simplicity and convenience and that considering multiple options showed a statistically significantly higher preference for RTH than the cluster pursuing family safety; the cluster considering multiple options presented a statistically significantly higher preference for RTC than the other clusters. In addition, the pursuing-family-safety-type cluster indicated a statistically significantly higher preference for RTP compared to the pursuing-simplicity-and-convenience-type cluster.
4.4. Importance of HMR Selection Attributes
Analyzing HMR selection attributes by using a seven-point Likert scale (1, as not important at all, to 7, as very important) shows that items such as taste (6.25), quality (6.36), expiration date (6.36), sanitation (6.29), nutrients (6.06), and freshness (6.07) have high levels of importance. When analyzing the differences by cluster, the remaining items, except for taste, quality, diversity, quantity, price, sanitation, and ease of storage, have statistically significant differences.
The multiple-options cluster had statistically significantly higher average values than the pursuing-simplicity-and-convenience and pursuing-family-safety clusters in all items except for expiration date. In terms of each item of selection attributes, the importance of texture (6.02), packaging (5.81), organic (6.08), and preparation process (6.10) attributes is significantly higher statistically in the cluster considering multiple options, compared to other groups. In addition, the considering-multiple-options-type cluster showed a statistically significantly higher importance than the cluster pursuing simplicity and convenience in items such as additives (6.01), ingredients (5.66), brand (5.97), production methods (6.04), nutrients (6.26), and freshness (6.25).
The cluster pursuing family safety showed a statistically significantly higher average value than other groups in the item of expiration date (6.57) and a statistically significantly higher average value than the pursuing-simplicity-and-convenience type for nutrients (6.26). The pursuing-simplicity-and-convenience types showed a statistically significantly lower average value than considering-multiple-options types in all items, except for preparation time (5.80).
5. Performance of HMR Selection Attributes
As a result of analyzing the importance of HMR selection attributes, again using a seven-point Likert scale (1, not satisfied at all, to 7, very satisfied), items such as taste (6.18), quality (6.28), expiration date (6.26), and sanitation (6.15) showed a high level of performance. However, packaging (5.61), organic (5.61), production (5.65), additives (5.72), and texture (5.76) showed a low level of performance. As a result of analyzing the differences by cluster for the performance of HMR selection attributes, there was no statistically significant difference between clusters in the quality, diversity, quantity, and price items, but there was a statistically significant difference between clusters in the remaining performance items. The multiple-options-type cluster showed statistically significantly higher performance than other groups in the items of additives (6.14), packaging (6.01), organic (6.01), preparation (6.04), and production (5.99) methods.
Furthermore, the cluster containing multiple-options types showed statistically significantly higher performance for taste (6.35), ingredients (6.11), and total (6.08) compared to the ones pursuing simplicity and convenience. In terms of expiration date and sanitation, the cluster pursuing family safety showed significantly higher performance statistically than the one pursuing simplicity and convenience. The pursuing-simplicity-and-convenience-type cluster showed statistically significantly lower performance than the others for items such as ease of storage (5.61), nutrients (5.48), and freshness (5.57). For the preparation-time item, the cluster considering multiple options showed significantly higher performance statistically than the one pursuing family safety. In terms of branding, the cluster considering multiple options indicated a statistically significant higher performance than the one pursuing simplicity and convenience.
6. Analysis of Differences between the Importance and Performance of HMR Selection Attributes
As a result of analyzing the difference between the importance and performance of HMR selection attributes, among the total of 19 items, the cluster pursuing simplicity and convenience had 17 items with positive values, the one considering multiple options had 11 items, and the one pursuing family safety had 14 items (Table 3). This pattern means that overall performance was lower than importance. Among the HMR selection attributes, there was a significant difference in the variation between importance and performance by cluster for taste and ease of storage. In the taste item, the cluster pursuing simplicity and convenience showed a larger difference between importance and performance than other groups; as it indicated a positive value, the satisfaction level was lower than its importance. For the ease-of-storage item, the multiple-options cluster showed a greater difference between importance and performance than the other two groups. In addition, since the value of the ease-of-storage item in the cluster considering multiple options was negative, its performance was higher than its importance. Nevertheless, as the pursuing-simplicity-and-convenience group showed a positive value in terms of the difference between importance and performance in the ease of storage item, improvement is required to increase the performance of the ease-of-storage variable.
Table 3. Analysis of differences between importance and performance of HMR selection attributes (mean ± SD).
| Category | Pursuing-Simplicity-and-Convenience Type | Considering-Multiple-Options Type | Pursuing-Family-Safety Type | Total | F-Value |
|---|---|---|---|---|---|
| Taste | 0.26 ± 0.77 a | −0.03 ± 0.67 b | −0.06 ± 0.60 b | 0.07 ± 0.71 | 5.10 ** |
| Quality | 0.23 ± 0.98 | −0.03 ± 0.85 | 0.02 ± 0.94 | 0.08 ± 0.92 | 2.11 |
| Texture | −0.12 ± 0.72 | −0.08 ± 0.98 | 0.02 ± 1.26 | −0.08 ± 0.96 | 0.35 |
| Diversity | 0.11 ± 0.83 | −0.09 ± 0.88 | −0.17 ± 1.03 | −0.03 ± 0.90 | 1.95 |
| Quantity | 0.10 ± 0.97 | 0.08 ± 0.84 | 0.00 ± 1.20 | 0.07 ± 0.96 | 0.17 |
| Price | −0.09 ± 1.15 | 0.04 ± 0.76 | 0.09 ± 1.25 | 0.00 ± 1.01 | 0.58 |
| Additives | 0.11 ± 0.99 | −0.13 ± 0.75 | 0.13 ± 1.23 | 0.00 ± 0.95 | 2.18 |
| Ingredients | 0.16 ± 1.03 | 0.11 ± 0.83 | 0.28 ± 1.04 | 0.16 ± 0.94 | 0.54 |
| Expiration date | 0.08 ± 0.88 | 0.12 ± 0.71 | 0.06 ± 0.92 | 0.10 ± 0.81 | 0.13 |
| Packaging | 0.01 ± 0.99 | −0.19 ± 0.82 | −0.26 ± 1.15 | −0.13 ± 0.95 | 1.66 |
| Organic | 0.06 ± 0.89 | 0.07 ± 0.82 | 0.13 ± 1.85 | 0.08 ± 1.10 | 0.07 |
| Brand | −0.01 ± 0.70 | −0.02 ± 0.98 | −0.06 ± 1.07 | −0.02 ± 0.90 | 0.06 |
| Preparation process | 0.07 ± 0.98 | 0.06 ± 0.77 | −0.02 ± 1.29 | 0.05 ± 0.96 | 0.15 |
| Preparation time | 0.01 ± 0.95 | 0.04 ± 0.76 | 0.26 ± 1.33 | 0.07 ± 0.96 | 1.09 |
| Sanitation | 0.24 ± 0.88 | 0.08 ± 0.79 | 0.09 ± 0.86 | 0.14 ± 0.84 | 1.10 |
| Production methods | 0.09 ± 0.91 | 0.04 ± 0.86 | 0.21 ± 1.40 | 0.09 ± 1.00 | 0.47 |
| Ease of storage | 0.12 ± 0.79 b | −0.17 ± 0.77 a | 0.00 ± 1.02 a,b | −0.03 ± 0.84 | 3.12 * |
| Nutrients | 0.24 ± 0.85 | 0.05 ± 0.84 | 0.15 ± 0.81 | 0.14 ± 0.84 | 1.30 |
| Freshness | 0.23 ± 1.01 | 0.09 ± 1.03 | −0.09 ± 1.08 | 0.11 ± 1.03 | 1.51 |
Note: * p < 0.05 and ** p < 0.01. a,b Differences in the same row are significantly different by Scheffe’s test.
7. IPA of Importance and Performance of HMR Selection Attributes
The importance-performance analysis of the HMR selection attribute items was conducted via the IPA technique, which places the results in a grid diagram. For the effective evaluation of each item, scores from 1 to 7 were given to both importance and performance, and the evaluation results are presented as shown in Figure 1, Figure 2 and Figure 3 [11]. To create the IPA grid, the average values of the importance attributes were placed on the y-axis, and the average values of the performance attributes on the x-axis; the points of contact were selected and placed in four quadrants, using the importance and performance scores of each attribute.
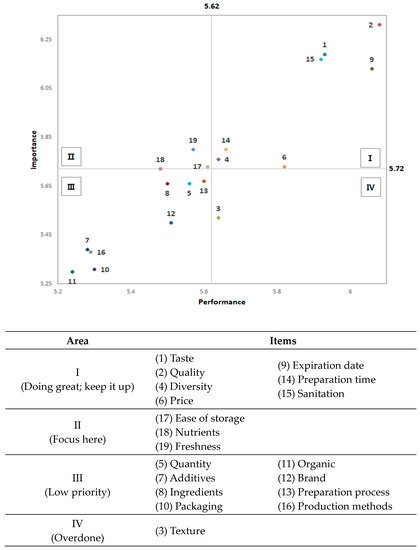
Figure 1. IPA analysis of HMR selection attributes of the cluster pursuing simplicity and convenience.
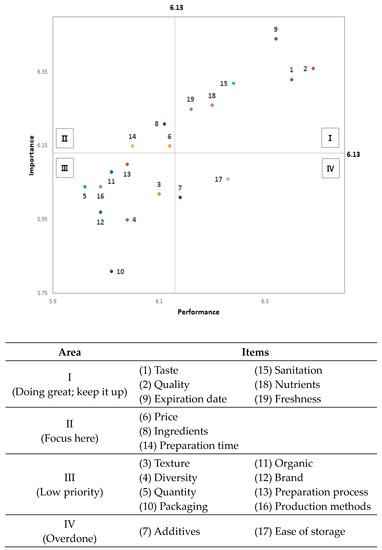
Figure 2. IPA analysis of HMR selection attributes of the cluster considering multiple options.
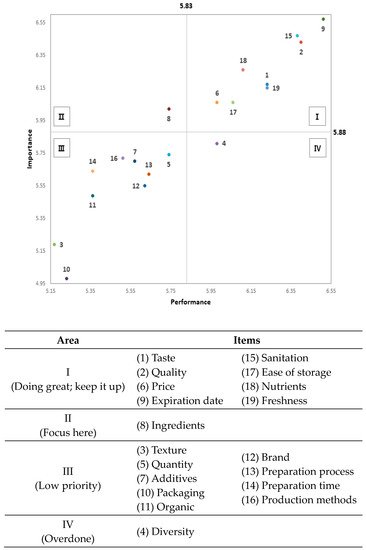
Figure 3. IPA analysis of HMR selection attributes of the cluster pursuing family safety.
The data on the pursuing-simplicity-and-convenience cluster showed that, in the first quadrant, both importance and performance were higher than average, and the current status can be maintained. This includes the following items: taste, quality, diversity, price, expiration date, preparation time, and sanitation. In the second quadrant, which had high importance but low performance, the following items were included: ease of storage, nutrients, and freshness. The items evaluated as having low importance and performance were quantity, additives, ingredients, packaging, organic, brand, preparation process, and production methods and are found in the third quadrant. The texture item belongs in the fourth quadrant, which is an area with low importance but high performance.
In the group considering multiple options, the first quadrant, in which both importance and performance were higher than average and the current status can be maintained, included items such as taste, quality, expiration date, sanitation, nutrients, and freshness. The items to be improved in the future are shown in the second quadrant, which has high importance but low performance: price, ingredients, and preparation time. On the other hand, the items evaluated as having low importance and performance were found in the third quadrant: texture, diversity, quantity, packaging, organic, brand, preparation process, and production methods. Additives and ease of storage belonged to the fourth quadrant, with low importance but high performance.
In the cluster pursuing family safety, the first quadrant has both importance and performance higher than average—meaning the current status can be maintained—and included the following items: taste, quality, price, expiration date, sanitation, ease of storage, nutrients, and freshness. In the second quadrant, with high importance but low performance, meaning further improvement is required, ingredients were included. The items evaluated as having low importance and performance were found in the third quadrant: texture, quantity, additives, packaging, organic, brand, preparation process, preparation time, and production methods. The diversity item belonged in the fourth quadrant, with low importance but high performance.
As for the differences by cluster in the second quadrant, which requires improvement due to its high importance but low performance, the ease-of-storage item was included due to the characteristics of the pursuing-simplicity-and-convenience type group. Since nutrients and freshness also belonged to the second quadrant, the key factors of food exerted a strong influence on selection attributes, even if the cluster preferred simple and convenient products. As for the other two clusters, ingredients were included in the second quadrant. The two groups were concerned about the health and safety of the family, but, because of the nature of HMR products, it is difficult to precisely identify the ingredients in some products; this means that there should be measures put in place to improve performance by improving reliability on this issue.
8. Demand for HMR Product Development
As a result of analyzing the demand for HMR product development by using a seven-point scale (1 = not desired at all, and 7 = highly desired), the following items showed high demand for product development: reinforced nutrients (6.23), eco-friendliness (6.03), various menus (5.93), organic (5.89), calorie control (5.82), premium (5.79), meal kit (5.72), and small packaging (5.58) (Table 4).
Table 4. Demand for HMR product development (mean ± SD).
| Category | Pursuing-Simplicity-and-Convenience Type | Considering-Multiple-Options Type | Pursuing-Family-Safety Type | Total | F-Value |
|---|---|---|---|---|---|
| Reinforced nutrients | 6.01 ± 1.10 | 6.36 ± 0.82 | 6.32 ± 1.05 | 6.23 ± 0.98 | 3.54 |
| Eco-friendly | 5.71 ± 1.12 b | 6.26 ± 0.85 a | 6.09 ± 1.21 a,b | 6.03 ± 1.05 | 7.13 * |
| Various menus | 5.70 ± 1.13 | 6.07 ± 0.84 | 6.04 ± 1.14 | 5.93 ± 1.02 | 3.72 |
| Organic | 5.50 ± 1.11 b | 6.21 ± 0.86 a | 5.87 ± 1.23 a,b | 5.89 ± 1.08 | 11.97 *** |
| Calorie control | 5.47 ± 1.20 b | 6.15 ± 0.77 a | 5.70 ± 1.20 b | 5.82 ± 1.07 | 11.48 *** |
| Dried food | 5.63 ± 1.15 b | 6.09 ± 0.80 a | 5.51 ± 1.43 b | 5.82 ± 1.09 | 6.92 * |
| Premium | 5.40 ± 1.21 b | 6.04 ± 0.95 a | 5.96 ± 1.12 a | 5.79 ± 1.12 | 9.31 *** |
| Meal kit | 5.36 ± 1.14 b | 6.10 ± 0.89 a | 5.49 ± 1.35 b | 5.72 ± 1.13 | 13.17 *** |
| Small packaging | 5.34 ± 1.15 b | 6.01 ± 0.90 a | 5.02 ± 1.60 b | 5.58 ± 1.21 | 15.31 *** |
| Low sugar | 4.96 ± 1.21 b | 5.95 ± 1.03 a | 5.28 ± 1.44 b | 5.46 ± 1.26 | 18.36 *** |
| Low-sodium | 4.92 ± 1.17 b | 5.91 ± 1.00 a | 5.19 ± 1.41 b | 5.42 ± 1.23 | 19.79 *** |
| Functional | 4.91 ± 1.14 b | 5.81 ± 0.92 a | 5.40 ± 1.50 a | 5.41 ± 1.19 | 15.84 *** |
| Low-calorie | 5.00 ± 1.38 b | 5.88 ± 1.18 a | 4.94 ± 1.97 b | 5.39 ± 1.49 | 12.50 *** |
| Therapeutic diet | 4.68 ± 1.23 b | 5.72 ± 0.99 a | 4.96 ± 1.40 b | 5.20 ± 1.25 | 21.35 *** |
Note: * p < 0.05 and *** p < 0.001. A seven-point scale was used (1 = strongly unwanted, and 7 = strongly wanted). a,b Differences in the same row are significantly different using Scheffe’s test.
As a result of analyzing the differences in the demand for HMR product development by cluster, no statistically significant difference was found between clusters for reinforced nutrients and various menus. However, the demand for products with reinforced nutrients was 6.23 out of 7.0, which showed the highest average value, while the item of various menus (5.93) indicated the third-highest demand value among the total items; thus, HMR product development should focus on reinforced nutrients and diversity.
There was a statistically significant difference in demand per cluster for all items, except for those of reinforced nutrients and various menus. The cluster considering multiple options showed a higher average value than the other groups in all items with statistically significant differences. This indicates that the overall demand for HMR product development is high. As for the differences by detailed items, the cluster considering multiple options showed a statistically significant higher demand for the following items than the other clusters: calorie control (6.15), dried food (6.09), meal kit (6.10), small packaging (6.01), low sugar (5.95), low sodium (5.91), low-calorie (5.88), and therapeutic diet (5.72).
Furthermore, the group considering multiple options indicated a statistically significant higher demand for the following items, compared to the group pursuing simplicity and convenience: eco-friendly (6.26) and organic products (6.21). However, this cluster showed an overall lower average value in the demand for product development, compared to other groups; in particular, the demand for premium (5.40) and functional (4.91) products was significantly lower statistically.
9. Summary
When segmenting the market for single-person households, the focus should be on convenience. The pursuing-simplicity-and-convenience type in this study showed a tendency to prefer products with high convenience, while they were reluctant to put a lot of labor into preparing and organizing meals in their HMR consumption behavior. In addition, they demanded improvement in the ease of storage. While the considering-multiple-options type took care of several factors, along with convenience, when consuming HMR, the pursuing-family-safety type did not consider convenience as important compared to other groups. Convenience is thus a major influence on food consumption, due to the hectic daily life of modern people [12][13]. Accordingly, convenience orientation can be the most effective criterion among market segmentation factors.
References
- Buckley, M.; Cowan, C.; McCarthy, M. The convenience food market in Great Britain: Convenience food lifestyle (CFL) segments. Appetite 2007, 49, 600–617.
- Hwang, J.S.; Yoon, Y.J.; Kim, H.J. The effects of product reliability on brand image, repurchase intention, and word-of-mouth in the context of home meal replacement: The moderating role of the manufacturer type. Int. J. Tour. Hosp. Res. 2019, 33, 217–226.
- Seto, K.C.; Ramankutty, N. Hidden linkages between urbanization and food systems. Science 2016, 352, 943–945.
- Srinivasan, S.; Shende, K.M. A study on the benefits of convenience foods to working women. Atithya J. Hosp. 2015, 1, 56–63.
- Lee, H.I.; Han, A.R.; Kim, K.D.; Lim, H.J. Vietnam Entry Strategy; Korea Trade-Investment Promotion Agency: Seoul, Korea, 2021.
- Taeyoon, K.; Jaeho, L.; Jea, W.C. Firm Level Productivity and Survey Results for Korean Firms in Vietnam and Indonesia; Korea Institute for International Economic Policy: Sejong, Korea, 2011.
- Olsen, S.O.; Tuu, H.H. Time perspectives and convenience food consumption among teenagers in Vietnam: The dual role of hedonic and healthy eating values. Food Res. Int. 2017, 99, 98–105.
- De Jong, B.; Worsley, A.; Wang, W.C.; Sarmugam, R.; Pham, Q.; Februhartanty, J.; Ridley, S. Personal values, marketing attitudes and nutrition trust are associated with patronage of convenience food outlets in the Asia-Pacific region: A cross-sectional study. J. Health Pop. Nutr. 2017, 36, 1–8.
- Che, B.K.; Han, S.Y.; Kim, S.K. Consumption value study affecting consumer attitude and purchase intention: Focusing on Korean ginseng products market in Vietnam. J. Prod. Res. 2018, 36, 53–63.
- Dagevos, H.; van Ophem, J. Food consumption value: Developing a consumer-centred concept of value in the field of food. Br. Food J. 2013, 115, 1473–1486.
- Martilla, J.A.; James, J.C. Importance-performance analysis. J. Mark. 1977, 41, 77–79.
- Liu, C.; Chen, J. Consuming takeaway food: Convenience, waste and Chinese young people’s urban lifestyle. J. Consum. Cult. 2019, 21, 848–866.
- Daniels, S.; Glorieux, I. Convenience, food and family lives. A socio-typological study of household food expenditures in 21st-century Belgium. Appetite 2015, 94, 54–61.
More
Information
Subjects:
Food Science & Technology
Contributor
MDPI registered users' name will be linked to their SciProfiles pages. To register with us, please refer to https://encyclopedia.pub/register
:
View Times:
988
Revisions:
4 times
(View History)
Update Date:
02 Feb 2022
Table of Contents


Notice
You are not a member of the advisory board for this topic. If you want to update advisory board member profile, please contact office@encyclopedia.pub.
OK
Confirm
Only members of the Encyclopedia advisory board for this topic are allowed to note entries. Would you like to become an advisory board member of the Encyclopedia?
Yes
No
${ textCharacter }/${ maxCharacter }
Submit
Cancel
Back
Comments
${ item }
|
${ item.createdUser.fullName }
${ item.createdAt }
${ item.vote }
${ item.reply }
Delete
${ reply.createdUser.fullName }
${ reply.createdAt }
${ reply.vote }
Delete
There is no reply to this comment~
${ item.replyTextCharacter }/${ item.replyMaxCharacter }
Submit
Cancel
More
No more~
There is no comment~
${ textCharacter }/${ maxCharacter }
Submit
Cancel
${ selectedItem.replyTextCharacter }/${ selectedItem.replyMaxCharacter }
Submit
Cancel
Confirm
Are you sure to Delete?
Yes
No