Several works have shown that lightning jumps are precursors of severe weather in deep-convective thunderstorms. Since 2017, the Meteorological Service of Catalonia has operationally run an algorithm that identifies lightning jumps (LJs) in real time. It has resulted in being an effective tool for nowcasting severe weather with a lead time between 15 min and 120 min in advance. This time can be of high value for managing emergencies caused by severe phenomena or heavy rains. The present research focused on the events’ analysis in which more than one lightning jump occurred, searching for those elements that differentiate single warning cases. Thunderstorms producing LJs were divided into two main categories, depending on the number of jumps triggered during the life cycle. Besides, both classes were split into two main sub-types, based on the level of the LJ that occurred. Multiple LJ thunderstorms produce more Level 2—related to severe weather—jumps than Level 1—small hail or intense precipitation—while in the case of a single LJ, the opposite behaviour occurs. In general, multiple LJ thunderstorms with at least one Level 2 jump are the more intense and have a higher vertical development. Finally, lineal and well-organised thunderstorms are the more common modes in those intenser cases.
1. Introduction
Lightning jumps (LJs) are defined as a sudden increase of the total lightning (TL) activity in a thunderstorm [
1,
2,
3]. This electrical activity arises commonly as a precursor of severe weather phenomena (tornadoes, straight-winds exceeding 25 m/s, or large hail over 2 cm in diameter) at the ground or short and very intense rain events [
4,
5,
6]. An algorithm has shown good efficiency for nowcasting both types of phenomena (severe weather and intense precipitation) in convective or deep-convective events, with probabilities of detection of 80% and a false alarm ratio under the 20%. However, at this time, the tool has not resulted in being efficient for discriminating the expected hail size [
7]. In any case, analysing the time series of LJ can provide a new way of understanding the processes associated with extreme precipitation, including large hail phenomena.
A crucial point in the favourable functioning of the algorithms detecting LJs is the capability of detection of the Lightning Location System (LLS) network, especially of the intra-cloud (IC) flashes [
8,
9,
10]. The most common way of identifying LJs [
1,
2,
8,
11] is detecting an increase of the TL activity exceeding 2
σ (this being double the standard deviation of the rate in a previous period of between 10 min and 15 min). Although this algorithm was developed for the terrain LLS, it has recently been applied to satellite imagery, taking advantage of the spatial coverage and the capability of detecting a high percentage of the ICs occurring in thunderstorms [
12,
13]. However, the results have not been as good as expected, probably because of the worse time and spatial resolutions, with respect to the terrestrial systems.
Some researches have focused on the physics of those thunderstorms producing LJs, combining electrical data with radar information [
3,
7,
9,
11,
14,
15,
16,
17]. The previous works considered different radar variables and searched for some key signatures. In this way, Reference [
11] detected a good correlation between thunderstorms producing LJs and the vertical integrated liquid (VIL) radar parameter, in concordance with the results of [
15], who used the graupel mass estimation at high levels. Reference [
9] also observed the same behaviour with the VIL, but the VIL density outperformed in most cases. References [
3,
7] detected that the size of the thunderstorm has a significant role in the triggering of the warning because it affects the number of lightning flashes. Similar results were found by [
16,
17], who considered the regions exceeding 46 dBZ and 55 dBZ (in the first case) and 40 dBZ (n the second case) in hail- and non-hail-producing thunderstorms. Finally, Reference [
14] detected a large number of false alarms in non-severe thunderstorms using the algorithm of [
3] and a lightning mapping array (LMA) system (more than 50%).
The studies of [
11,
15] (among others) showed that some thunderstorms produce multiple LJs, which can be different in the sense of the type of total lightning increase (more or less abrupt) and the number of flashes registered in the thunderstorm. However, the number of analysed cases was in all cases relatively low. In 2017, the Meteorological Service of Catalonia put in operation the algorithm of [
1], with the preliminary work of testing and tuning the parameters according to the Catalan Lightning Location System (LLS), the necessities of the Surveillance and Forecasting Team, and the characteristics of the terrain and the meteorology of the region. Then, a large set of cases has become available for the area of interest since 2006 [
4].
2. Characterisation of Thunderstorms with Multiple Lightning Jumps
The analysis of the dataset of LJs of both levels, 1 (multi-source TL) and 2 (single-source TL), included a total of 8906 LJs, for the period 1 January 2006 to 30 September 2021. This value corresponds to 982 d with, at least, one LJ, of the total of 5752 d of the full period. This implies that in a 17.1% of the days of the period, at least one LJ occurred. Having in mind that the convective period in the region of study goes from April to October, the period where the probability of the major occurrence of LJs reduces to 3393 d and the percentage of days with LJs (considering that there were 937 d with LJs during these months) increased to 27.6%. The next sections present the analysis of the different characteristics of the thunderstorms producing single- and multiple-LJs during this period.
2.1. Short Climatology of Thunderstorms Producing LJs in Catalonia
From the eight-thousand, nine-hundred and six LJs and considering the previous criteria that two LJs correspond to the same thunderstorm if they occurred at a distance less than 50 km, a time gap under 120 min, and a continuity in the single-source TL field, we found that they could be grouped into two-thousand, four-hundred and seven thunderstorms, from which eight-hundred were were SLJsts and one-thousand six-hundred and seven were MLJsts (that is, 59.4% of the thunderstorms producing LJs were MLJsts).
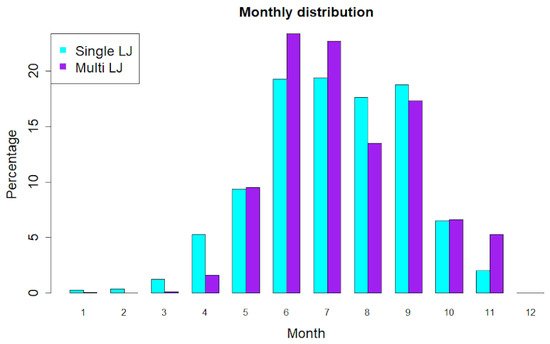
The monthly distributions of SLJsts and MLJsts (Figure 1) showed a similar shape, with a normal curve with a maximum probability for the months June and July. However, there were significant differences, which could be relevant in terms of operational purposes. The first one is that the months August and September present similar probabilities of occurrence (only a bit lower) than June and July in the cases of SLJsts, while the differences are more significant in the case of the MLJsts. Then, the probability of having an MLJst decreases while the SLJst occurrence increases as we move far from June and July. In this sense, the cases with MLJsts for the months December, January, February, and March are practically null, and only SLJsts are usual. Finally, November is the unique month out of the convective period (April to October) where the probability of MLJsts is more relevant than in the case of SLJsts.
Figure 1. Monthly distributions (in percentage) of the SLJsts (cyan) and MLJsts (purple).
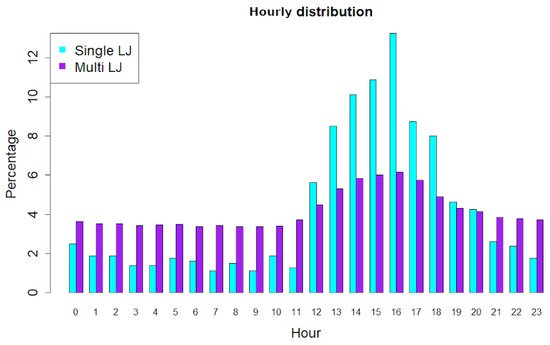
The hourly distributions (Figure 2) also presented the same pattern, with the maximum probability of occurrence between 12 UTC and 18 UTC (coinciding with the diurnal cycle of the convection). However, the peak of the SLJsts was sharper because their duration was shorter and more concentrated in less hours. On the other hand, the MLJsts can stand for longer periods, and then, LJs can also occur out of the maximum period.
Figure 2. Hourly distributions (in percentage) of the SLJsts (cyan) and MLJsts (purple).
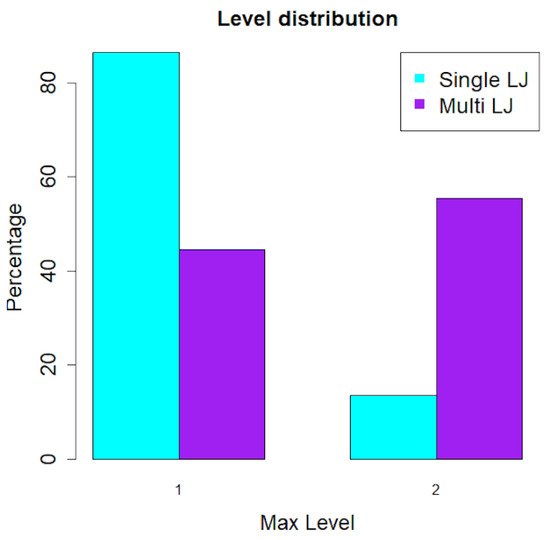
Considering the two levels of the LJs, the first associated with the detection of multiple sources of flashes (occurring in thunderstorms producing small hail, moderate wind gusts, or intense rainfalls) and the second linked to the single sources of the lightning in severe thunderstorms (the ones producing tornadoes, large hail, or strong wind gusts), Figure 3 presents which is the highest level of an LJ in SLJsts and MLJsts, respectively. In the case of MLJsts, a value of two does not mean that jumps of this level only have occurred. MLJsts usually produce both levels of LJs. In any case, SLJsts are more prone to give Level 1 jumps, while the contrary occurs in MLJsts. In this way, deeper convective thunderstorms will produce more than one LJ and at least one of Level 2 also.
Figure 3. Maximum level distributions (in percentage) of the SLJsts (cyan) and MLJsts (purple).
It is interesting to indicate that 44.6% (716) of MLJsts only produced Level 1 jumps. Of these MLJsts without Level 2 jumps, a 78.9% (562) triggered three jumps as the maximum. Only 1% (eleven) of MLJsts with only Level 1 jumps produced nine or more LJ. We did not find any relevant feature of those cases regarding the normal distributions shown in the previous figures. On the other hand, in the case of the ninety three MLJsts that produced five or more jumps, the pattern was very relevant. There were 86% (80) of cases that occurred between July and September, and 40.1% (38) of the thunderstorms developed between 13 UTC and 15 UTC. Then, diurnal and summer deep convection play a principal role in the occurrence of MLJsts with several jumps of Level 2.
To end this point, Table 1 presents the number (and the percentage) of thunderstorms of the different categories: single-LJ, 2 to 4 LJs, 5 to 9 LJs, 10 to 14 LJs, and more than 14 LJs. In all cases, the number of thunderstorms with Level 1 LJs was notably higher than of Level 2. Besides, all those thunderstorms with five or more LJ had, at least, one Level 1 jump. In the same way, the presence of Level 2 LJs in thunderstorms increased from the same value (this is, cases with five or more LJ).
Table 1. Number of thunderstorms (in parenthesis in the first row) with a single-LJ, between 2 and 4 LJs, 5 to 9 LJs, 10 to 14 LJs, and more than 14 LJs. Each category has two columns, with the number (and the percentage with respect to the total Ls of the selected category) of thunderstorms with at least one LJ of Level 1 (left) and Level 2 (right). Note that, except in the single-LJ case, the numbers are not complementaries.
| Number LJ |
1 (800) |
2–4 (1013) |
5–9 (416) |
10–14 (130) |
>14 (48) |
| LJ Level |
1 |
2 |
1 |
2 |
1 |
2 |
1 |
2 |
1 |
2 |
| N cases |
691 |
109 |
967 |
384 |
416 |
338 |
130 |
122 |
48 |
47 |
| % |
86.4 |
13.6 |
95.4 |
37.9 |
100 |
81.3 |
100 |
93.8 |
100 |
97.9 |
2.2. Radar Parameters Associated with Thunderstorms Producing LJs
The analysis of the radar data in cases of thunderstorms producing LJs was performed using the information of the algorithm of identification, characterisation, tracking, and nowcasting of convective cells of the Meteorological Service of Catalonia [
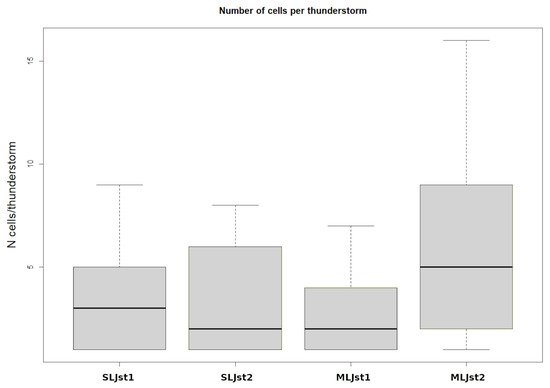
21]. This consisted of determining the behaviour of some signatures such as the number of convective cells and the reflectivity and the height of those cells. The thunderstorms were classified as: (1) with a single Level 1 jump (SLJst1), (2) with a single Level 2 jump (SLJst2), (3) with multiple jumps all of Level 1 (none of Level 2) (MLJst1), and (4) with multiple jumps and at least one of Level 2 (MLJst2).
Figure 4 reveals how the MLJst2 category of thunderstorms presented the largest number of cells on average (with a mean value of five), probably because of the high degree of organisation of the convection and the largest duration. On the other hand, thunderstorms with MLJst1 had the lowest number of cells, with a mean value of two, a bit lower that the class of thunderstorms with SLJst2.
Figure 4. Boxplot of the number of convective cells identified in LJ thunderstorms. From left to right: SLJst1, SLJst2, MLJst1, and MLJst2.
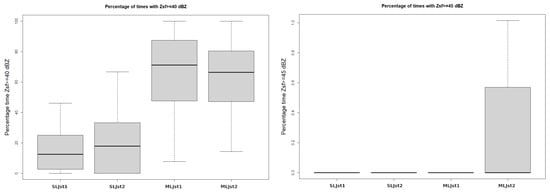
To discriminate the different categories of thunderstorms, we observed that the maximum values of reflectivity or echo top (for the 35 dBZ reflectivity threshold, in this case) did not work properly. Most thunderstorms producing any class of LJ reached high values of both parameters, at least for a short period. However, from our experience and from the analysis of many of the thunderstorms of the dataset, it was possible to identify that the discriminating signatures were more related to the duration of the exceedance of certain thresholds. Because of this, we analysed the reflectivity at the surface and for the whole cell volume, as well as the echo top. In the first case, we considered two different thresholds: 40 dBZ and 45 dBZ. Figure 5 presents how, in the first case, all thunderstorm categories exceeded the threshold for a more or less long period of the life cycle. However, MLJsts showed a higher duration of the exceedance, while SLJsts had a more brief period with intense reflectivity at the surface. However, if we move to the highest threshold, only MLJst2 had periods where 45 dBZ were exceeded. Then, this type of thunderstorm has the highest and more intense exceedance periods of high reflectivity values.
Figure 5. Same as Figure 4, but for the number of times that surface reflectivity exceeded a certain threshold: (left) 40 dBZ; (right) 45 dBZ.
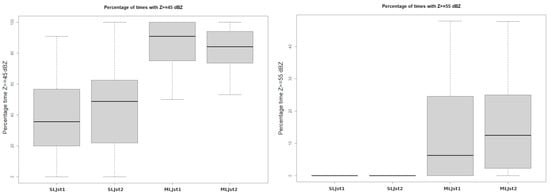
In a similar way, but for the maximum reflectivity of the full cell volumes (Figure 6), the SLJsts usually had a shorter duration of exceedance of 45 dBZ than MLJst. Besides, SLJsts rarely exceeded during their life cycle 55 dBZ, contrary to MLJst. Finally, it is important to remark that this exceedance was more common in MLJst2.
Figure 6. Same as Figure 4, but for the number of times that maximum reflectivity exceeded a certain threshold: (left) 45 dBZ; (right) 55 dBZ.
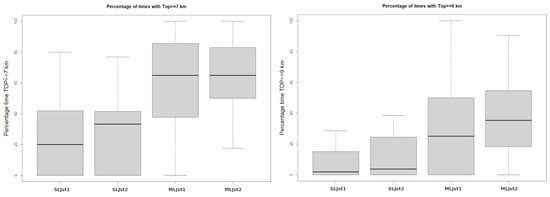
Finally, the echo top 35 dBZ (Figure 7) presented again a similar behaviour as the reflectivities, for both thresholds of height exceedance (6 km and 8 km). SLJsts exceeded for a shorter time period both thresholds, in comparison to MLJsts. Besides, the values were larger in those MLJst2 cases.
Figure 7. Same as Figure 10, but for the number of times that echo top 35 dBZ exceeded a certain height threshold: (left) 6 km; (right) 8 km.
2.3. Degree of Convection in Thunderstorms Producing LJs
The set of LJ-producing thunderstorms were classified according to the scheme shown in
Figure 8. The classification was performed by combining the automatic generation of the maps, as presented in
Figure 1, and the visual analysis of these maps. It is worth noting some considerations regarding the classification. The first one regards the question of the subjectivity of the analysis: the experience of the authors can reduce this issue, but some complex thunderstorms can be classified in a different way depending on the point of view. In any case, the number of doubtful events was reduced compared with the total number. The second point is that only those cases totally in the range of volumetric information of the radar network were included (see, for instance, [
23]). This consideration avoided having the wrong perspective of the selected thunderstorm. In the case of the SLJsts, the percentage of discarded elements was 15% (the total of valid thunderstorms was 675). However, for the MLJsts, only 37% of cases were used (605). We preferred reducing the total number of cases (that is, comparable with the SLJsts) to generate a large set of misclassified events.
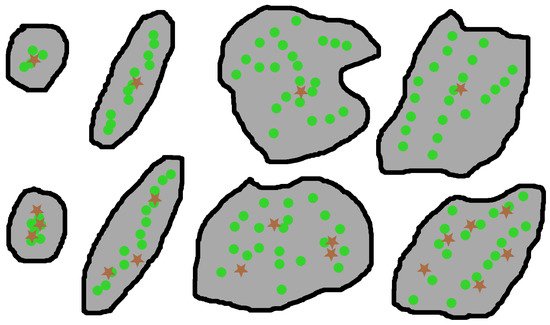
Figure 8. Scheme of the classification of the LJ-producing thunderstorms according to the number of jumps (brown stars): SLJsts (
above) or MLJsts (
below). The shadowed grey area indicates the limits of the thunderstorm based on the reflectivity footprint, while the green dots correspond to the cells identified using the algorithm of [
21]. From
left to
right: isolated (a unique convective cell with a reduced path), lineal (a unique convective cell with a large trajectory), unorganised (multiple convective cells following unconnected paths), and organised (multiple cells with parallel or quasi-parallel trajectories, or the result of the splitting and merging processes).
Table 2 summarises the distribution of the cases for each type of thunderstorm (SLJst or MLJst), which, at the same time, were sub-classified depending on the maximum degree of the warnings (1 or 2). The key elements of the classification (see the caption of the table for the definition of the different categories) were as follows: First, organised thunderstorms are the most common except in the case of MLJst1. Second, for this last category, the unique convective cells types predominated, in particular those with a lineal trajectory. Third, the isolated category was the least common except for SLJst1. Lastly, for those categories with Level 2 jumps (SLJst2 and MLJst2), a clear predominance of the organised structures existed.
Table 2. Distribution of convective modes according to the number of jumps (single or multiple) and the level of the LJ (1 or 2).
| |
Isolated |
Lineal |
Unorganised |
Organised |
| SLJst1 |
104 |
50 |
186 |
241 |
| SLJst2 |
9 |
10 |
25 |
50 |
| MLJst1 |
64 |
88 |
34 |
36 |
| MLJst2 |
41 |
107 |
106 |
129 |
 +1 credit