The sensor is fabricated using microelectromechanical systems (MEMS) technology, and is encapsulated in castor oil, which has an acoustic impedance close to the human body.
1. Introduction
Sound is closely related to our lives. All living things in nature vibrate and make sounds. Humans have long used acoustic principles to identify physiological and pathological sounds which are produced in the body
[1]. Therefore, it is of great significance to medical diagnosis that the sounds produced by various organs of the human body can be accurately acquired and analysed. With the development of medical technology, the demand for non-invasive and high-precision detection equipment has greatly increased, which relies on high-performance sensors. Acoustic diagnostic instruments have become a hot area of current research due to their non-invasiveness and diagnostic mechanism
[2]. High-performance medical acoustic sensors are the core of the instrument and the key to this research.
The acoustic signals of the human body include the heart, lungs, bowels and other sound signals
[3]. These signals are extremely weak but contain a lot of health-related physiological and pathological information. In order to better capture these weak acoustic signals, Rene Laennec invented a mechanical stethoscope, which can non-linearly amplify the collected sounds
[4]. With the development of technology, it has been found that mechanical stethoscopes are not ideal, due to the resonance effect of the catheter. Their frequency responses have extreme values at some frequencies, and different models’ transmission characteristics are quite different
[5]. Therefore, 3M Corporation invented the electronic stethoscope. The electronic stethoscope uses electronic technology to amplify the sounds and overcome the high noise of mechanical stethoscopes. It converts sound waves into electrical signals through sensors and then amplifies and processes them to obtain the best results. As the core of the stethoscope, the sensor determines the stethoscope’s performance
[6]. At present, the most widely used acoustic sensors are mainly divided into two types: electret capacitive sensors and piezoelectric sensors
[7]. The acoustic signals have to pass through the air medium during the transmission between the body and the transducer, resulting in a high loss of acoustic energy. Electret capacitive sensors are often used in microphones and have the advantage of low cost, but the SNR is poor
[8]. Piezoelectric sensors are mainly used in ultrasonic testing
[9]. Although they have good electromechanical coupling coefficients, the similarity between the heart sound signals extracted by the piezoelectric electronic stethoscope and the original signals is less than 70%, increasing the difficulty for doctors’ judgments
[10].
2. Acoustic Properties Testing
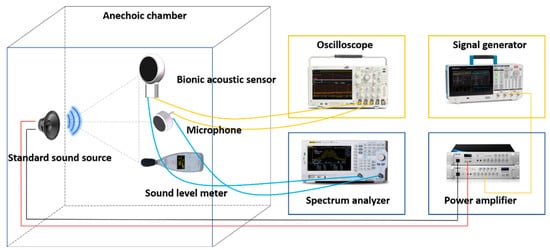
After the encapsulation process of the sensor, this paper tested the performance of the sensor. The acoustic test platform was set up to test the acoustic performance. The diagram of the test platform is shown in
Figure 1. The anechoic chamber can be well insulated from ambient noise, and a standard sound source (RMS.50 W, MAX.180 W) was placed in it. The MEMS bionic acoustic sensor, sound pressure meter, and sound source were placed in an isosceles triangle, while an electret microphone was set as a reference
[11]. The test method was as follows:
Figure 1. Diagram of the test platform.
-
The signal generator (Tektronix 31052) sent a standard sinusoidal signal, which was amplified by a power amplifier and transmitted to the standard sound source to form acoustic waves;
-
The MEMS bionic sensor and the electret microphone converted the acoustic signal into an electrical signal and output the waveform to the oscilloscope (Tektronix MSO64B). The spectrum analyser analysed the current signal in the frequency domain. The sound level meter displayed the sound pressure level in the current environment;
-
The frequency and amplitude of the sinusoidal signal were changed by adjusting the power amplifier and signal generator to control the sound pressure variation. Then, we recorded the output voltage and frequency response of the MEMS bionic sensor and the electret microphone.
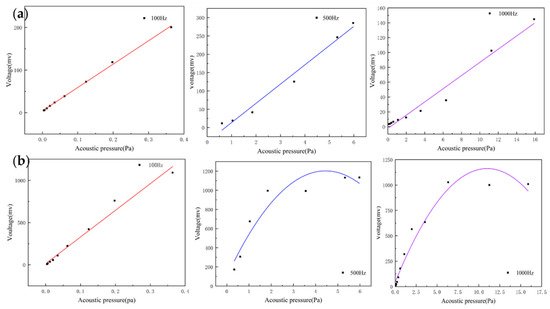
For acoustic sensors, linearity is an important indicator and can be assessed by recording the output voltage of the sensors at different sound pressures. They can indicate the input–output characteristic of the sensor. The heart sound signal is weak with very low sound pressure. If the output response of the sensor is non-linear, this will result in the inaccurate amplitude of the acquired heart sound signals. This creates a large deviation in the amplitude and energy of the acquired heart sound signal compared with the actual one, which affects the subsequent data analysis. By testing whether the linear range of the sensor covers the frequency band requirements of the measured signal, the rationality and effectiveness of the structure can be verified. The MEMS bionic acoustic sensor showed an excellent linear response with an R-squared value of 0.99. This is shown in Figure 2a, and the linearity of the electret microphone is shown in Figure 2b. It was found that the linearity of the MEMS bionic sensor was more stable at different frequencies and was better than the electret microphone at 500 Hz and 1000 Hz. This result shows that the MEMS bionic sensor outperformed the electret microphone in the low-frequency band.
Figure 2. (a) The linearity of the MEMS bionic sensor at 100 Hz, 500 Hz, and 1000 Hz. (b) The linearity of the electret microphone at 100 Hz, 500 Hz, and 1000 Hz.
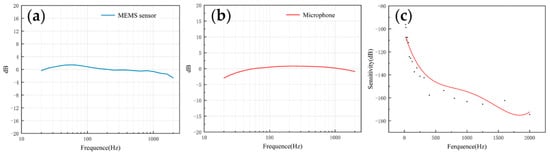
The frequency response describes the sensor’s ability to process signals at different frequencies. Since the heart sound signal is mainly in the range of 20–600 Hz and the breath sound signal is mainly below 1000 Hz, this paper mainly tested the frequency response of the two sensors in the range of 20–2000 Hz. As shown in Figure 3a,b, both of them had a flat frequency response, which was very close to the simulation results. The flatness of the microphone and the MEMS bionic acoustic sensor were 3.41 dB and 1.76 dB. The MEMS bionic sensor was better than the electret microphone at 20–100 Hz.
Figure 3. (a) The frequency response of the MEMS bionic sensor. (b) The frequency response of the electret microphone. (c) The sensitivity of the MEMS bionic sensor.
The sensitivity can be used to evaluate the ability of the sensor to pick up weak signals, and is expressed as Equation (6). The sensitivity was calibrated by the test platform, and the results are shown in Figure 3c. The sensitivity of the sensor achieved −163.3 dB (re:1 V/μPa) at 1000 Hz. In the low-frequency band, the MEMS bionic acoustic sensor had good characteristics.
where Δx is the variation of the sound pressure, and Δy is the variation of the output voltage.
3. Heart Sound Detection
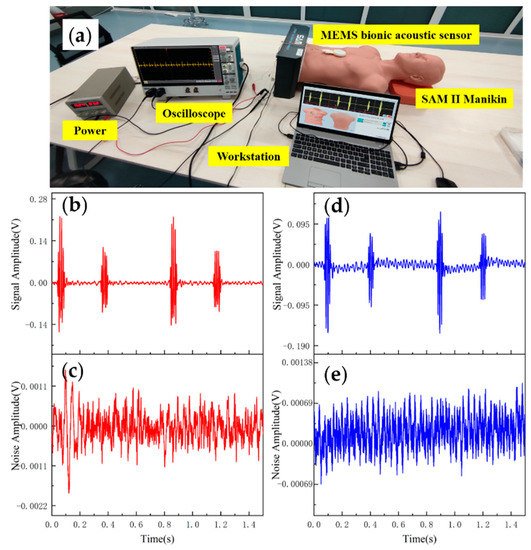
Data analysis and evaluation of the collected signals are essential for the sensor’s practicability. After completing the acoustic performance tests, the sensor was tested for application. The test was conducted using 3B Scientific™ SAM II® Student Auscultation Manikin. It contained nearly 100 kinds of high-quality physiological and pathological heart, respiratory and intestinal sounds. Students could auscultate with an acoustic stethoscope without noise interference. The MEMS bionic acoustic sensor and 3M™ Littmann® 3200 electronic stethoscope (3M electronic stethoscope) were used to collect heart sound signals. Firstly, a normal heart sound signal with a heart rate of 75 bpm was collected. The waveform is shown in Figure 9. It can be seen that the normal heart sound signal collected by the MEMS sensor had obvious characteristics. The first heart sound (S1) and the second heart sound (S2) were clearly visible, and the heartbeat period was 0.8 s. According to Equation (7) and Table 3, the SNR of the MEMS sensor and the 3M electronic stethoscope were 38.6 dB and 37.6 dB, respectively, with the MEMS sensor being slightly better than the 3M electronic stethoscope by 1 dB.
where vs is the effective voltage value of the heart sound signal, and vn is the effective voltage value of the noise.
Figure 4. (a) Heart sound detection test. (b) Normal heart sound signal collected by MEMS sensor. (c) The noise of MEMS sensor. (d) Normal heart sound signal collected by 3M electronic stethoscope. (e) The noise of 3M electronic stethoscope.
Table 1. Data of MEMS sensor and 3M electronic stethoscope.
| Type |
MEMS Sensor |
3M Electronic Stethoscope |
| Vs(mv) |
Vn(mv) |
Vs(mv) |
Vn(mv) |
| Peak-to-Peak |
418.3 |
2.325 |
291.4 |
2.119 |
| RMS |
28.63 |
0.334 |
22.68 |
0.298 |
| SNR (dB) |
38.6 |
37.6 |
Table 2 shows the comparisons of SNR of sensors with different structures. The fish ear structure had the highest SNR. The above experimental results demonstrated that both sensors could effectively capture the normal heart sound signal. The normal heart sound signal consisted mainly of S1 and S2. They marked the beginning and end of the ventricular contractions, respectively, which can be easily captured by stethoscopes. The third (S3) and fourth (S4) heart sounds differed from them in that they were low-frequency sounds, fainter and more difficult to capture by stethoscopes. The frequencies of S3 were mainly around the frequency bands of 50–70 Hz, and the S4 are mainly around 50–70 Hz and 150–170 Hz [12][13]. They were produced by ventricular filling rather than being associated with valve closure. In this paper, to verify the ability to collect low-frequency signals, the MEMS sensor was used to collect S3 and S4. The acquired waveforms were compared with that of the 3M electronic stethoscope.
Table 2. Comparison of SNR of sensors with different structure.
| Types |
SNR |
| Cilium and Sphere |
15.1 |
| Cilium |
18.64 |
| Lollipop |
25.72 |
| Bat |
29.08 |
| Fish ear |
38.6 |
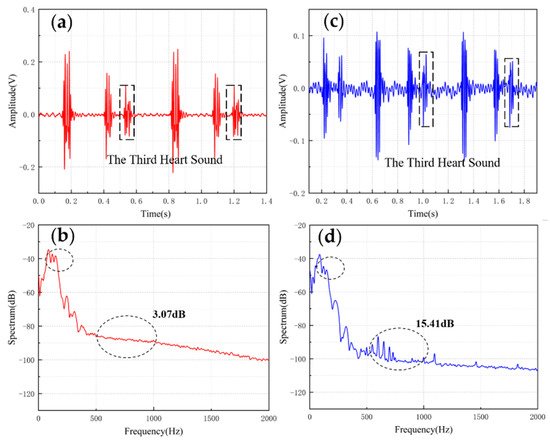
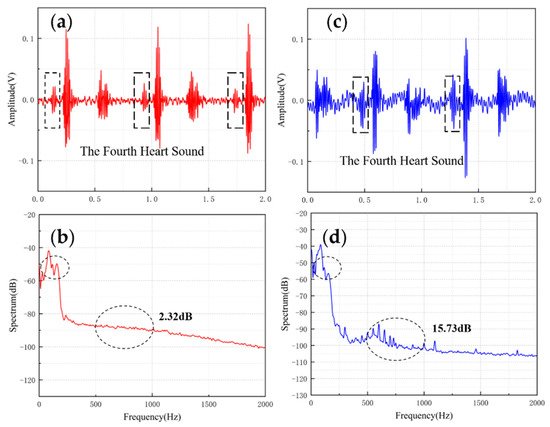
The results are shown in Figure 5 and Figure 6. From the time domain, both sensors can capture S3 and S4, but the signals from the MEMS sensor had a higher SNR. From the frequency domain, the spectrums of the S3 (50–70 Hz) and S4 (50–70 Hz) collected by both sensors were close, but the S4 (150–170 Hz) collected by the MEMS sensor was better than 3M electronic stethoscope 7 dB. The main energy of the heart sound signal was concentrated below 600 Hz, and 90% of the energy was concentrated in the range 20–150 Hz. This indicates that the heart sound signal collected by this MEMS sensor can cover its theoretical range completely. At the same time, the 3M electronic stethoscope picked up some components at 500–1000 Hz, while the MEMS sensor’s spectrum was flatter. The fluctuation range of the MEMS sensor was 3.07 dB and 2.32 dB, and the 3M electronic stethoscope was 15.41 dB and 15.73 dB. In summary, the time-frequency characteristics of the heart sound signals collected by the MEMS sensor were essentially the same as the signal collected by the 3M electronic stethoscope, even better than it in some ways. As a result, the proposed sensor can collect accurate and valid heart sound signals, and be used in auscultation.
Figure 5. (a) The S3 waveform collected by MEMS sensor. (b) The spectrum of the signal from MEMS sensor. (c) The S3 waveform collected by 3M electronic stethoscope. (d) The spectrum of the signal from 3M electronic stethoscope.
Figure 6. (a) The S4 waveform collected by MEMS sensor (b) The spectrum of the signal from MEMS sensor (c) The S4 waveform collected by 3M electronic stethoscope (d) The spectrum of the signal from 3M electronic stethoscope.
 +1 credit