Your browser does not fully support modern features. Please upgrade for a smoother experience.
Submitted Successfully!
 +1 credit
Thank you for your contribution! You can also upload a video entry or images related to this topic.
For video creation, please contact our Academic Video Service.
| Version | Summary | Created by | Modification | Content Size | Created at | Operation |
|---|---|---|---|---|---|---|
| 1 | Daniel Casquero Soler | + 4794 word(s) | 4794 | 2022-01-11 03:11:47 | | | |
| 2 | Bruce Ren | Meta information modification | 4794 | 2022-01-25 02:23:07 | | |
Video Upload Options
We provide professional Academic Video Service to translate complex research into visually appealing presentations. Would you like to try it?
Cite
If you have any further questions, please contact Encyclopedia Editorial Office.
Casquero Soler, D. Mobility Apps for Improving Urban Travel Patterns. Encyclopedia. Available online: https://encyclopedia.pub/entry/18709 (accessed on 24 June 2026).
Casquero Soler D. Mobility Apps for Improving Urban Travel Patterns. Encyclopedia. Available at: https://encyclopedia.pub/entry/18709. Accessed June 24, 2026.
Casquero Soler, Daniel. "Mobility Apps for Improving Urban Travel Patterns" Encyclopedia, https://encyclopedia.pub/entry/18709 (accessed June 24, 2026).
Casquero Soler, D. (2022, January 24). Mobility Apps for Improving Urban Travel Patterns. In Encyclopedia. https://encyclopedia.pub/entry/18709
Casquero Soler, Daniel. "Mobility Apps for Improving Urban Travel Patterns." Encyclopedia. Web. 24 January, 2022.
Copy Citation
In recent decades cities have applied a number of policy measures aimed at reducing car use and increasing public transportation (PT) patronage. Persuasive strategies to change mobility behavior present notable limitations in economic and logistical terms and have only minor impacts. The smartphone has emerged as a promising tool to overcome these challenges, as it can host persuasion strategies through mobility apps. Simultaneously, Mobility-as-a-Service (MaaS) schemes could open up new possibilities for addressing both sustainability goals and the needs of urban travelers.
mobility apps
travel behavior
transfer car trips to PT
persuasive technology
Information and Communication Technology (ICT)
1. Introduction
Many cities have been planned or transformed to allow massive car use, and major efforts are needed to reverse this situation. The current challenge is therefore to convince travelers to choose more sustainable modes of travel. The measures implemented to meet this challenge have generally been classified as “hard” and “soft”. Hard measures, involving changes to transport infrastructures with high associated costs for public administrations, are sometimes controversial and are unfeasible for politicians [1]. For this reason, public administrations have started to take an interest in soft measures, which try to persuade and make sustainable mobility more attractive. Among the soft measures, travel behavior change programs (TBCP) have become popular, demonstrating their potential to reduce car use [2]. However, their effects on participants are somewhat limited and they are difficult to apply to large population groups [3].
ICT has changed the way travelers move around cities, as smartphone technology provides users with high-value information. The arrival of smartphones may dramatically help change travel patterns [1] and enhance the effects of TBCP interventions. In the last decade, some TBCP programs have started to be run through smartphones [2][3], and are known as technology-based interventions. In this case, travel apps incorporate persuasive elements to encourage users to adopt sustainable modes of transportation.
The literature has paid increasing attention to the introduction of elements in mobility apps [4][5][6] to foster positive changes in travel behavior. The main objective of these “app-based persuasive technologies” is to foster environmental sustainability, promote healthier trips and contribute to livable cities. In parallel, since the launch of UbiGo—the first MaaS platform—travelers’ needs have received more attention. The alignment of MaaS with sustainability goals is a clear dimension for its adoption [7]. There is therefore a gap to be filled in the scientific literature, consisting of compiling all the findings from different studies on the travel elements and characteristics that persuade people to choose more sustainable transport modes. The lessons learned from MaaS experiments are always user centered [8]. An urban travel app will be more attractive if it provides synergic interactions between sustainable mobility options and individual benefits such as money or time savings, increased access to different modes, ease of use, etc.
Figure 1 shows a mobility app designed with a user-centered approach (smartphone on the left) that incorporates persuasive strategies that encourage sustainable mobility habits (on the right). In addition, the regulatory framework and business viability are key to the development of these apps [9].
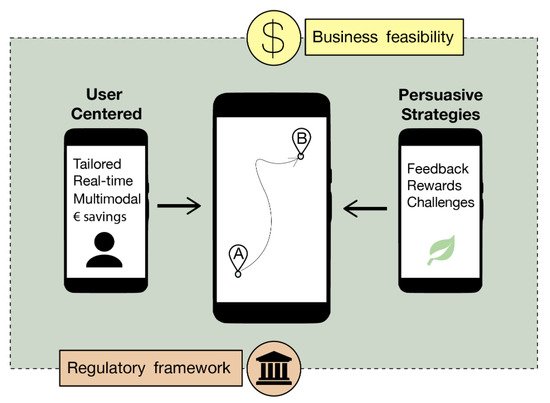
Figure 1. Mobility app design scheme.
2. User-Centered Mobility Apps
This section analyzes the characteristics that travel apps must have to be attractive to users. Of the 297 papers searched, 23 papers were chosen for this section. After their study, five new references were added that were cited in these 23 papers (snowballing approach). Finally, this section was based on 28 papers: 22 empirical studies, four literature reviews and one on the importance of the user in the MaaS model. Most of the studies considered are related to the MaaS concept, given its user-centric perspective. Mobility as a service (MaaS) schemes emphasize the importance of satisfying user needs. However, these needs or preferences are clearly heterogeneous [10], so transport services should not be rigid but allow the user to choose their particular mode in the most flexible manner. From the user’s point of view, this offers a broad set of options that can be combined in multiple ways; registration, planning, booking, payment and ticketing are highly valued by urban travelers [8].
-
Sociodemographics
Recent studies show that sociodemographic factors are good predictors of the intention to adopt new mobility services such as app-based ride-hailing [11]. In terms of age, young people are highly inclined to use new forms of mobility such as sharing services, whereas they tend not to be considered by older adults, who are less open to technological innovations [12]. Senior travelers are increasingly taking environmental impact into account when choosing between different mobility options. DriveNow, a car-sharing service in Denmark, is seeing growth in the number of elderly people and women [13].
Young people express some concern in regard to car-sharing about the increased time costs of looking for parking at the destination [8], leading to problems in areas where parking is difficult.
Young (mainly tech-savvy) people are also a suitable target and are used to living with a range of technologies such as apps [14]. From an economic point of view, one of the reasons for reducing private car use is the financial burden it imposes [15]. The Park and Ride option is one way of reducing private car use. A recent study reveals that the probability of using this option decreases with income [16]. A study of users of the route-recommendation app Baidu (China) revealed that wealthier bus riders are less likely to use the app-based ride-hailing service [17], possibly because a significant portion of bus riders are older adults.
-
Real-time information
One of the most important advantages offered by ICTs is the possibility of providing updated information at the moment it is demanded by the user, either through a website or an app. This has become a key requirement for transport system users [18] and must be both delivered in real time and also reliable. People today are highly sensitive having their time wasted, and as transportation is an activity that derives from other activities, travelers are less tolerant of wasted time.
In a recent study, participants who were mainly young people (<25 years) emphasized the importance of network efficiency to avoid incidents, and of informing the user in real time of these incidents so as not to waste time. Specifically, travel duration, transport mode, itinerary, travel cost and service incidents are the areas of information most demanded by travelers [8].
A study carried out to test the travel app Metropia, which gives users real-time traffic information, enabled drivers to reduce their travel time by 5–10% [19]. The reduction in travel time, especially in waiting time, is recognized by several studies [20]. A recent experiment on travel time in a transit network compared two scenarios: in the first, the user did not use a smartphone (or any other form of real-time information) and took the first bus to leave the stop; while in the second, they used the smartphone to estimate the fastest route strategy, updated in real time. The travel time savings were over 15% when the smartphone was used (based on real-time information), mainly due to the reduction in waiting time at the origin stop [21]. Real-time information produces an upsurge in the number of public transport users; some authors claim that more than 30% of public transport app users increase their use of the bus [20].
Real-time reporting of incidents can modify the user’s travel behavior (travel mode, route, deciding to delay departure time, etc.) [22]. This is confirmed by the results of a recent survey of bus passengers: 12% of the participants changed their route at least once due to incident notifications reported by other passengers [23].
Receiving information from passengers (e.g., reporting events) or providing users with a platform to exchange information in real time (e.g., an app to share information between users of the metro network) strengthens the management of the system from the perspective of the transport operator. Recent research on Denmark found that although the conditions of the transport system are well perceived by the user, there is significant interest (one third of users) in sharing information on the transit level of service (crowding, arrival times, delays, etc.). Following other authors, smart card data analysis does not serve as real-time information as it is retrospective [24]. The only source of real-time information is the active exchange of data by users, either in the form of permission to track phones, or messages to other users [25].
In regard to psychological aspects, a recent literature review on transit apps [20] extracted two key findings: (i) real-time information increases public transport users’ perception of safety, especially in night waits and at “unsavory” stops, and among women. Knowing the estimated time of arrival in real time reduces the anxiety associated with the uncertainty of waiting; and (ii) more up-to-date information implies greater user satisfaction as it is more reliable.
-
Registration-planning-booking-payment method
Planning trips well in advance brings clear economic and travel time benefits [19][21]. The registration and use of a single account (and ticket) to pay for the whole range of transport options available in the city promotes more efficient, seamless and multimodal mobility networks and increases their level of convenience [8].
However, subscribing to multimodal service packages allows users to travel more efficiently, as they think in advance about how they want to travel and decide on the most appropriate package; studies on this topic propose that this should be done on a monthly or quarterly basis. A large group of people may never have considered how they plan to travel, on a monthly basis. Subscription also brings the convenience of paying only once per subscription period [15]. Most research concludes that participants prefer subscription to a monthly service package than pay-as-you-go [8]. Recent studies reveal that users have heterogeneous mobility preferences, so it makes more sense to focus on ensuring the offer is as flexible as possible and allowing users to choose both the payment model and the services included in their bundle [10].
Users appear to choose based on predesigned packages [10]. Economic attractiveness—even in countries with high purchasing power such as Sweden and Australia [7][15]—and simplicity in terms of the inclusion of only a few transport modes [7] are also essential. Public transport is the preferred mode for inclusion [10], specifically “unlimited rides” [7][10]. A recent study has revealed that service subscription packages can be of great help to people with reduced mobility, especially if they can be customized [26].
-
Customization
Personality factors have a major impact on people’s mobile app adoption behavior, and this varies by app category [27]. Recent studies reveal current user demand for personalized assistance and mobility recommendations based on their profiles, needs and habits. The personalization of transport services, easily achieved through websites or travel apps, makes them more attractive and encourages loyalty and user engagement [8]. Digital platforms (apps or websites) can significantly help users who can no longer move around the city autonomously due to physical or intellectual disabilities. Interviews with the community transport sector (social care services) in Australia found an increase in the demand for more individualized services [26]. Travel apps can also help reduce car use for drivers by offering competitive alternatives, as time and comfort are known to be key for regular drivers [16].
-
Assistance
Transportation systems in large cities are difficult for users to understand. Complementing the app’s services with human customer service would be very attractive, particularly to elderly users. One of the main advantages of UbiGo was that it offered a mobility broker that acted as a mediator between service providers and users, facilitating the use of transport modes. Participants’ satisfaction with UbiGo’s response to their particular problems was very high (Likert scale, 6.2/7) [15].
-
Platform/community network
Flexibility is a key aspect for encouraging people to take up the app. Flexibility can be understood as a concept associated with the ample possibility of customization by the user. A recent qualitative study [28], reported that users do not want to have only one mode available to them. In the same vein another study [22] argued that private car use provides a very high level of service to the user and proposed a 5-level scale of alternative transport services to the car. Level 5, the highest level, would be a similar service model to the one currently offered by the private car: convenient, door-to-door and with no cognitive cost.
Recent studies have found that it is important for the platform to be easy to use and to protect user information [15][29]. It should not be designed for technophiles but be intuitive for people with little command of the digital world.
One of the interesting aspects of the MaaS scheme is the value of cooperation or collaboration between users. It is proposed that the platform should encourage users to be active, provide information, and interact with other users and the transport operators. Social influence is key to travel behavior [10]. A potential user is significantly influenced by people in their closest people network subscribing to an MaaS package [10], and a digital network works better the more users it has (e.g., for rating transportation services) [30].
Companies are an appropriate place to create transportation service platforms for their employees. Employees know each other personally and may be more willing to use the platforms and share modes of transport, and they can be used to easily match schedules [18].
Impact Assessment of User-Centered Mobility Apps
Of the 22 studies, only nine correspond to real experiments or pilot tests. Table 1 shows a summary of those studies. They can be divided as follows:
Table 1. Scientific studies on urban travel apps, real or experimental.
| App [Ref.] |
Location | Method | Description | Relevant Findings |
|---|---|---|---|---|
| UbiGo [15] |
Gothenburg (Sweden) |
Pilot [n = 195, 6 months] | Payment platform, multimodal monthly pass (per family). Incentives for avoiding private car. Mobility agent. | Users (97%) wanted to continue with the service. 49% perceived cost savings. 44% reported less car use. |
| Smile [9] |
Vienna (Austria) |
Pilot [n = 200, 1 year] | Multimodal info, payment platform, and customer service. |
|
| UMAJI | Taipei (Taiwan) |
In operation | Multimodal info, payment platform, multimodal monthly pass (bus, urban rail, public bike). | After the first three months: PT ridership increased 3.2% and 80% of initial users increased their use. |
| [31] | ||||
| Kaohsiung (Taiwan) |
In operation | Multimodal info, payment platform, multimodal monthly passes oriented to two social segments. | After the first three months: 21% of users were motorized mode travelers and 15,492 packages were sold. | |
| MenGo | ||||
| — [11] |
California (USA) |
Survey [n = 1975] | Ride-hailing among millennials and Generation X people |
|
| DIDI [17] |
China | Survey [n = 9762] | Ride-hailing (taxis and private car companies) and car-pooling (“hitching service”) service in operation. |
|
| Touring [14] |
Ghent (Belgium) |
Pilot [n = 90, 2.5 months] | Budget given to use several travel modes. Payment platform, not for all modes. | Clear reduction in car use (overall for daily commuting). Largely substituted by privately owned e-bike. |
| CMaaS [18] |
(Sweden) | Pilot [n = 400, 6 months] | MaaS for a large company. Multimodal services and booking platform exclusively for employees. | 50% of users are willing to use car-sharing. Possible shift from car if good incentives are provided. |
| Tripi [7] |
Sydney (Australia) |
Pilot [n = 92, 4 months] | Payment platform and three different multimodal monthly passes (PT, Uber, taxi, car share, car rental). | Financial benefits are key. “Pay-as-you-go + payment platform” is not interesting. Multimodal monthly passes, reduced car use. |
| DriveNow [13] |
Copenhagen (Denmark) |
Survey [n = 1496, 2.5 years] | Free-floating car-sharing service, in operation since 2015. |
|
-
By subject: six are related to MaaS experiences, while the other three are ride-hailing or car-sharing experiences.
-
By type of study: surveys exploring real experiences, pilot studies, and two MaaS experiences recently implemented in Taiwan: UMAJI and MenGo.
-
Notes on the MaaS schemes in Table 1.
All MaaS platforms (UbiGo, Smile, UMAJI, MenGo, Touring, CMaaS and Tripi) have a booking tool and payment function, and only Smile does not have a monthly multimodal pass.
The UbiGo service was oriented to families and featured a mobility agent who aimed to personalize the offer to the user. Smile’s customer service consisted of only a call center and an email address.
The area covered by UMAJI was exclusively the 40 km Taipei-Yilan corridor, where congestion needed to be reduced. It offered a monthly package for 43 USD that allowed the use of public bike, bus and metro.
MenGo offered different monthly multimodal packages depending on the travel modes selected, the number of trips per mode included in the subscription period and the total price. They were aimed at: (i) students aged 17 to 22; and (ii) the white-collar segment, The UMAJI and MenGo packages did not include new mobility services such as car/motorcycle sharing, ride-hailing or taxis.
The Touring app allowed booking and payment for different travel modes (car sharing, car rental, taxi, bus, streetcar, train, bike-sharing). Users were given a balance of between €150 and €350 to use only for the modes of transport and were asked to refrain from using the private car as much as possible.
Tripi offered four payment modes: pay-as-you-go or three different monthly multimodal passes (PT, Uber, taxi, car share, car rental). These have a clear green orientation, as one of them includes unlimited trips on public transport.
-
Changes in travel behavior
All MaaS schemes produced some positive preliminary conclusions. All consider that larger tests and measurements by digital devices are needed [7]. In particular, one study [14] reports that significant reductions in car use will not come quickly. Of UbiGo users, 44% reported less car use, as did 21% of Smile users, also in the form of user reporting.
An evaluation was conducted in UMAJI and MenGo three months after the service became operational, showing a 3.2% increase in public transport users in UMAJI (the single multimodal package included metro, bus and public bike). MenGo attracted a significant group of motorized travelers. In both cases a high percentage of initial users continued to use the service after three months.
The Touring study was conducted with car users willing to reduce usage, and reported a clear reduction, especially in commuting; car use was largely replaced by private electric bicycles. In the case of Tripi, in the fourth (and last) month of the test, users who chose the pay-as-you-go model drove an average of 658 km, while those who chose the “Green pass” (unlimited travel on public transport) drove only 222 km. According to one study [7] the economic benefits are key and the pay-as-you-go + payment platform mix is not attractive to users.
DIDI, the large Chinese ride-sharing service, is priced similarly to the bus and is used by all socio-economic classes. It attracts users from all sustainable modes because of price and time savings, which is the advantage most recognized by its users. Of respondents, 12.5% use DIDI instead of their own car due to car use limitations and parking problems in their cities [17].
Alemi [11] surveyed youth and Generation X people in California about ride-hailing services and found that preference for personal vehicle use and safety concerns are the limiting factors for use. In terms of land use, the lowest number of services occur in suburban and low-density areas. Millennials, the better educated and those with a high time value are likely to use ridesharing.
Sixty four percent of DriveNow trips would have been made by active modes and mostly by public transport. Infrequent drivers considered DriveNow to be maintenance-free and cheaper than a private car. Frequent drivers used DriveNow for leisure trips and preferred to drive themselves rather than use a cab. Relocation of residence, changes in employment and household composition could lead to increased private car use [13].
3. Mobility Apps Fostering Sustainable Mobility
This section highlights key points from the articles selected on the persuasion strategies in mobility apps to promote sustainable urban travel modes.
Many voluntary travel behavior change (VTBC) interventions have been applied for over 20 years, mainly in western countries. Compared with mass communication, interventions that gave the individual information on their specific travel behavior proved to be more effective [6][32]. With advances in mobile technology, mobile phones have clearly become useful for implementing persuasion strategies [33], especially in the field of research.
Persuasive technology is widely described as technology that uses persuasion and social influence rather than coercion to modify users’ attitudes or behaviors. Figure 2 shows the persuasive strategies studied in the last two decades, according to the frequency of times they have been addressed in scientific papers. The most studied are self-monitoring, feedback, gamification and rewards; cooperation, reduction, tunneling, framing and simulation are the least studied [6].
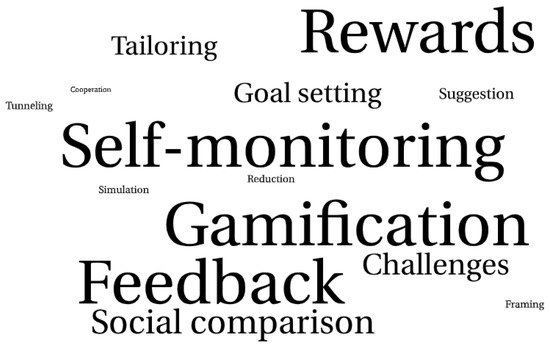
Figure 2. Word cloud with persuasion strategies.
Impact Assessment of Mobility Apps That Foster Sustainable Travel Behavior
The scientific review conducted by Anagnostopoulou [6] of persuasion systems between 2003 and 2018 estimates that 65% have been successful, due to changes in the user’s attitude or travel behavior, or satisfaction with the system or approach. However, only a few studies specifically evaluate behavior change, and most only test a short period of time (less than one month), which is insufficient to induce change.
This document extended the scientific review on persuasion systems to 2021 (Appendix B). A total of 42 articles were identified and, of those, only six met the following three requirements: (i) being an existing system or a pilot; (ii) having more than 50 participants; and (iii) lasting at least three months. Table 2 lists the characteristics of the six schemes that met these criteria.
Table 2. Pilot apps and webs tested by a period of more than three months.
| Ref./Year Duration/N |
App/Web | Strategies Implemented | Relevant Findings |
|---|---|---|---|
| [34]/ 2014–2016/ 3–4 months/ N = 900 |
From5To4 (Web) Prototype |
Feedback, badges, gamification, rewards, goals, social comparison, social competition, cooperation. |
|
| [35] /2015/ 6 months/ N = 3400 |
Routecoach (App/web) Prototype |
Tailoring, tunneling, suggestion, reduction, feedback, challenges. |
|
| [36]/2015/ 6 months/ N = 667 |
BetterPoints (App/web) Prototype |
Badges, rewards, challenges, notifications/messages, social comparison/competition, goals. |
|
| [37]/2016/ 3 months/ N = 64 |
StreetLife1 (app) Prototype |
Badges, rewards, social comparison and competition |
|
| [38]/2016/ 1 year/ N = 52 |
GoEco! (app) Prototype |
Tailoring, feedback, simulation, suggestion, tunneling, goals, encouraging messages, challenges, badges/rewards, social comparison |
|
| [39]/2017/ 13 weeks/ N = 207 |
Bellidea (app) Prototype |
Feedback, badges, rewards, challenges, social comparison and competition. |
|
Their duration in all those six cases ranged from three months (From5To4, StreetLife and Bellidea) to one year (GoEco!). The study with the fewest participants had 52 people (GoEco!) and the study with the most had 3400 (Routecoach). All of them were conducted in Europe. The six systems were carried out as prototypes, in most cases by universities, except for the From5to4 system, which was implemented by five entities, public companies and consulting firms, with no university participation. This system has been implemented in 30 different organizations, both public and private.
-
Website/app format
In the case of Routecoach, the app acted as a “routing hub” to collect trip information, and could be used as a multimodal route planner, while the website was used for everything else: initial registration and filling out a survey to be recognized in an attitudinal profile, entering data of interest (important locations, usual routes, purposes of the trips made, displaying trip statistics). The website in the BetterPoints system appears to be used only to display a leaderboard with the points obtained in the challenges, which can also be viewed in the app.
-
Type of tracking
Four of the systems studied in Table 2 automatically tracked user trips (Routecoach, Streetlife, GoEco! and Bellidea), while the other two systems required users to manually track their trips (From5to4, Betterpoints). Automatic tracking through apps is not yet effective. In the case of Bellidea, the algorithm achieved 87% accuracy in estimating the route, and performed self-learning with manual validation by users. In the case of From5to4 (manual tracking), users needed only one minute per day to record their travel behavior (travel modes and distances).
There are two differences worth noting between the methods of the experiments: (1) only in the GoEco! Experiment was the sample divided into two subgroups for including a control group; and (2) the Routecoach system experiment included a pre-intervention segmentation of users based on the Segment project model [40] to classify travelers into eight categories according to their attitudes towards sustainability.
-
Persuasive strategies
The most commonly repeated strategies in the six studies in Table 2 are badges, rewards, challenges, social comparison, feedback and social competition, which are used in at least four of the studies in the table. This is similar to the findings of another study [6], except that: (i) challenges and social comparison appear more frequently in these studies; (ii) social competition is not considered by Anagnostopoulou [6], and can be differentiated by simply comparing users, or establishing a competition.
Rewards can be in the form of points for traveling in sustainable modes (From5to4, BetterPoints, StreetLife), to achieve goals that are proposed to the user in the form of challenges (From5to4), for logging trips made on the app/web (BetterPoints). Rewards can be in the form of prizes for highly sustainable travel behaviors (“Bike Award”, From5to4), to redeem points for money (discounts in local stores, BetterPoints), or for planting trees in the participant’s city (StreetLife) or for equipment to travel properly by sustainable means of transport (bicycle helmets, StreetLife). Social comparison can be done through a leaderboard of participants (From5to4, Routecoach, BetterPoints). In the case of challenges, users can propose challenges to other participants (Routecoach).
-
Travel behavior impacts
There is a notable change in behavior with the From5to4 system, with a large reduction in car use and a significant increase in sustainable modes, mainly car-pooling. As previously mentioned, in this case the travel behavior was tracked manually by each user and the validation was done by the captain of each team.
Only self-proclaimed “everyday car users” were studied in the BetterPoints system. The change in travel behavior was also significant: 81% of the trips recorded were car-substituted trips. It is important to note that only 12% (called “maintainers”) maintained their activity over the six months, and so reduced their car use.
The Segment project user categorization [40] was used in the Routecoach system. Users whose profile was most closely related to the use of private vehicles, “devoted drivers” and “image improvers”, were observed to accept from 3 to 5% of all the routes suggested by the system.
The persuasive strategies in the StreetLife system, tested in Berlin, were geared towards promoting cycling. The results obtained through surveys at the end of the experiment were positive. Of the users who reported a change in behavior influenced by the app, 90% increased their use of bicycles, and 42% and 33% reduced their use of cars and public transport respectively. A model (called TAPAS) was used to estimate what the impacts would have been in the whole of Berlin. Daily pollution could have been reduced from 5.64 tons of CO2 to 5.41. In comparison with the Berlin population, the number of students was over-represented and the older cohort was under-represented.
GoEco! was tested in the canton of Ticino (74% of car and motorcycle kilometers traveled) and in the city of Zurich (less, with 57%). The mobility of all trips and of the most frequent ones (“systematic routes”) was studied. The app was not found to lead to statistically significant changes in the systematic routes, but only in the case of Ticino. The treatment group emitted 31% less CO2 per kilometer than the control group on the systematic routes. In the case of Zurich, there was a decrease but it was not statistically significant. The authors considered that Ticino had ample room for improvement compared with Zurich. It should be noted that the sample was small.
-
Attrition/App churn
In four of the six studies, serious attrition or app churn problems were recognized. In the case of From5to4, which is web-based, it was designed as a six-month intervention; however, for some participating organizations this was too long. In the case of RouteCoach, only 15% of users responded to the initial survey and recorded the majority of trips. In the case of BetterPoints, only 12% of participants maintained significant activity until the end. 37% percent of those who downloaded the app reported no activity or stopped after the first month. In the case of GoEco!, only 52 users (573 started) finished. It should be taken into account that this intervention lasted one year. In the case of Bellidea, 71% dropped out in the first two weeks.
References
- Shaheen, S.; Cohen, A.; Martin, E. Smartphone App Evolution and Early Understanding from a Multimodal App User Survey. In Disrupting Mobility; Springer: Cham, Swizerland, 2017; pp. 149–164.
- Jariyasunant, J.; Carrel, A.; Ekambaram, V.; Gaker, D.; Segupta, R.; Walker, J.L. The Quantified Traveler: Changing Transport Behavior with Personalized Travel Data Feedback; University of California Transportation Center: Berkeley, CA, USA, 2012.
- Di Teulada, B.S.; Meloni, I. Individual Persuasive Eco-travel Technology, a mobile persuasive application for implementing voluntary travel behaviour change programmes. IET Intell. Transp. Syst. 2016, 10, 237–243.
- Anagnostopoulou, E.; Bothos, E.; Magoutas, B.; Schrammel, J.; Mentzas, G. Persuasive Technologies for Sustainable Urban Mobility. 2016. Available online: http://arxiv.org/abs/1604.05957 (accessed on 2 July 2021).
- Sunio, V.; Schmöcker, J.D. Can we promote sustainable travel behavior through mobile apps? Evaluation and review of evidence. Int. J. Sustain. Transp. 2017, 11, 553–566.
- Anagnostopoulou, E.; Bothos, E.; Magoutas, B.; Schrammel, J.; Mentzas, G. Persuasive technologies for sustainable mobility: State of the art and emerging trends. Sustainability 2018, 10, 2128.
- Hensher, D.A.; Ho, C.Q.; Reck, D.J. Mobility as a service and private car use: Evidence from the Sydney MaaS trial. Transp. Res. Part A Policy Pract. 2021, 145, 17–33.
- Lopez-Carreiro, I.; Monzon, A.; Lopez, E.; Lopez-Lambas, M.E. Urban mobility in the digital era: An exploration of travellers’ expectations of MaaS mobile-technologies. Technol. Soc. 2020, 63, 101392.
- Karlsson, M.; Sochor, J.; Aapaoja, A.; Eckhardt, J.; König, D. Deliverable 4: Impact Assessment. MAASiFiE Project Funded by CEDR. 2017. Volume 35, Issue 4. Available online: https://doi.org/10.1177/0193841x9401800105 (accessed on 8 July 2021).
- Caiati, V.; Rasouli, S.; Timmermans, H. Bundling, pricing schemes and extra features preferences for mobility as a service: Sequential portfolio choice experiment. Transp. Res. Part A Policy Pract. 2020, 131, 123–148.
- Alemi, F.; Circella, G.; Mokhtarian, P.; Handy, S. What drives the use of ridehailing in California? Ordered probit models of the usage frequency of Uber and Lyft. Transp. Res. Part C Emerg. Technol. 2019, 102, 233–248.
- Kenyon, S.; Lyons, G. The value of integrated multimodal traveller information and its potential contribution to modal change. Transp. Res. Part F Traffic Psychol. Behav. 2003, 6, 1–21.
- Haustein, S. What role does free-floating car sharing play for changes in car ownership? Evidence from longitudinal survey data and population segments in Copenhagen. Travel Behav. Soc. 2021, 24, 181–194.
- Storme, T.; De Vos, J.; De Paepe, L.; Witlox, F. Limitations to the car-substitution effect of MaaS. Findings from a Belgian pilot study. Transp. Res. Part A Policy Pract. 2020, 131, 196–205.
- Sochor, J.; Strömberg, H.; Karlsson, I.C.M. Implementing mobility as a service: Challenges in integrating user, commercial, and societal perspectives. Transp. Res. Rec. 2015, 2536, 1–9.
- Gan, H.; Ye, X. Will commute drivers switch to park-and-ride under the influence of multimodal traveler information? A stated preference investigation. Transp. Res. Part F Traffic Psychol. Behav. 2018, 56, 354–361.
- Tang, B.J.; Li, X.Y.; Yu, B.; Wei, Y.M. How app-based ride-hailing services influence travel behavior: An empirical study from China. Int. J. Sustain. Transp. 2020, 14, 554–568.
- Zhao, X.; Vaddadi, B.; Sjöman, M.; Hesselgren, M.; Pernestål, A. Key barriers in MaaS development and implementation: Lessons learned from testing Corporate MaaS (CMaaS). Transp. Res. Interdiscip. Perspect. 2020, 8, 100227.
- Li, T.; Chen, P.; Tian, Y. Personalized incentive-based peak avoidance and drivers’ travel time-savings. Transp. Policy 2021, 100, 68–80.
- Bian, J.; Li, W.; Zhong, S.; Lee, C.; Foster, M.; Ye, X. The end-user benefits of smartphone transit apps: A systematic literature review. Transp. Rev. 2021, 1–20.
- Song, C.; Guan, W.; Ma, J. Potential travel cost saving in urban public-transport networks using smartphone guidance. PLoS ONE 2018, 13, e0197181.
- Lyons, G.; Hammond, P.; Mackay, K. The importance of user perspective in the evolution of MaaS. Transp. Res. Part A Policy Pract. 2019, 121, 22–36.
- Romero, C.; Monzón, A.; Alonso, A.; Julio, R. Added value of a customized transit app for metropolitan bus trips. Transp. Res. Procedia 2020, 47, 513–520.
- Wessel, N.; Allen, J.; Farber, S. Constructing a routable retrospective transit timetable from a real-time vehicle location feed and GTFS. J. Transp. Geogr. 2017, 62, 92–97.
- Sarker, R.I.; Kaplan, S.; Anderson, M.K.; Haustein, S.; Mailer, M.; Timmermans, H.J.P. Obtaining transit information from users of a collaborative transit app: Platform-based and individual-related motivators. Transp. Res. Part C Emerg. Technol. 2019, 102, 173–188.
- Mulley, C.; Nelson, J.D.; Wright, S. Community transport meets mobility as a service: On the road to a new a flexible future. Res. Transp. Econ. 2018, 69, 583–591.
- Xu, R.; Frey, R.M.; Fleisch, E.; Ilic, A. Understanding the impact of personality traits on mobile app adoption—Insights from a large-scale field study. Comput. Hum. Behav. 2016, 62, 244–256.
- Karlsson, I.C.M.; Mukhtar-Landgren, D.; Smith, G.; Koglin, T.; Kronsell, A.; Lund, E.; Sarasini, S.; Sochor, J. Development and implementation of Mobility-as-a-Service—A qualitative study of barriers and enabling factors. Transp. Res. Part A Policy Pract. 2020, 131, 283–295.
- Mehdizadeh Dastjerdi, A.; Kaplan, S.; de Abreu e Silva, J.; Nielsen, O.A.; Pereira, F.C. Participating in environmental loyalty program with a real-time multimodal travel app: User needs, environmental and privacy motivators. Transp. Res. Part D Transp. Environ. 2019, 67, 223–243.
- Jittrapirom, P.; Caiati, V.; Feneri, A.M.; Ebrahimigharehbaghi, S.; Alonso-González, M.J.; Narayan, J. Mobility as a service: A critical review of definitions, assessments of schemes, and key challenges. Urban Plan. 2017, 2, 13–25.
- Chang, S.K.J.; Chen, H.Y.; Chen, H.C. Mobility as a service policy planning, deployments and trials in Taiwan. IATSS Res. 2019, 43, 210–218.
- Gärling, T.; Bamberg, S.; Friman, M.; Fujii, S.; Richter, J. Implementation of Soft Transport Policy Measures to Reduce Private Car Use in Urban Areas. Geography 2008, 5, 1–12.
- Gössling, S. ICT and transport behavior: A conceptual review. Int. J. Sustain. Transp. 2018, 12, 153–164.
- Buningh, S.; Venema, A.; Martijnse-Hartikka, R. MOBI-Promoting Smart Mobility to Employees. 2016. Available online: http://www.mobi-project.eu/site/assets/files/1071/d1_3_mobi_final_report_-_results_and_lessons.pdf (accessed on 15 June 2021).
- Semanjski, I.; Aguirre, A.J.L.; De Mol, J.; Gautama, S. Policy 2.0 platform for mobile sensing and incentivized targeted shifts in mobility behavior. Sensors 2016, 16, 1035.
- Bowden, H.; Hellen, G. A Data Driven, Segmentation Approach to Real World Travel Behaviour Change, Using Incentives and Gamification; Springer International Publishing: Berlin/Heidelberg, Germany, 2018; ISBN 9783319997568.
- Kelpin, R.; Giesel, F.; Heinrichs, M. Streetlife Field Trials—Applied Gamification Approaches as a Key to More Sustainable Mobility Behaviour. In Proceedings of the European Transport Conference 2016, Barcelona, Spain, 5–7 October 2016.
- Cellina, F.; Bucher, D.; Mangili, F.; Simão, J.V.; Rudel, R.; Raubal, M. A large scale, app-based behaviour change experiment persuading sustainable mobility patterns: Methods, results and lessons learnt. Sustainability 2019, 11, 2674.
- Cellina, F.; Vittucci Marzetti, G.; Gui, M. Self-selection and attrition biases in app-based persuasive technologies for mobility behavior change: Evidence from a Swiss case study. Comput. Hum. Behav. 2021, 125, 106970.
- Anable, J.; Wright, S. Work Package 7 Golden Questions and Social Marketing Guidance Report Authors: Dr. Jillian Anable and Dr. Steve Wright (University of Aberdeen) GOLDEN QUESTIONS REPORT. Intellegent Energy Europe. 2017. Available online: https://civitas.eu/sites/default/files/segment_deliverable_7.8.4_golden_questions_and_social_marketing_guidance_report.pdf (accessed on 23 May 2021).
More
Information
Subjects:
Transportation
Contributor
MDPI registered users' name will be linked to their SciProfiles pages. To register with us, please refer to https://encyclopedia.pub/register
:
View Times:
2.0K
Revisions:
2 times
(View History)
Update Date:
25 Jan 2022
Table of Contents


Notice
You are not a member of the advisory board for this topic. If you want to update advisory board member profile, please contact office@encyclopedia.pub.
OK
Confirm
Only members of the Encyclopedia advisory board for this topic are allowed to note entries. Would you like to become an advisory board member of the Encyclopedia?
Yes
No
${ textCharacter }/${ maxCharacter }
Submit
Cancel
Back
Comments
${ item }
|
${ item.createdUser.fullName }
${ item.createdAt }
${ item.vote }
${ item.reply }
Delete
${ reply.createdUser.fullName }
${ reply.createdAt }
${ reply.vote }
Delete
There is no reply to this comment~
${ item.replyTextCharacter }/${ item.replyMaxCharacter }
Submit
Cancel
More
No more~
There is no comment~
${ textCharacter }/${ maxCharacter }
Submit
Cancel
${ selectedItem.replyTextCharacter }/${ selectedItem.replyMaxCharacter }
Submit
Cancel
Confirm
Are you sure to Delete?
Yes
No