Your browser does not fully support modern features. Please upgrade for a smoother experience.

Submitted Successfully!
Thank you for your contribution! You can also upload a video entry or images related to this topic.
For video creation, please contact our Academic Video Service.
| Version | Summary | Created by | Modification | Content Size | Created at | Operation |
|---|---|---|---|---|---|---|
| 1 | Anyou Wang | + 1101 word(s) | 1101 | 2022-01-19 07:23:09 | | | |
| 2 | Anyou Wang | Meta information modification | 1101 | 2022-01-19 18:54:05 | | | | |
| 3 | Anyou Wang | Meta information modification | 1101 | 2022-01-19 19:01:47 | | | | |
| 4 | Dean Liu | Meta information modification | 1101 | 2022-01-20 01:33:51 | | |
Video Upload Options
We provide professional Academic Video Service to translate complex research into visually appealing presentations. Would you like to try it?
Cite
If you have any further questions, please contact Encyclopedia Editorial Office.
Wang, A. Deep Learning Neural Network Discriminate Multi-Cancer Types. Encyclopedia. Available online: https://encyclopedia.pub/entry/18517 (accessed on 07 February 2026).
Wang A. Deep Learning Neural Network Discriminate Multi-Cancer Types. Encyclopedia. Available at: https://encyclopedia.pub/entry/18517. Accessed February 07, 2026.
Wang, Anyou. "Deep Learning Neural Network Discriminate Multi-Cancer Types" Encyclopedia, https://encyclopedia.pub/entry/18517 (accessed February 07, 2026).
Wang, A. (2022, January 19). Deep Learning Neural Network Discriminate Multi-Cancer Types. In Encyclopedia. https://encyclopedia.pub/entry/18517
Wang, Anyou. "Deep Learning Neural Network Discriminate Multi-Cancer Types." Encyclopedia. Web. 19 January, 2022.
Copy Citation
Detecting cancers at early stages can dramatically reduce mortality rates. Therefore, practical cancer screening at the population level is needed. Researchers employ artificial deep learning neural networks (NN) and noncoding RNA biomarkers to develop an accurate cancer detection system, with >96% AUC for binarily detecting cancers vs normal.
cancer
noncoding RNA
artificial intelligence
deep learning
neural network
discrimination
1. Cancer and Healthy Object Discrimination
One primary requirement of cancer screening is to discriminate cancers from healthy objects, regardless of cancer type. This requires a set of universal biomarkers for all types of cancers at all stages and conditions, which ensures that cancer discrimination is not confounded by inappropriate specific variables. This group previously developed algorithms to identify 56 noncoding RNAs universal for 26 cancer types after removing all specific effects, such as cancer stage, age, sex, alcohol, smoking, and site location[1].
Here, researchers used these 56 noncoding RNAs as biomarkers and built a NN model by using Keras Sequential library from TensorFlow v2.4.1 with one hidden layer (materials and methods, programming code shown in https://combai.org/ai/cancerdetection/, accessed on 29 November 2021) to binarily classify cancer vs. normal[2]. In total, 8425 cancer and 632 normal samples measured by TCGA were used (Figure 1B). To avoid over-fitting, researchers designed test and validation sets independent from the training samples and randomly split all 9057 samples into three sub-groups: test, validation, and training. The whole model stabilized at epoch 30 based on loss of training and validation (all result plots are shown in the project website https://combai.org/ai/cancerdetection/, accessed on 29 November 2021), and thus the whole system was run for 30 epochs to estimate the prediction accuracy.
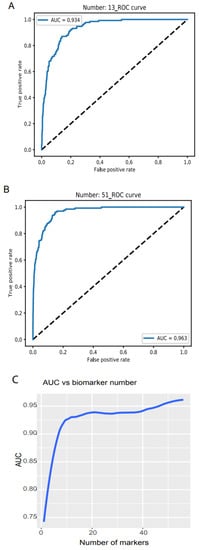
Researchers examined the model accuracy, loss, and AUC for a series of biomarker numbers accumulated from 1 to 56. When the biomarker number accumulated to 13, the loss declined to 0.14 and 0.15, respectively (https://combai.org/ai/plotresult/, accessed on 29 November 2021), the accuracy of training and validation both reached 0.95, and the AUC reached 0.934 (Figure 2A). When 51 biomarkers were combined, the loss for training and validation went down to 0.10 and 0.15, respectively (https://combai.org/ai/plotresult/, accessed on 29 November 2021), the accuracy of both training and validation reached 0.96, and the AUC stabilized at 0.963 (Figure 2B).

Figure 2. Binary discrimination of cancer and normal. Noncoding RNA biomarkers and deep learning neural network accurately discriminate 26 cancers from healthy objects. (A) Neural network model ROC curve of 13 accumulated biomarkers. In total, 13 biomarkers can discriminate cancers from normal with 0.934 of AUC. (B) In total, 51 accumulated biomarkers detected cancers with 0.963 AUC. (C) AUC vs. the number of accumulated biomarkers from 1 to 56.
Plotting the AUC against the number of biomarkers provided a clear picture of the discrimination accuracy of our system (Figure 2C). While AUC was 0.75 for one biomarker, it first stabilized at 0.934 for thirteen biomarkers and rose to over 0.96 for >51 biomarkers (Figure 2C). This indicated that our system can discriminate normal vs. cancer with >0.96 AUC with 51 noncoding RNA markers.
2. Validation
To validate the performance of our classification system, researchers downloaded two independent data sets: validation 1, from the International Cancer Genome project, containing 27 cancer types (1209 samples) and normal controls (150 samples, Figure 1C, ArrayExpress #E-MTAB-5423); and validation 2, from the exoRBase 2.0 database [34] (Figure 1D).
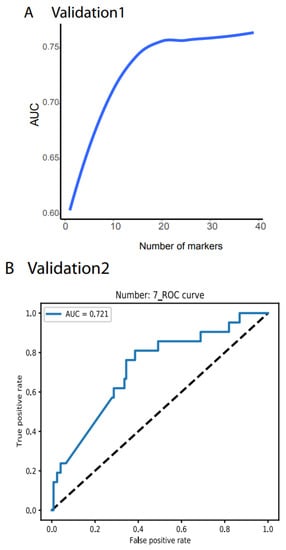
Validation 1 features much more variation and outliers than the TCGA data. Moreover, many biomarkers were not measurable, only 39 noncoding RNAs were compatible with the TCGA dataset, and the cancer types did not match those from the TCGA. However, to test the robustness of our system, we did not filter out any outlier samples and did not normalize any value. Researchers directly input the raw TPM data for all 1359 samples as the testing dataset into their NN model and obtained AUC > 78.77% (Figure 3A, all the raw data plots are shown in https://combai.org/ai/validationplot/, accessed on 29 November 2021). This indicates that their system is robust in the real world.


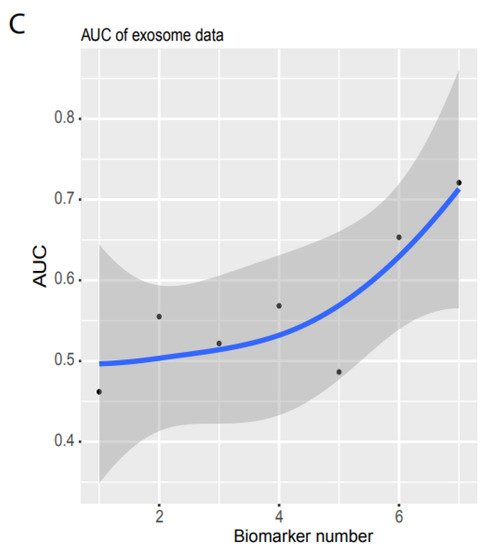
Figure 3. Independent validation. (A) Summary of AUC vs. biomarker number validated by validation data set 1 (ArrayExpress, #E-MTAB-5423, Figure 1). 39 biomarkers reached 78.77% of AUC. (B) ROC of validation data set 2 (exosome data). Seven biomarkers reached 0.721 of AUC. (C) Summary of AUC vs. biomarkers number validated by validation data set2. Gray area denotes confidence interval.
Similarly, researchers used validation 2 from an exosome database containing 12 cancer types (Figure 1D) to test their system’s performance in blood samples. Only seven noncoding RNAs matched their biomarkers, and the sample size was small (596 cancer and 118 healthy samples, Figure 1D). However, to examine the robustness of our system, researchers still used the raw TPM data to test their NN model. Researchers found that their system with seven biomarkers reached an AUC of 0.72 (Figure 3B,C) although the deviation was large (gray area, Figure 3C). This indicated that their system was not stable with a small number of biomarkers, but it was promising as a measurement of blood samples.
3. Performance Comparison of their Model with Other Mathematical Models
To compare the performance of their model with other mathematical models, they ran an independent test and measured the AUCs for three models, neural network (NN), random forest (RF), and decision trees (TD). RF is a supervised machine learning approach that randomly selects sub-samples to create trees and uses an average of tree prediction votes to predict unknown samples (https://scikit-learn.org/stable/modules/generated/sklearn.ensemble.RandomForestClassifier.html, accessed on 29 November 2021), while TD is a non-parametric supervised machine learning algorithm that learns simple decision rules from training data features to make predictions (https://scikit-learn.org/stable/modules/tree.html, accessed on 29 November 2021).
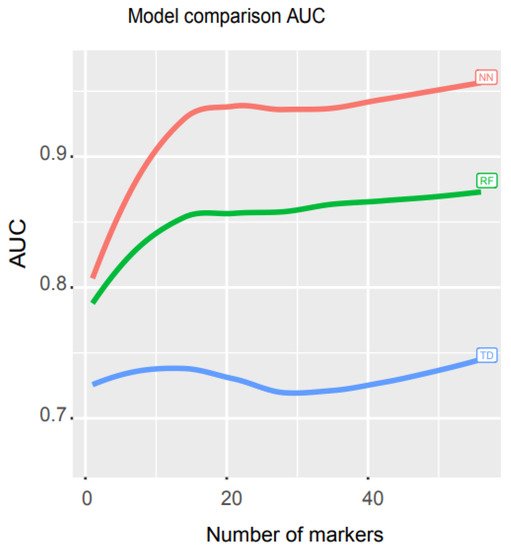
Researchers used libraries from Scikit-learn to build a pipeline (programming code https://combai.org/ai/cancerdetection/, accessed on 29 November 2021) and systematically run these three models with the same training and test data to make the results comparable. The AUC plot showed that the AUC of their NN model was significantly higher than the other two models (p-value < 2.2e-16, Kruskal–Wallis rank sum test, Figure 4, raw data plot https://combai.org/ai/modelcomparisonplot/, accessed on 29 November 2021). With 10 biomarkers, their NN model reached an AUC of 0.9, while RF and TD only achieved 0.84 and 0.74, respectively. In addition, their NN model could reach up to 0.96 of AUC, but RF and TD never went beyond 0.87 and 0.75, respectively (Figure 4). These results indicated that their NN model outperformed the other two models.

Figure 4. Math model comparisons. AUC comparison of three math models, artificial neural network (NN), random forest (RF), and decision trees (TD). NN outperformed the other two models.
This system depends on NN and noncoding RNAs. NN can be pre-programmed and installed in a webserver and any one can easily access and operate it. Noncoding RNAs can be simply measured by PCR, with cheap price. Therefore, this system can become a practical system for cancer screening at population level.
References
- Wang, Anyou; Noncoding RNAs Serve as the Deadliest Universal Regulators of all Cancers. Cancer Genomics & Proteomics 2021, 18, 43-52, https://doi.org/10.21873/cgp.20240.
- Wang, Anyou; Noncoding RNAs and Deep Learning Neural Network Discriminate Multi-Cancer Types. Cancers 2022, 14(2), 352, https://doi.org/10.3390/cancers14020352.
More
Information
Contributor
MDPI registered users' name will be linked to their SciProfiles pages. To register with us, please refer to https://encyclopedia.pub/register
:
View Times:
1.2K
Revisions:
4 times
(View History)
Update Date:
20 Jan 2022
Notice
You are not a member of the advisory board for this topic. If you want to update advisory board member profile, please contact office@encyclopedia.pub.
OK
Confirm
Only members of the Encyclopedia advisory board for this topic are allowed to note entries. Would you like to become an advisory board member of the Encyclopedia?
Yes
No
${ textCharacter }/${ maxCharacter }
Submit
Cancel
Back
Comments
${ item }
|
More
No more~
There is no comment~
${ textCharacter }/${ maxCharacter }
Submit
Cancel
${ selectedItem.replyTextCharacter }/${ selectedItem.replyMaxCharacter }
Submit
Cancel
Confirm
Are you sure to Delete?
Yes
No


