Your browser does not fully support modern features. Please upgrade for a smoother experience.
Submitted Successfully!
 +1 credit
Thank you for your contribution! You can also upload a video entry or images related to this topic.
For video creation, please contact our Academic Video Service.
| Version | Summary | Created by | Modification | Content Size | Created at | Operation |
|---|---|---|---|---|---|---|
| 1 | Sayako Sakama | + 2581 word(s) | 2581 | 2022-01-10 07:08:58 | | | |
| 2 | Conner Chen | Meta information modification | 2581 | 2022-01-20 04:26:22 | | |
Video Upload Options
We provide professional Academic Video Service to translate complex research into visually appealing presentations. Would you like to try it?
Cite
If you have any further questions, please contact Encyclopedia Editorial Office.
Sakama, S. Trends of Motor Characteristics. Encyclopedia. Available online: https://encyclopedia.pub/entry/18480 (accessed on 16 July 2026).
Sakama S. Trends of Motor Characteristics. Encyclopedia. Available at: https://encyclopedia.pub/entry/18480. Accessed July 16, 2026.
Sakama, Sayako. "Trends of Motor Characteristics" Encyclopedia, https://encyclopedia.pub/entry/18480 (accessed July 16, 2026).
Sakama, S. (2022, January 19). Trends of Motor Characteristics. In Encyclopedia. https://encyclopedia.pub/entry/18480
Sakama, Sayako. "Trends of Motor Characteristics." Encyclopedia. Web. 19 January, 2022.
Copy Citation
It is important to comprehensively evaluate which type of motor is most suitable when designing mechanical systems. This paper presents the results of a survey of the performance of electric and hydraulic servo motors which are commonly used in many mechanical systems and aims to provide quantitative data that can be used as a reference for selecting appropriate motors. We collected data on the characteristics of electric and hydraulic motors and compared and evaluated the characteristics of these servo motors using indexes such as torque, rotating speed, output power, power density, and power rate.
electric motor
hydraulic motor
power density
power rate
torque
weight
1. Power Density
Figure 1 shows the transition of the power densities of hydraulic and electric motors. The horizontal and vertical axes indicate the year in which the motor data were published and the power density of the motor, respectively. Note that the scale of the power density is logarithmic.
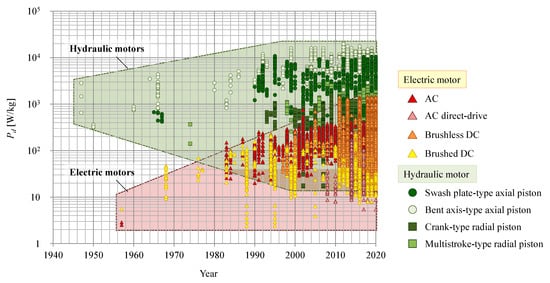
Figure 1. Transition of power density in electric and hydraulic motors.
Hydraulic motors have a higher power density than electric motors; however, this difference has become progressively smaller over time. Before the 1990s, the power density of hydraulic motors was approximately two orders of magnitude greater than that of electric motors, but the performance of electric motors has dramatically improved over the decades; thus, nowadays, the difference between hydraulic and electric motors is only around one order of magnitude.
One of the main factors accounting for the improved performance of electric motors is the increase in the strength of permanent magnets. The transition of the maximum energy products of permanent magnets, together with the power density of electric motors, is shown in Figure 2. It is clear that the power density of the electric motors increased following the development of permanent magnets with high-maximum-energy products. In particular, the advent of the neodymium magnet, developed by Sagawa in 1984 [1], resulted in major improvements in motor performance. Since the 1970s, the performance of electric motors has increased as social needs, such as resource and energy conservation and improved productivity, have increased, accelerating the shift away from hydraulic motors, which had previously been mainstream, to electric motors. In addition, although the brushed DC motor had initially been widely used, AC motors became more common because of improvements in the performance of microcomputers and circuit elements used in inverters during the 1980s [2]. Moreover, during the 1990s, the power density of the AC motors was further enhanced by improvement of the winding method and innovative changes in the design and structure of motors [3]. Another remarkable point in this figure is the development of the brushless DC motor. The power density of brushless DC motors, which have been popular since the 1990s, has increased more than ten times in approximately 20 years, and brushless DC motors are now the electric motors with the highest power density.
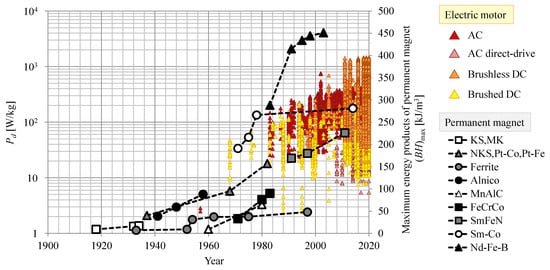
Figure 2. Transition of power density in electric motors and maximum energy products of permanent magnets.
Although the progress in electric motors is remarkable, the power density of hydraulic motors has also increased over the last few decades. The increased power density of hydraulic motors is linked to their increasing rated pressure. Figure 3 shows the power density of the hydraulic motors plotted in Figure 1, along with their 10-year average rated pressure. In this figure, the scale is not logarithmic. The rated pressures of hydraulic motors have increased by approximately three times since the 1940s, and this has been accompanied by an increase in power density.
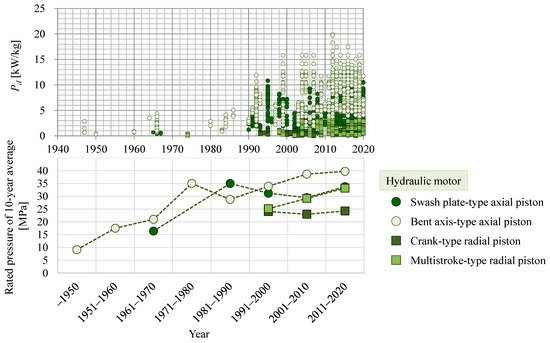
Figure 3. Transition of power density and rated pressure of hydraulic motors.
Although the power densities of electric and hydraulic motors have increased over the past several decades, it is also clear that the performance of electric motors has not changed significantly in the last 10 years, whereas hydraulic motor performance has changed little in the last 30 years.
2. Weight and Torque
The transitions of motor weight and torque are shown in Figure 4 and Figure 5, respectively. Since the 1990s, electric motors, especially brushless DC motors, have become significantly lighter. It is clear that the aforementioned technological improvements in electric motors have substantively contributed to their miniaturization, and, consequently, the power density of electric motors has increased. In addition, with regard to AC motors, their weights have become both lighter and heavier; indeed, some are comparable to the heaviest hydraulic motors. It can thus be inferred that one of the major factors behind the development of heavy electric motors was an increased demand for the electrification of hydraulic systems. However, heavy electric motors have less torque than comparable hydraulic motors. Although large electric motors with high power have been developed, it remains difficult for modern electric motors to produce as much force as comparable hydraulic motors. Regarding hydraulic motors, the use of such relatively large motors has not changed for many years, and their weight and rated torque have not changed significantly. Small hydraulic motors less than 1 kg in weight have also been developed but are relatively few.
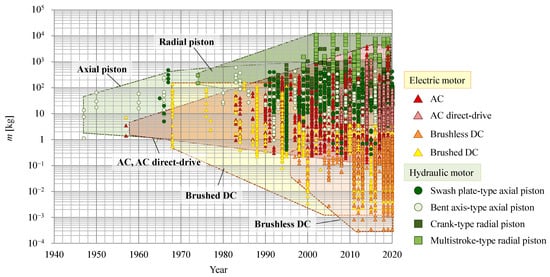
Figure 4. Transition of motor weight.
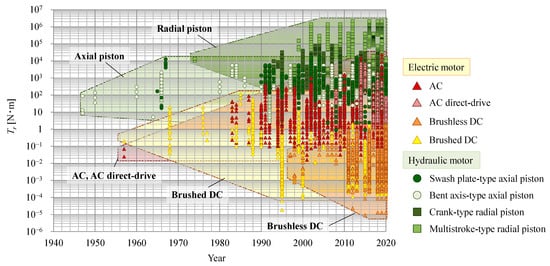
Figure 5. Transition of rated torque.
3. Power Rate and Power Rate Density
Figure 6 and Figure 7 show the advancement of the power rate and power rate density, respectively, of electric and hydraulic motors.
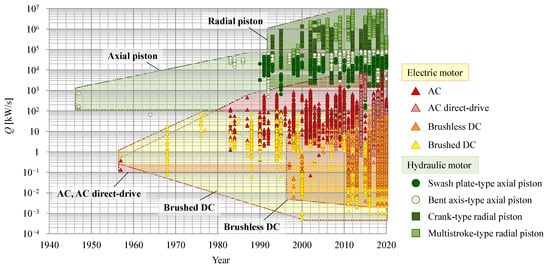
Figure 6. Transition of power rate.
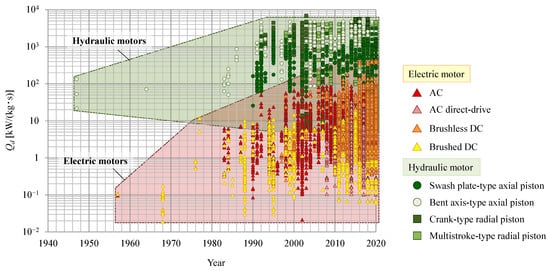
Figure 7. Transition of power rate density.
The power rate of hydraulic motors has not changed significantly with time, although that of radial piston motors has increased slightly. On the other hand, the power rate of electric motors has tended to increase, with the exception of DC motors. Moreover, differences in the transitions between hydraulic and electric motors become clearer when compared by power rate density. Although the power rate density of hydraulic motors has remained higher than that of electric motors for many years, the increased power rate density of electric motors is higher than that of hydraulic motors. It can be inferred that the improved performance of permanent magnets has also contributed to the increased power rate density in electric motors. The maximum power rate density of hydraulic motors is an order of magnitude greater than that of electric motors, but the power rate density of hydraulic motors has not changed since the 1990s. Therefore, the difference between these types of motor may be smaller in the future.
4. Weight–Torque
To evaluate motor characteristics in more detail, we compared the relationships between two parameters related to motor performance. Here, the comparison targets are narrowed down to currently available motors. The relationship between motor weight m and rated torque Tr is shown in Figure 8.
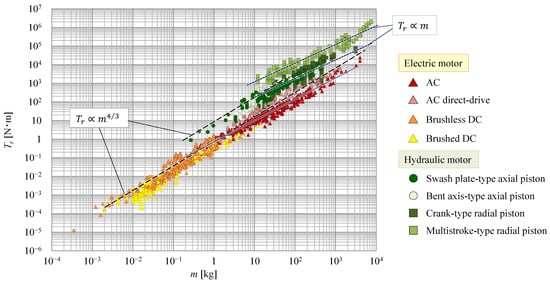
Figure 8. Correlation between weight and rated torque.
Considering motor weight, electric motors show a wide range of weight distributions, from less than 1 g to several tons. On the other hand, the range of weight distribution of hydraulic motors is relatively small, and most hydraulic motors weigh more than 1 kg. However, when comparing the torques of motors with the same weight, the torque of hydraulic motors is found to be larger than that of electric motors at the same weights.
Nakano et al. [4] inferred, from the structure of the motors, that the torque of DC servo motors is proportional to 4/3 of the power of motor weight, whereas the torque of hydraulic motors is proportional to motor weight. Their survey results demonstrate that these inferences are valid. In addition, they confirmed that AC and DC servo motors show similar trends. On the other hand, some of the survey results shown in Figure 8 differ from the results of previous studies. For example, electric motors smaller than approximately 1 kg and hydraulic motors larger than around 20–30 kg agree with the above relationship, but some AC and small-sized hydraulic motors do not. The slope of the AC motors is smaller than that of the other electric motors, whereas that of hydraulic motors smaller than approximately 20 kg is almost proportional to the 4/3 power of motor weight. This suggests that, even for the same type of motor, characteristics may differ between large and small examples. However, the torque of AC direct-drive motors is proportional to the 4/3 power of the motor weight and is larger than that of AC servo motors of similar weight. Therefore, direct-drive motors are considered to be more suitable when a large torque is required to be generated by electric motors.
Comparing hydraulic motors by type shows that although axial piston and crank piston-type radial piston motors plot almost along the same straight line, multistroke-type radial piston motors plot significantly higher. The multistroke-type radial piston motors can generate the largest torque of all the motors surveyed, nearly two orders of magnitude greater than that of the AC servo motors.
5. Rated Rotating Speed–Torque
Next, we compared the relationship between rated rotating speed Nr and rated torque Tr. These data are plotted in Figure 9. Since motor output power is calculated as the product of torque and rotating speed, it can be observed that the motors plotted in the upper right of Figure 9 have larger output powers.
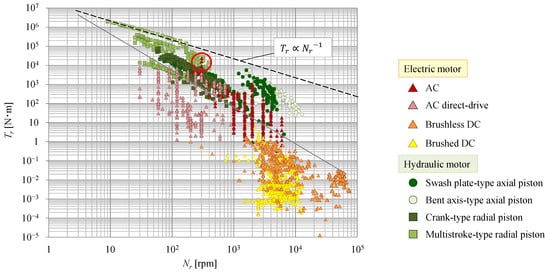
Figure 9. Correlation between rated rotating speed and rated torque.
Motor torque decreases as rotating speed increases in both hydraulic and electric motors. Moreover, the torque of hydraulic motors tends to be higher than that of electric motors, although some electric motors are comparable to hydraulic motors.
Considering this relationship in more detail, the torque of certain high-torque hydraulic motors is roughly inversely proportional to their rotating speed, but most motors have a larger slope. In other words, the faster the motor speed, the more noticeable the decrease in torque, and it becomes difficult to output a large power. Focusing on brushless DC motors, some can drive more than an order of magnitude faster than can other motors. However, the torque of brushless DC motors that rotate at the same speed as other motors is smaller than that of both AC and hydraulic motors.
Characterizing the relationship between the rotating speed and torque of motors allows an indirect evaluation of the relationship between speed and output power. Although motor weight was not considered in this evaluation, as can be seen from the evaluation in the previous section, the output power of the motor varies greatly depending on its weight. For example, the hydraulic motor plotted in the red circle in Figure 9 weighs approximately 200–400 kg, but the weight of the AC motor is around 4000 kg. In other words, electric motors are required to be ten times larger in size than hydraulic motors to output the same power at the speed of a hydraulic motor. In the next section, to evaluate this point, the relationship between motor weight and output power is considered.
6. Weight, Rotating Speed–Power, Power Density
The relationship between motor weight m and output power Pr is shown in Figure 10. Nakano et al. [4] showed that this relationship tends to be similar to the relationship between motor weight and torque, i.e., that the output power of electric motors is proportional to the 4/3 power of motor weight, whereas that of hydraulic motors is proportional to the weight. However, in Figure 10, similar to the relationship between the motor weight and torque, the tendency of AC motors and some hydraulic motors is shown to be slightly different from previous studies. The slope of the output power of AC servo motors with respect to weight is slightly smaller than that of other electric motors; indeed, it is close to linear. For hydraulic motors, output power is roughly proportional to weight, but for axial piston motors, the slope decreases above 20–30 kg. Although the slope of the output power to the weight of hydraulic motors is smaller than that of electric motors, it also can be seen that the output power of hydraulic motors is larger than that of electric motors at all sizes.
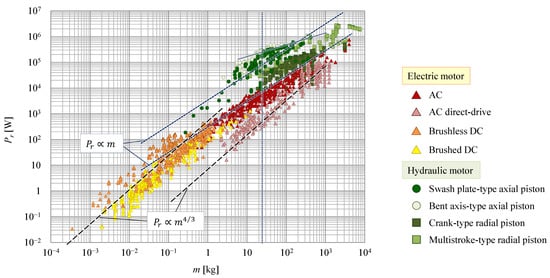
Figure 10. Correlation between motor weight and rated output power.
The ratio of output power to weight represents the power density of motors defined by Equation (1). Figure 11 shows the power density relative to the weight of the motors. This figure also indicates that the power density of hydraulic motors is higher than that of electric motors. In particular, the difference in the power density of motors with a weight of around 10 kg is noticeable, since this difference is approximately two orders of magnitude. However, as motor size increases, the difference in power density between electric and hydraulic motors decreases. To clarify differences in these large-sized motors, we considered the relationship between the rated rotating speed and power density in Figure 12a. Therefore, the plotted positions of each motor can be separated by type. Comparing the motor speeds of electric and hydraulic motors of similar power density, the speeds of electric motors are found to be faster than those of hydraulic motors. The same tendency can be seen in Figure 12b, which extracts data in the range surrounded by the red square in Figure 11, i.e., where many plots of electric and hydraulic motors overlap. The output power of the motor is calculated as the product of its speed and torque; this indicates that when the power densities of electric and hydraulic motors are similar, the choice of the most suitable motor depends on whether speed or torque is more important.
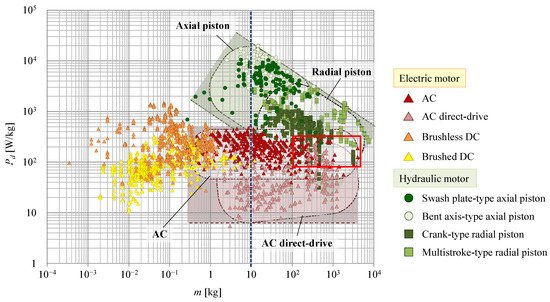
Figure 11. Correlation between motor weight and power density.
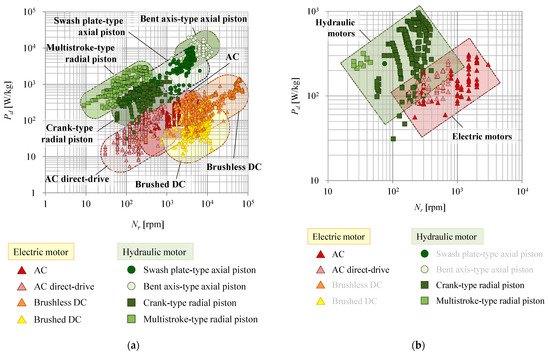
Figure 12. Correlation between rated rotating speed and power density: (a) all plots; (b) data in the range surrounded by the red square in Figure 11.
7. Power Rate and Power Rate Density
Figure 13 shows the relationship between motor weight m and power rate Q calculated by Equation (2). The power rate of hydraulic motors is larger than that of electric motors of the same weight. Moreover, although the power rate of hydraulic motors tends to be proportional to the weight of the motor, the slope is smaller when viewed by motor type. Nakano et al. [4] demonstrated that the power rate of hydraulic motors is proportional to the 1/3 power of the motor weight. In the case of electric motors, the power rate is roughly proportional to the weight, which is consistent with the trend shown by Nakano et al. [4].
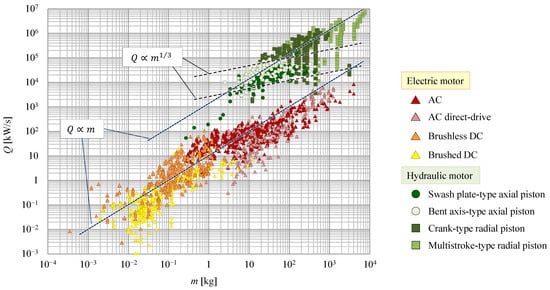
Figure 13. Correlation between motor weight and power rate.
K. Foster et al. [5] defined an index calculated by the product of the angular velocity and the square root of inertia of motors; they used this to indicate motor capacity and compared the relationship of this index with the power rate. Herein, we also organize data according to this relationship and compare motor characteristics. Figure 14 shows the relationship between the index ωJm1/2 and the power rate Q. The angular velocity ω is calculated from the rated rotating speed Nr. As can be seen by the variables used in this index, a large amount of energy can be generated when index ωJm1/2 is increased. It is clear that the power rate increases as the output energy generated by the motors increases, such that the power rate of hydraulic motors is larger than that of electric motors; this result is similar to that reported in Figure 13. The lines in Figure 14 represent the results of the survey by K. Foster et al. [5] and confirm that the power rate to output energy of hydraulic motors has increased significantly, although the corresponding change in electric motors is smaller.
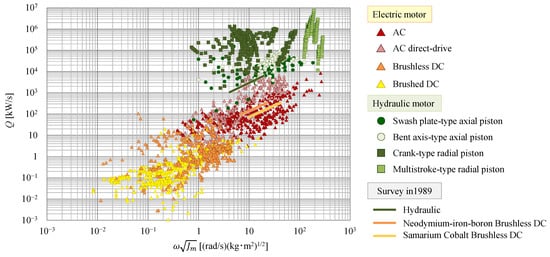
Figure 14. Correlation between output energy and power rate.
The relationship between rated output power Pr and power rate density Qd calculated by Equation (3) is shown in Figure 15. The overall tendency of hydraulic and electric motors shows that the power rate density decreases as the rated output power increases, although the power rate density of some motors tends to slightly increase in each series. However, it is important to note that the power rate densities of hydraulic motors are 10-fold or one-hundred-fold those of electric AC servo motors. We can thus evaluate that the responsiveness of hydraulic motors is higher than that of electric motors with similar weight or output power.
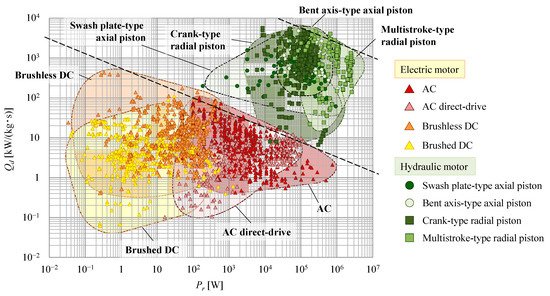
Figure 15. Correlation between rated output power and power rate density.
References
- Sagawa, M.; Fujimura, S.; Togawa, N.; Yamamoto, H.; Matsuura, Y. New material for permanent magnets on a base of Nd and Fe (invited). J. Appl. Phys. 1984, 55, 2083–2087.
- Mikami, H.; Ide, K.; Shimizu, Y.; Senoo, M.; Seki, H. Historical evolution of motor technology. Hitachi Rev. 2011, 60, 39.
- Kusuda, Y. New generation servomotors. Assem. Autom. 1999, 19, 190–196.
- Nakano, K.; Konno, Y. The comparative study on the characteristics of AC, DC Servomotors and hydraulic motors. Hydraul. Pneum. 1997, 28, 466–472.
- Foster, K.; Fenney, L. Characteristics and Dynamic Performance of Electrical and Hydraulic Servo-Drives. Proc. JFPS Int. Symp. Fluid Power 1989, 1989, 15–22.
More
Information
Subjects:
Engineering, Mechanical
Contributor
MDPI registered users' name will be linked to their SciProfiles pages. To register with us, please refer to https://encyclopedia.pub/register
:
View Times:
4.7K
Revisions:
2 times
(View History)
Update Date:
20 Jan 2022
Table of Contents


Notice
You are not a member of the advisory board for this topic. If you want to update advisory board member profile, please contact office@encyclopedia.pub.
OK
Confirm
Only members of the Encyclopedia advisory board for this topic are allowed to note entries. Would you like to become an advisory board member of the Encyclopedia?
Yes
No
${ textCharacter }/${ maxCharacter }
Submit
Cancel
Back
Comments
${ item }
|
${ item.createdUser.fullName }
${ item.createdAt }
${ item.vote }
${ item.reply }
Delete
${ reply.createdUser.fullName }
${ reply.createdAt }
${ reply.vote }
Delete
There is no reply to this comment~
${ item.replyTextCharacter }/${ item.replyMaxCharacter }
Submit
Cancel
More
No more~
There is no comment~
${ textCharacter }/${ maxCharacter }
Submit
Cancel
${ selectedItem.replyTextCharacter }/${ selectedItem.replyMaxCharacter }
Submit
Cancel
Confirm
Are you sure to Delete?
Yes
No