Your browser does not fully support modern features. Please upgrade for a smoother experience.
Submitted Successfully!
 +1 credit
Thank you for your contribution! You can also upload a video entry or images related to this topic.
For video creation, please contact our Academic Video Service.
| Version | Summary | Created by | Modification | Content Size | Created at | Operation |
|---|---|---|---|---|---|---|
| 1 | Boon Chin Tan | + 2910 word(s) | 2910 | 2022-01-18 10:26:19 | | | |
| 2 | Vivi Li | Meta information modification | 2910 | 2022-01-19 10:28:01 | | |
Video Upload Options
We provide professional Academic Video Service to translate complex research into visually appealing presentations. Would you like to try it?
Cite
If you have any further questions, please contact Encyclopedia Editorial Office.
Tan, B.C. Pandanus amaryllifolius in Response to Drought Stress. Encyclopedia. Available online: https://encyclopedia.pub/entry/18475 (accessed on 29 July 2026).
Tan BC. Pandanus amaryllifolius in Response to Drought Stress. Encyclopedia. Available at: https://encyclopedia.pub/entry/18475. Accessed July 29, 2026.
Tan, Boon Chin. "Pandanus amaryllifolius in Response to Drought Stress" Encyclopedia, https://encyclopedia.pub/entry/18475 (accessed July 29, 2026).
Tan, B.C. (2022, January 19). Pandanus amaryllifolius in Response to Drought Stress. In Encyclopedia. https://encyclopedia.pub/entry/18475
Tan, Boon Chin. "Pandanus amaryllifolius in Response to Drought Stress." Encyclopedia. Web. 19 January, 2022.
Copy Citation
Drought is one of the significant threats to the agricultural sector. However, there is limited knowledge on plant response to drought stress and post-drought recovery. Pandanus amaryllifolius, a moderate drought-tolerant plant, is well-known for its ability to survive in low-level soil moisture conditions. Understanding the molecular regulation of drought stress signaling in this plant could help guide the rational design of crop plants to counter this environmental challenge.
antioxidant enzymes
drought stress
Pandanus amaryllifolius
proteomics
stress-responsive proteins
TMT-labelled LCMS/MS
1. Introduction
Drought stress is a significant threat to agricultural productivity worldwide, causing 83% of agricultural economic losses. About US$29 billion was lost from all combined agriculture damages due to natural disasters [1]. Drought has affected the rice grain yield and caused about US$840 million losses in several rice-producing regions in Thailand [2]. In Malaysia, a 12–51% reduction in rice yield due to drought stress was reported from 2007 to 2011 [3]. Moreover, an expanding world population increases pressure on agriculture to use water more efficiently. Hence, it is indispensable to understand the drought response and adaptive mechanisms of plants as it could help to improve crop performance under drought stress conditions.
Drought stress disturbs physiological and biochemical processes in plants, including cell membrane, disrupting transportation of solutes, photosynthesis rate, nutrient uptake, translocation, and causes electron leakage and excessive accumulation of reactive oxygen species (ROS) [4][5]. The impacts of drought stress on plants rely on the severity and the growth period of plants [6]. To cope with these adverse effects, plants have developed intricate responses and adaptive strategies. These include the overproduction of compatible osmolytes, alteration of endogenous hormonal levels, and regulation of physiological and molecular changes [7]. Under moderate drought conditions, plants respond and adapt by altering root architecture [8] and stomatal closure [9], hoping to maintain a balance between stress tolerance and growth. However, if drought conditions become severe, plants tend to activate protection mechanisms against cellular damage, adjust in vivo antioxidant enzyme systems to eliminate excessive ROS, and accumulate proteins to maintain cell turgor, aiming to survive under such conditions [9].
Extensive efforts have been made to understand the plant responsive and adaptive mechanisms to drought stress using different “omics” techniques. Proteomics approaches have been used to determine plants’ proteome responses under drought stress. For instance, Liu et al. determined the protein changes of mulberry in response to drought stress using tandem mass tags (TMT)-label LCMS/MS technique [10]. The authors found that proteins involved in photosynthesis, energy and sugar metabolisms, antioxidant production, hormones, and cell homeostasis were abundantly changed under drought conditions. Using the same technique, Xiao et al. identified 123 differentially changed proteins between 30-d drought-stressed cotton fine roots and control [11]. The number of proteins was increased to 1273 when cotton was exposed to 45-d drought treatment. Goche et al. reported that 237 and 187 root proteins were significantly altered in drought-susceptible and drought-tolerant sorghum varieties, respectively [12]. Other proteomics drought studies have also been reported on chickpea [13], grapevine [14], wheat [15], and banana [16].
Pandanus amaryllifolius is a member of the screw pine family Pandanaceae. This plant is commonly known as fragrant screw pine, pandan (Malaysia and Indonesia), pandan mabango (Philippines), and toei hom (Thailand). P. amaryllifolius is widely cultivated in Southeast Asia, such as in Thailand, Indonesia, and Malaysia. The pandan plants grow in clumps with leaf size reaching 40–80 cm tall and a width of about 4.5 cm. Its leaves are dark green with sharp spines on the margins and are commonly used as food flavoring, natural colorants, and herbal medicine. Besides its aromatic value, P. amaryllifolius leaves have also been found to contain phenolic compounds that possess health benefits. For instance, Ghasemzadeh and Jaafar reported that gallic acid and cinnamic acid isolated from P. amaryllifolius could inhibit 78% of breast cancer MCF-7 cell lines [17]. In addition, metabolic syndromes, such as weight gain, abdominal adipose tissue deposition, and blood pressure, can be reduced after treatment with the leaf extract of P. amaryllifolius [18].
Pandanus spp. is a moderate drought-tolerant plant [19]. For example, P. tectorius can survive in drought conditions for more than 6 months, whereas P. odaritissimus can survive under an area with rainfall of less than 2,000 mm annually [20]. However, there is insufficient information on the extent of the drought tolerance of P. amaryllifolius despite its medicinal value. Understanding the plant’s strategy to adapt and survive under drought stress may refine our understanding of drought stress responses in plants and help to develop drought-tolerant crops.
2. Morphological Changes of Drought-Stressed Pandanus amaryllifolius
Our earlier preliminary experiment which exposed Pandanus plants to drought stress conditions for up to one month revealed that the plants could not survive after 14 days (data not shown). Hence, in the current study, we determined the early- to mid-drought response of Pandanus plants. At the morphological level, the changes of Pandanus plants in response to drought stress at several time intervals were determined (Figure 1A). The percentage of leaf relative water content (LRWC) for drought-stressed samples was significantly reduced after 4 days of drought treatment, whereas the percentage of relative electrolyte leakage (REL) for drought-stressed samples was significantly increased after 10 days of drought treatment (Figure 1B,C). The fresh and dry weights of shoots and roots in well-watered plants were generally higher than drought-stressed Pandanus (Figure 1D–G). Surprisingly, the root dry weight of the 7-day drought-stressed plants was significantly higher compared to well-watered plants (Figure 1G). Similarly, the root-to-shoot ratio of the 7-day drought-stress samples was higher than well-watered plants (Figure 1H). However, the chlorophyll a, chlorophyll b, total chlorophyll and carotenoid contents of the drought-stress samples were significantly reduced compared to well-watered plants (Figure 2A–D). After rewatering, only 7-day drought-stressed Pandanus plants were able to recover (Figure 3A). Hence, day 7 of drought treatment was selected for the subsequent experiments.
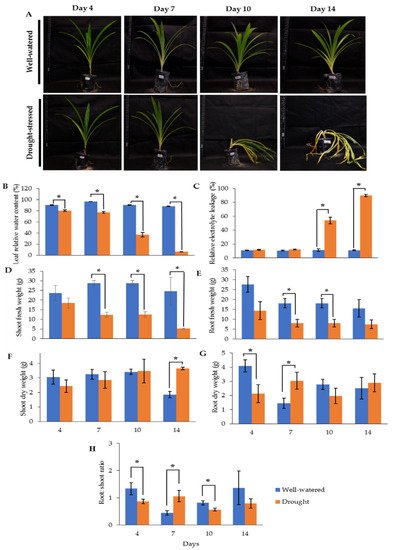
Figure 1. Responses of drought-stressed and well-watered Pandanus amaryllifolius. P. amaryllifolius plants were subjected to drought stress by withholding water for 4, 7, 10, and 14 days. Well-watered P. amaryllifolius was served as control. (A) Photographs of Pandanus plants were taken at 4, 7, 10, and 14 days. (B) The percentage of LRWC of P. amaryllifolius leaves at different time points. (C) The percentage of REL for each sample at different harvest points. (D) Shoot fresh weight of Pandanus. (E) Root fresh weight of Pandanus. (F) Shoot dry weight of Pandanus. (G) Root fresh weight of Pandanus. (H) Root-to-shoot ratio of Pandanus dry weight. Means labeled with asterisk were significantly different based on the Student’s t-test when its p-value < 0.01.
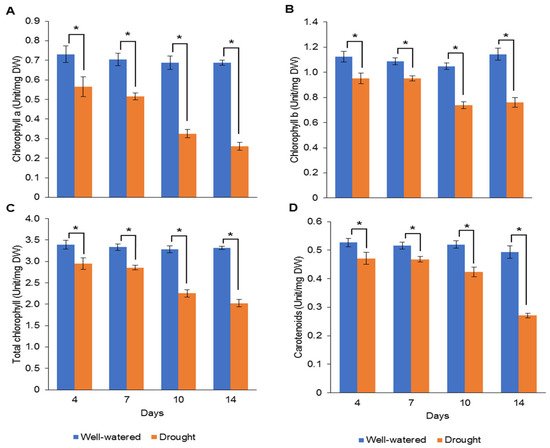
Figure 2. Pigment contents of leaf samples for well-watered and drought-stressed Pandanus amaryllifolius at different timepoints. The concentrations of (A) chlorophyll a (U mg−1 DW), (B) chlorophyll b (U mg−1 DW), (C) total chlorophyll (U mg−1 DW), and (D) carotenoid (U mg−1 DW). Means labeled with asterisk (*) were significantly different based on the Student’s t-test when its p-value < 0.01.
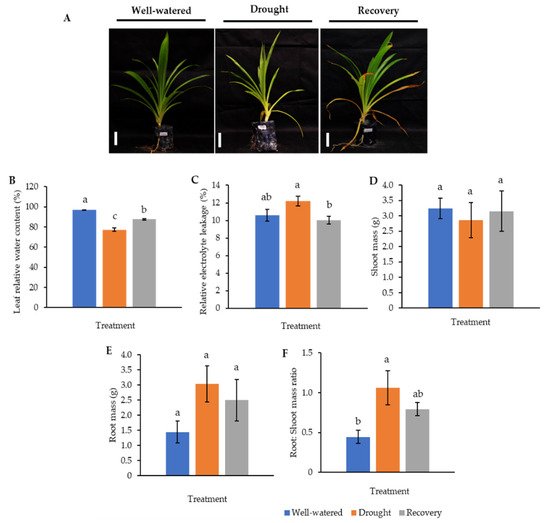
Figure 3. Comparison of well-watered, drought-stressed, and water-recovered Pandanus amaryllifolius plants. (A) Pandanus plants were subjected to drought stress by withholding water for 7 days, whereas the water-recovered plants were rewatered after a 7-day drought treatment and rewatered for 7 days. Well-watered P. amaryllifolius served as control. The line bar indicates the scale of the plant = 10 cm. (B) The percentage of leaf relative water content of P. amaryllifolius leaves. (C) The percentage of relative electrolyte leakage for each sample. (D) Shoot mass of P. amaryllifolius. (E) Root mass of P. amaryllifolius. (F) Root-to-shoot mass ratio of P. amaryllifolius. Means labeled with alphabet were significantly different based on the ANOVA followed by post hoc when its p-value < 0.05.
To understand the drought-responsive mechanism of Pandanus plants, a new set of experiments comprising well-watered, 7-day drought-stressed, as well as 7-day drought-stressed and rewatered plants was conducted since 10-day drought-stressed samples were unable to recover after rewatering. These samples were also subjected to morphological, biochemical, and proteomics analysis.
The LRWC in Pandanus plants was decreased with decreasing soil moisture content (Figure 3 and Figure S1). In particular, the drought-stressed Pandanus plants showed a 20% reduction compared to well-watered plants but recorded comparable LRWC with well-watered plants after rewatering (Figure 3B). The REL of the drought-stressed samples was higher than the well-watered and recovered plants (Figure 3C). The imposed drought stress did not affect the mass of both shoots and roots (Figure 3D,E). However, the root-to-shoot ratio in drought-stressed Pandanus was significantly higher than other treatments (Figure 3F). The pigment content of leaf samples in the drought-stressed Pandanus plants was significantly decreased (Figure 4A–D). It is worth mentioning that the leaf chlorophyll and carotenoid contents of the recovered plants were the same as drought-stressed plants, which could be related to insufficient recovery time (Figure 4A–D).
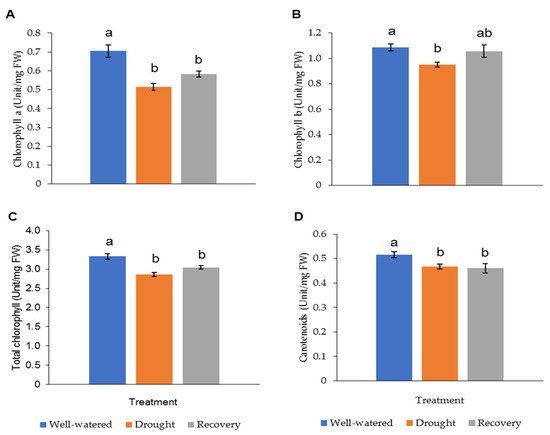
Figure 4. Pigment content of leaf samples for well-watered, drought-stressed, and recovered Pandanus amaryllifolius. The concentrations of (A) chlorophyll a (U mg−1 DW), (B) chlorophyll b (U mg−1 DW), (C) total chlorophyll (U mg−1 DW), and (D) carotenoids (U mg−1 DW). Means labeled with alphabet were significantly different based on the ANOVA followed by post hoc when its p-value < 0.05.
The Pandanus leaves showed slight wilting and clamping after 7 days of drought treatment but recovered after rewatering. However, there was a browning effect observed on the tips of mature leaves (Figure S2A). The yellow-green leaf color pigment pixel percentage in drought-stressed and recovered plants was slightly higher than well-watered plants (Figure S2B).
3. Changes of Proline and Malondialdehyde Contents in Pandanus Plants under Drought Stress
Proline, being an osmoprotectant, is involved in protecting plants from harmful effects caused by environmental stresses. Malondialdehyde (MDA), which results from the breakdown of polyunsaturated fatty acids, is the product of membrane lipid peroxidation. Both proline and MDA serve as an indicator of stress tolerance. In this study, the proline content of the drought-stressed Pandanus plants (1.6 μM g−1 FW) was significantly higher than well-watered (1.3 μM g−1 FW) and recovered plants (0.8 μM g−1 FW) (Figure 5A). Similarly, the MDA content of the drought-stressed Pandanus plants was the highest (9.2 nM g−1 FW) (Figure 5B). The well-watered and recovered samples recorded the same MDA content (7.7 nM g−1 FW).
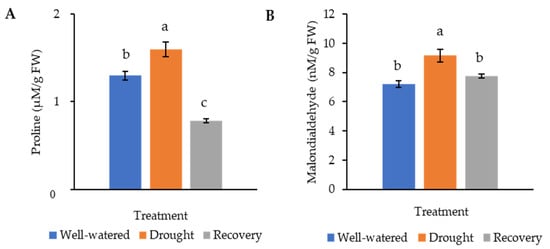
Figure 5. Osmolyte and lipid peroxidation changes of the drought-stressed and well-watered Pandanus amaryllifolius. (A) Proline content of P. amaryllifolius leaves as quantified in µM g−1 fresh weight (FW). (B) Malondialdehyde (MDA) content of P. amaryllifolius leaves as quantified in µM g−1 FW. Means labeled with alphabet were significantly different based on the ANOVA followed by post hoc when its p-value < 0.05.
4. Antioxidant Enzyme Changes in Pandanus Plants in Response to Drought Stress
Drought stress generally increases the activity of antioxidant enzymes. The highest hydrogen peroxide (H2O2) (30.0 μM min−1 g−1) and superoxide dismutase (SOD) (462.1 g−1 FW) levels were recorded in water-recovered plants (Figure 6A,B). Catalase (CAT) and peroxidase (POD) for both well-watered and recovered plants showed significantly higher activity than for drought-stressed plants (Figure 6C,D). The highest activity of ascorbate peroxidase (APX) (10.4 M min−1 g−1) and glutathione reductase (GR) (126.0 M min−1 g−1) was found in drought-stressed samples (Figure 6E,F).
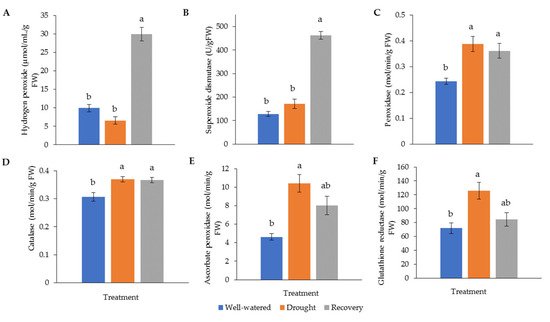
Figure 6. Activity of (A) hydrogen peroxide (H2O2) and antioxidant enzymes, (B) superoxide dismutase (SOD), (C) catalase (CAT), (D) peroxidase (POD), (E) ascorbate peroxidase (APX), and (F) glutathione reductase (GR) in Pandanus amaryllifolius leaves in response to drought stress and water recovery. Absorbance was measured through a spectrophotometer. H2O2 accumulation is shown in μM min−1 g−1 fresh weight (FW), whereas SOD is shown as U g−1 FW based on NBT coloration and inhibition. CAT, POD, APX, and GR are shown in M min−1 g−1 FW. Means labeled with alphabet were significantly different based on the ANOVA followed by post hoc when its p-value < 0.05.
5. Protein Changes in Well-Watered, Drought-Stressed, and Recovered Pandanus Plants
To identify the protein changes of Pandanus plants under drought stress, total protein from well-watered, drought, and water-recovered plants were extracted for nano-LC-MS/MS analysis. Of the 1,415 identified proteins, 74 proteins were found to be significantly altered (Table 1). These proteins were visualized with hierarchical clustering (Figures S3A and S4) and clustered into four groups based on the log ratio expression between treatments (Figure S3B). Cluster 1 showed that 12 proteins in the well-watered samples were decreased in abundance when exposed to drought stress (Figure S3B). In contrast, cluster 4 indicated that nine proteins in the recovered samples were increased in abundance when compared to drought-stressed samples (Figure S3B).
Table 1. List of abundantly altered protein profiles between well-watered, drought-stressed, and recovered Pandanus amaryllifolius.
| Accession | Protein | Biological Process | Function | Cluster a |
|---|---|---|---|---|
| F1SWA0 | Zerumbone synthase | Protein synthesis | Oxidoreductase | 1 |
| P49043 | Vacuolar-processing enzyme | Cysteine-type endopeptidase | Hydrolase | 1 |
| P48711 | Ribulose bisphosphate carboxylase large chain | Photorespiration | Magnesium ion binding | 1 |
| Q9FLN4 | 50S ribosomal protein L27, chloroplastic | Ribonucleoprotein | mRNA binding | 1 |
| A0A357 | 30S ribosomal protein S18, chloroplastic | Ribonucleoprotein | rRNA binding | 1 |
| A1E9N5 | 30S ribosomal protein S7, chloroplastic | Ribonucleoprotein | rRNA binding | 1 |
| O23760 | Caffeic acid 3-O-methyltransferase | Lignin biosynthesis | Methyltransferase | 1 |
| B2LMP1 | 30S ribosomal protein S15, chloroplastic | Ribonucleoprotein | Structural constituent of ribosome | 1 |
| A2WXD9 | Photosystem II 22 kDa protein 1, chloroplastic | Photosynthesis | Non-photochemical quenching | 1 |
| Q9XF91 | Photosystem II 22 kDa protein, chloroplastic | Photosynthesis | Non-photochemical quenching | 1 |
| Q32RY4 | 30S ribosomal protein S4, chloroplastic | Ribonucleoprotein | rRNA binding | 1 |
| O24461 | Ras-related protein Rab7 | Protein transport | GTPase activity | 1 |
| O22925 | Vacuolar-sorting receptor 2 | Protein transport | Calcium ion binding | 2 |
| Q940M2 | Alanine-glyoxylate aminotransferase 2 homolog 1, mitochondrial | Photorespiration | Aminotransferase | 2 |
| Q9LUI2 | Protein NETWORKED 1A | Cytoskeleton | Actin binding protein | 2 |
| P43644 | DnaJ protein homolog ANJ1 | Stress response | Chaperone | 2 |
| P11143 | Heat shock 70 kDa protein | Stress response | Chaperone | 2 |
| A4QLY6 | Photosystem I iron-sulfur center | Photosynthesis (ET) | Oxidoreductase | 2 |
| Q05737 | GTP-binding protein YPTM2 | Protein transport | GTPase activity | 2 |
| Q04960 | DnaJ protein homolog | Stress response | Chaperone | 2 |
| Q9XIM0 | CCG-binding protein 1 | Cellular response to hypoxia | Mediator complex binding | 3 |
| P81370 | Thaumatin-like protein | Plant defence | Pathogenesis | 3 |
| Q6DBP4 | Pectin acetylesterase 8 | Cell wall biogenesis/degradation | Hydrolase | 3 |
| Q9FLC0 | Peroxidase 52 | Hydrogen peroxide | Oxidoreductase | 3 |
| Q96520 | Peroxidase 12 | Hydrogen peroxide | Oxidoreductase | 3 |
| P48980 | Beta-galactosidase | Carbohydrate metabolism | Glycosidase | 3 |
| Q01289 | Protochlorophyllide reductase, chloroplastic | Chlorophyll biosynthesis | Oxidoreductase | 3 |
| P26792 | Beta-fructofuranosidase, insoluble isoenzyme 1 | Carbohydrate metabolism | Glycosidase | 3 |
| Q0DM51 | DEAD-box ATP-dependent RNA helicase 3, chloroplastic | Ribosome biogenesis | Hydrolase | 3 |
| F6H7K5 | Thiamine thiazole synthase 2, chloroplastic | Thiamine biosynthesis | Transferase | 3 |
| Q9LN49 | 3-ketoacyl-CoA synthase 4 | Acyltransferase | Fatty acid biosynthesis | 3 |
| Q75LR2 | Phospho-2-dehydro-3-deoxyheptonate aldolase 1, chloroplastic | Amino acid biosynthesis | Transferase | 3 |
| O82627 | Granule-bound starch synthase 1, chloroplastic/amyloplastic | Starch biosynthesis | Glycosyltransferase | 3 |
| Q8W0A1 | Beta-galactosidase 2 | Carbohydrate metabolism | Glycosidase | 3 |
| O23787 | Thiamine thiazole synthase, chloroplastic | Thiamine biosynthesis | Transferase | 3 |
| Q9ZQ94 | UDP-glycosyltransferase 73C5 | Brassinosteroid metabolism | Glycosyltransferase | 3 |
| O80731 | Pectin acetylesterase 3 | Cell wall biogenesis/degradation | Hydrolase | 3 |
| Q9C992 | 3-ketoacyl-CoA synthase 7 | Acyltransferase | Fatty acid biosynthesis | 3 |
| O22436 | Magnesium-chelatase subunit ChlI, chloroplastic | Chlorophyll biosynthesis | Ligase | 3 |
| Q84P54 | Gamma aminobutyrate transaminase 1, mitochondrial | Biotin biosynthesis | Aminotransferase | 3 |
| A5JTQ2 | Beta-xylosidase/alpha-L-arabinofuranosidase 1 (Fragment) | Carbohydrate metabolism | Glycosidase | 3 |
| Q42850 | Protochlorophyllide reductase B, chloroplastic | Chlorophyll biosynthesis | Oxidoreductase | 3 |
| Q9SD46 | Peroxidase 36 | Hydrogen peroxide | Oxidoreductase | 3 |
| O04931 | Alpha-glucosidase | Carbohydrate metabolism | Glycosidase | 3 |
| Q08937 | 29 kDa ribonucleoprotein B, chloroplastic | mRNA processing | Ribonucleoprotein | 3 |
| Q5ZE07 | Multicopper oxidase LPR1 homolog 2 | Phosphate homeostasis | Oxidoreductase | 3 |
| A4S6Y4 | Lon protease homolog, mitochondrial | Oxidative stress | DNA binding | 3 |
| Q40147 | Glutamate-1-semialdehyde 2,1-aminomutase, chloroplastic | Chlorophyll biosynthesis | Isomerase | 3 |
| Q9LIK0 | Plastidial pyruvate kinase 1, chloroplastic | Glycolysis | Kinase | 3 |
| Q6STH5 | Fe-S cluster assembly factor HCF101, chloroplastic | iron-sulphur cluster assembly | 4Fe-4S cluster binding | 3 |
| Q0E3C8 | Chaperone protein ClpB3, mitochondrial | Stress response | Chaperone | 3 |
| Q94LW3 | Homeobox protein knotted-1-like 3 | Mucilage biosynthesis | DNA binding | 3 |
| Q42600 | Cytochrome P450 84A1 | Phenylpropanoid biosynthesis | Monooxygenase | 3 |
| Q56UD0 | Beta-fructofuranosidase, insoluble isoenzyme 6 | Carbohydrate metabolism | Glycosidase | 3 |
| Q8L7S6 | Beta-hexosaminidase 3 | Carbohydrate metabolism | Glycosidase | 3 |
| Q39613 | Peptidyl-prolyl cis-trans isomerase | Protein folding | Chaperone | 3 |
| Q9SJ20 | Ribonucleoside-diphosphate reductase large subunit | DNA replication | Oxidoreductase | 3 |
| Q75GT3 | Chaperone protein ClpB2, chloroplastic | Stress response | Chaperone | 3 |
| Q9ZUU4 | RNA-binding protein CP29B, chloroplastic | mRNA processing | Ribonucleoprotein | 3 |
| Q9M591 | Magnesium-protoporphyrin IX monomethyl ester [oxidative] cyclase, chloroplastic | Chlorophyll biosynthesis | Oxidoreductase | 3 |
| Q9CA67 | Geranylgeranyl diphosphate reductase, chloroplastic | Chlorophyll biosynthesis | Oxidoreductase | 3 |
| P50246 | Adenosylhomocysteinase | One-carbon metabolism | Hydrolase | 3 |
| Q6ZIV7 | Hypersensitive-induced response protein 1 | Potassium ion channel regulation | Histidine kinase binding | 3 |
| Q9SI75 | Elongation factor G, chloroplastic | Protein biosynthesis | Elongation factor | 3 |
| P24846 | 4-hydroxy-tetrahydrodipicolinate synthase 1, chloroplastic | Amino acid biosynthesis | Allosteric enzyme | 3 |
| Q41932 | Oxygen-evolving enhancer protein 3-2, chloroplastic | Photosynthesis (ET) | Calcium ion binding | 4 |
| P25795 | Aldehyde dehydrogenase family 7 member A1 | Stress response | Oxidoreductase | 4 |
| Q9AXH0 | Catalase | Hydrogen peroxide | Oxidoreductase | 4 |
| O65660 | PLAT domain-containing protein 1 | Stress response | Catalase | 4 |
| A2YH64 | Catalase isozyme B | Hydrogen peroxide | Oxidoreductase | 4 |
| Q0E4K1 | Catalase isozyme A | Hydrogen peroxide | Oxidoreductase | 4 |
| O04932 | Probable sucrose-phosphate synthase 1 | Glycosyltransferase | Sucrose biosynthesis | 4 |
| Q570C8 | 3-ketoacyl-CoA thiolase 5, peroxisomal | Acyltransferase | Fatty acid biosynthesis | 4 |
| Q9SG80 | Alpha-L-arabinofuranosidase 1 | L-arabinose metabolic | Hydrolase | 4 |
a Clusters 1–4 show the differential accumulation of differentially changed proteins (log ratio expression) between treatments (Figure S3B). Cluster 1 represents the decreasing protein abundance from the well-watered to drought-stressed and recovery samples. Cluster 2 shows the increasing protein abundance pattern from the well-watered to drought-stressed but decreasing from drought-stressed to recovery samples. Cluster 3 represents the decreasing protein abundance when comparing well-watered to drought-stressed but increasing from the drought-stressed to recovery samples. Cluster 4 shows the increasing abundance of proteins from well-watered to recovery samples.
Among the 74 identified proteins, carbohydrate- and stress-related proteins were the largest differentially changed protein group in this study (Figure 7A,B). Of these, 39 unique proteins were found in Comparison 1 (Drought vs. Well-watered), 40 proteins in Comparison 2 (Recovery vs. Well-watered), and 57 proteins in Comparison 3 (Recovery vs. Drought) (Figure 8A).
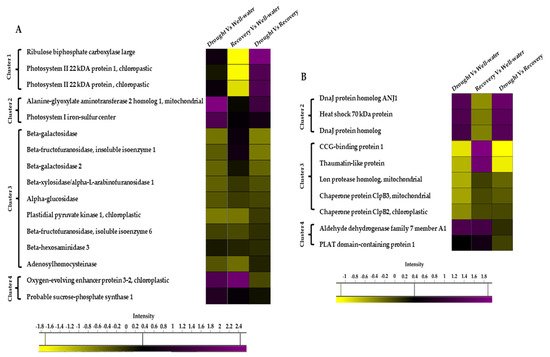
Figure 7. Heat map of the differentially changed protein classes identified between well-watered, drought-stressed, and water-recovered Pandanus amaryllifolius. (A) Carbon-related proteins identified between treatments. (B) Stressed-related proteins identified between treatments. The intensity scale indicates the range of upregulation (purple) or downregulation (yellow) of proteins between treatments.
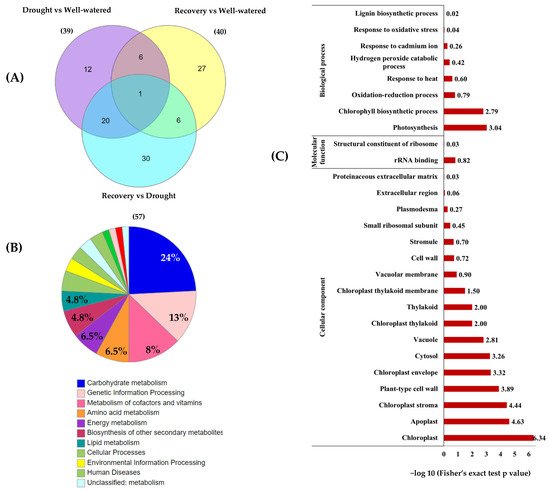
Figure 8. Functional categorization and enrichment of differentially changed proteins between well-watered, drought, and recovery samples. (A) The Venn diagram represents the comparison of differentially abundant proteins identified in the leaves of Pandanus plants treated with drought stress, well-watered, and recovery; (B) KEGG enrichment of differentially changed proteins based on functional category; and (C) gene ontology enrichment based on KEGG pathway according to biological processes, molecular functions, and cellular components.
To classify the function of the 74 differentially changed proteins, KEGG pathway enrichment analysis was performed (Figure 8). The results showed that 15 of differentially changed proteins were involved in carbohydrate metabolism and another 8 proteins are involved in genetic information processing and cofactors and vitamin metabolism (Figure 8B). Based on the gene ontology (GO) functional classification, most of the differentially changed proteins were involved in photosynthesis processes and stress responses (Figure 8C).
References
- FAO. The Impact of Disasters and Crises on Agriculture and Food Security: 2017; FAO: Rome, Italy, 2018; ISBN 978-92-5-130359-7.
- Foreign Agricultural Service USDA. Available online: https://www.fas.usda.gov/data/thailand-impact-drought-agriculture-2020 (accessed on 21 September 2021).
- Zulkarami, B.; Razi, I.M.; Halimi, M.S.; Mondal, M.A.; Panhwar, Q.A.; Islam, M.R. Effectiveness of different phytohormones on grain filling and yield of rice (Oryza sativa L.) under drought stress. J. Food Agri. Environ. 2014, 12, 697–700.
- Nalina, M.; Saroja, S.; Chakravarthi, M.; Rajkumar, R.; Radhakrishnan, B.; Chandrashekara, K.N. Water deficit-induced oxidative stress and differential response in antioxidant enzymes of tolerant and susceptible tea cultivars under field condition. Acta. Physiol. Plant. 2021, 43, 10.
- Zhou, J.; Chen, S.; Shi, W.; David-Schwartz, R.; Li, S.; Yang, F.; Lin, Z. Transcriptome profiling reveals the effects of drought tolerance in giant juncao. BMC Plant. Biol. 2021, 21, 2.
- Wang, D.; Chen, Q.; Chen, W.; Guo, Q.; Xia, Y.; Wang, S.; Jing, D.; Liang, G. Physiological and transcription analyses reveal the regulatory mechanism of melatonin in inducing drought resistance in loquat (Eriobotrya japonica Lindl.) seedlings. Environ. Exp. Bot. 2021, 181, 104291.
- Bankaji, I.; Sleimi, N.; Vives-Peris, V.; Gómez-Cadenas, A.; Pérez-Clemente, R.M. Identification and expression of the cucurbita WRKY transcription factors in response to water deficit and salt stress. Sci. Hortic. 2019, 256, 108562.
- Maurel, C.; Nacry, P. Root architecture and hydraulics converge for acclimation to changing water availability. Nat. Plants 2020, 6, 744–749.
- Santos, J.; Oliveira, L.E.; Coelho, V.T.; Lopes, G.; Souza, T.; Porto, A.C.; Lira, J.; Massote, R.; Rocha, C.; Gomes, M.P. Performance of hevea brasiliensis under drought conditions on osmoregulation and antioxidant activity through evaluation of vacuolar invertase and reducing sugars. Plant. Sci. Today 2021, 8, 312–323.
- Liu, Y.; Ji, D.; Turgeon, R.; Chen, J.; Lin, T.; Huang, J.; Luo, J.; Zhu, Y.; Zhang, C.; Lv, Z. Physiological and proteomic responses of mulberry trees (Morus alba L.) to combined salt and drought stress. Int. J. Mol. Sci. 2019, 20, 2486.
- Xiao, S.; Liu, L.; Zhang, Y.; Sun, H.; Zhang, K.; Bai, Z.; Dong, H.; Liu, Y.; Li, C. Tandem mass tag-based (TMT) quantitative proteomics analysis reveals the response of fine roots to drought stress in cotton (Gossypium hirsutum L.). BMC Plant. Biol. 2020, 20, 328.
- Goche, T.; Shargie, N.G.; Cummins, I.; Brown, A.P.; Chivasa, S.; Ngara, R. Comparative physiological and root proteome analyses of two sorghum varieties responding to water limitation. Sci. Rep. 2020, 10, 11835.
- Gupta, S.; Mishra, S.K.; Misra, S.; Pandey, V.; Agrawal, L.; Nautiyal, C.S.; Chauhan, P.S. Revealing the complexity of protein abundance in chickpea root under drought-stress using a comparative proteomics approach. Plant. Physiol. Biochem. 2020, 151, 88–102.
- Azri, W.; Cosette, P.; Guillou, C.; Rabhi, M.; Nasr, Z.; Mliki, A. Physiological and proteomic responses to drought stress in leaves of two wild grapevines (Vitis sylvestris): A comparative study. Plant. Growth Regul. 2020, 91, 37–52.
- Zhu, D.; Luo, F.; Zou, R.; Liu, J.; Yan, Y. Integrated physiological and chloroplast proteome analysis of wheat seedling leaves under salt and osmotic stresses. J. Proteomics 2021, 234, 104097.
- Amnan, M.A.M.; Pua, T.-L.; Lau, S.-E.; Tan, B.C.; Yamaguchi, H.; Hitachi, K.; Tsuchida, K.; Komatsu, S. Osmotic stress in banana is relieved by exogenous nitric oxide. PeerJ 2021, 9, e10879.
- Ghasemzadeh, A.; Jaafar, H.Z. Profiling of phenolic compounds and their antioxidant and anticancer activities in pandan (Pandanus amaryllifolius Roxb.) extracts from different locations of Malaysia. BMC Complement. Altern. Med. 2013, 13, 341.
- Reshidan, N.H.; Abd Muid, S.; Mamikutty, N. The effects of Pandanus amaryllifolius (Roxb.) leaf water extracts on fructose-induced metabolic syndrome rat model. BMC Complement. Altern. Med. 2019, 19, 232.
- Agroforestry.org. Available online: https://agroforestry.org/images/pdfs/P.tectorius-pandanus.pdf (accessed on 13 January 2022).
- Gurmeet, S.; Amrita, P. Unique Pandanus—Flavour, Food and Medicine. J. Pharma. Phytochem. 2015, 3, 8–14.
More
Information
Subjects:
Plant Sciences
Contributor
MDPI registered users' name will be linked to their SciProfiles pages. To register with us, please refer to https://encyclopedia.pub/register
:
View Times:
901
Revisions:
2 times
(View History)
Update Date:
19 Jan 2022
Table of Contents


Notice
You are not a member of the advisory board for this topic. If you want to update advisory board member profile, please contact office@encyclopedia.pub.
OK
Confirm
Only members of the Encyclopedia advisory board for this topic are allowed to note entries. Would you like to become an advisory board member of the Encyclopedia?
Yes
No
${ textCharacter }/${ maxCharacter }
Submit
Cancel
Back
Comments
${ item }
|
${ item.createdUser.fullName }
${ item.createdAt }
${ item.vote }
${ item.reply }
Delete
${ reply.createdUser.fullName }
${ reply.createdAt }
${ reply.vote }
Delete
There is no reply to this comment~
${ item.replyTextCharacter }/${ item.replyMaxCharacter }
Submit
Cancel
More
No more~
There is no comment~
${ textCharacter }/${ maxCharacter }
Submit
Cancel
${ selectedItem.replyTextCharacter }/${ selectedItem.replyMaxCharacter }
Submit
Cancel
Confirm
Are you sure to Delete?
Yes
No