Your browser does not fully support modern features. Please upgrade for a smoother experience.
Submitted Successfully!
 +1 credit
Thank you for your contribution! You can also upload a video entry or images related to this topic.
For video creation, please contact our Academic Video Service.
| Version | Summary | Created by | Modification | Content Size | Created at | Operation |
|---|---|---|---|---|---|---|
| 1 | Fujung Tsai | + 7426 word(s) | 7426 | 2022-01-12 02:20:22 | | | |
| 2 | Bruce Ren | Meta information modification | 7426 | 2022-01-17 02:14:15 | | |
Video Upload Options
We provide professional Academic Video Service to translate complex research into visually appealing presentations. Would you like to try it?
Cite
If you have any further questions, please contact Encyclopedia Editorial Office.
Tsai, F. Meteorological Conditions on Riverbed Dust Aerosol in Taiwan. Encyclopedia. Available online: https://encyclopedia.pub/entry/18283 (accessed on 25 June 2026).
Tsai F. Meteorological Conditions on Riverbed Dust Aerosol in Taiwan. Encyclopedia. Available at: https://encyclopedia.pub/entry/18283. Accessed June 25, 2026.
Tsai, Fujung. "Meteorological Conditions on Riverbed Dust Aerosol in Taiwan" Encyclopedia, https://encyclopedia.pub/entry/18283 (accessed June 25, 2026).
Tsai, F. (2022, January 15). Meteorological Conditions on Riverbed Dust Aerosol in Taiwan. In Encyclopedia. https://encyclopedia.pub/entry/18283
Tsai, Fujung. "Meteorological Conditions on Riverbed Dust Aerosol in Taiwan." Encyclopedia. Web. 15 January, 2022.
Copy Citation
Extremely high concentrations of dust particles are occasionally generated from the riverbeds of Taiwan, affecting the visibility and traffic safety of the local and nearby areas. The condition is most severe during the winter monsoon when surface wind is strong.
dust aerosol
riverbed
Taiwan
PM10
front
anticyclone
weather
1. Introduction
Dust particles are important suspended particles in the atmosphere. In addition to affecting air quality and human health, they also have an impact on the climate [1][2][3][4]. Air pollutants can adhere to the surface of dust particles and affect human health. Besides this, dust particles can directly reflect or scatter solar radiation, or become ice condensation nuclei, indirectly affecting climate change [5][6][7][8][9][10]. Atmospheric dust particles not only come from arid deserts, but also from riverbed areas [11][12][13]. Similar to dust particles in the desert, dust or sand accumulations on dry riverbeds are susceptible to wind forces and can be raised into the air. Occasional severe riverbed events can impact on the neighboring and downwind areas, affecting visibility, health, and traffic safety [14][15][16].
Taiwan is an island located off the southeast coast of the Asian continent. Many rivers in Taiwan originate from high mountains, with the highest elevation of nearly 4000 m, and are meridionally situated in the middle of the island (Figure 1). The rivers on the island are separated by the high mountains and flow either eastward or westward into the sea. Because the rivers are short and steep, the water flow is usually rapid. In addition, in the source regions, most of the geological textures of the rivers are composed of sandstone, shale, and slate. These textures are fragile and collapse easily, leading to a large amount of river sedimentation. When heavy rains occur, these sediments can be carried downstream by the rivers. As the flow rate slows down, the suspended matter in the water gradually settles and accumulates. Once the weather is dry and the wind speed is strong, the small debris on the riverbed can be raised by the wind and suspended in the air.
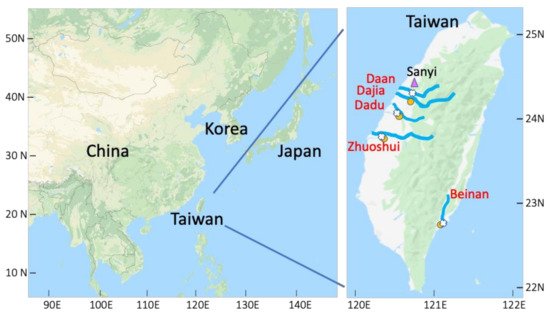
Figure 1. Locations of five major rivers in Taiwan, including the Daan, Dajia, Dadu, Zhuoshui, and Beinan. Riverbed monitoring stations are marked with a white x, EPA monitoring stations in towns nearby the riverbed stations are marked with an orange circle, and the Sanyi background station in Central Taiwan is marked with a pink triangle (Created from Google Map).
The main rivers in Taiwan include the Daan, Dajia, Dadu, Zhuoshui, and Beinan Rivers (Figure 1). These rivers are located in the central and southeastern suburbs, and sands and gravels can be seen everywhere along the riverbeds. The annual summer monsoon period is from May to September, when typhoons and thunderstorms with heavy rainfall often occur, and the river water level is usually high. The sediments of the rivers are carried downstream by the rapid water flow. On the other hand, from October to April is the winter monsoon period. During this period, cyclonic systems with frontal events pass through Taiwan about once a week [17]. After the passage of surface fronts, the strong northeasterly winds ahead of the anticyclonic systems prevail on the island. In addition, the rainfall due to frontal passage often affects the northern areas of the island, but not the central or southern areas, where these major rivers are located. Therefore, during this period, the river waters recede and the exposed area of the dry riverbed increases. When the wind is strong enough to exceed the rising threshold of dust particles on the riverbed, they can be lifted by the wind and suspended in the air.
Besides the meteorological conditions, the riverbed dust emissions also depend on the characteristics of the rivers [14]. Among these major rivers, the Zhuoshui River has the largest watershed (approximately 3160 km2) and the riverbed has the largest exposed areas [18]. The maximum width of the riverbed is up to around 3 km at the outlet. Other rivers have smaller watersheds (800–2000 km2), and the riverbeds at the outlet are less than 2 km in width [18][19]. In addition, the riverbed of the lower part of the Zhuoshui River is dominated by silt, with an average particle diameter of about 1.9 mm. Compared with other rivers with average sand particle diameters of 46-119 mm, the sand particle diameter of the Zhuoshui River is relatively small [20][21]. Therefore, the most serious riverbed event observed in the recent decade also occurred in the Zhuoshui River, with hourly PM10 concentration reaching as high as 2532 µg m−3 on 2 November 2009 [22]. During the winter monsoon, Asian dust and pollutants, including coarse (PM2.5-10) and fine suspended particulates (PM2.5), can also undergo long-range transport to Taiwan through northeasterlies, resulting in the background PM10 concentrations in Northern Taiwan to an average of about 100 µg m−3 per month, or an hourly maximum of about 1000 µg m−3 over the past two decades [23][24][25][26]. Compared with Asian dust or pollutant events, the impact area of suspended particles in riverbed events is smaller but can cause extremely high concentrations in local and nearby areas.
The impacts of riverbed emissions have attracted the attentions of previous researchers [27][28][29][30][31][32]. For example, Syu et al. [31] sampled the particles of two dust events in the Zhuoshui River and found that there are two or multiple modes of particle size distributions. The higher the wind speed, the larger the size of the particles rising into the air. Lin and Yeh [14] established an empirical model to estimate the sand and dust emissions from the Zhuoshui River bed, and found that dust emission is related to wind speed, air temperature, soil silt content, and soil moisture content. Lin et al. [27] analyzed the concentration and composition of suspended particles in the lower reaches of the Zhuoshui River. They found that during the northeast monsoon, the concentration of the suspended dust particles in the riverbed would double than during other period, which would also lead to an increase in the proportion of crustal elements and a decrease in pollutant elements. Kuo et al. [29][30] and Chiang et al. [32] also found that the concentrations of metals such as Ni, Cr, As, or Cd during riverbed dust events can reach 11 times higher than at other times, and their concentrations can seriously affect human health.
Due to the impact of the suspended riverbed dust particles, the Taiwan Environmental Protection Administration (EPA) began to establish monitoring stations near the main rivers in order to better control the emissions. Monitored data included wind speed, wind direction, temperature, relative humidity, and PM10 concentrations. In addition to wind speed, which is important for raising dust particles from the riverbed, high temperatures create more convection of the water vapor from the bare riverbed, while the relative humidity of the air is also related to water vapor, and thus they are all important factors for riverbed dust emissions [33][34]. In the present study, we analyzed the two-year meteorological data and PM10 concentrations obtained from these major riverbed stations. In order to understand the causes of high PM10 concentration, we classified the meteorological conditions of high-concentration events into different weather types, similar to previous studies of polluted events [35][36]. Two events in the weather types are taken as examples to further illustrate the impact of weather conditions on the high concentration. The meteorological conditions in different weather types and the monthly and hourly average meteorology were summarized to explain the causes of high PM10 concentration in the riverbeds.
3. Data Analysis
3.1. Hourly Observations
Figure 2 shows the observed hourly relative humidity, temperature, PM10 concentration, and noon time wind speed and direction observed by four riverbed monitoring stations, as well as rainfall at general EPA stations near each river (Figure 2a–d). Observations from the Sanyi background station in central Taiwan are also plotted for comparison (Figure 2e). Two annual datasets, starting from September 2010 and September 2012, for all stations are plotted. In these figures, we can roughly divide the data into two periods, namely the winter monsoon and the summer monsoon. From October to April is usually the period of the winter monsoon. It can be seen in Figure 2 that the northeasterly or northerly winds prevailed at most riverbed stations during this period, and the temperature, humidity, and rainfall were relatively low, indicating the dry and windy seasons of the year. This is the period when more dust particles are generated from the riverbeds. On the other hand, during the summer monsoon period, the wind is usually weaker and wind direction is more diversified, and the relative humidity and rainfall are higher, resulting in fewer riverbed events. Among all the rivers, the Beinan is located in the southernmost position and is also on the edge of the prevailing northeasterly wind in winter (Figure 1). Therefore, even in the northeasterly seasons, the local land sea breezes often dominate. The wind direction at noon time (12:00) in Figure 2d shows that the sea breezes from the south are often observed in the riverbed area during the winter monsoon, and the wind direction is different from the northerlies or northeasterlies prevailing at the stations in Central Taiwan. These details can be seen later in the case study.
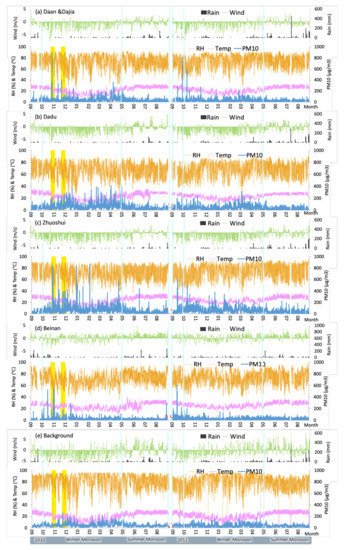
Figure 2. Wind speed and direction, relative humidity (orange line), temperature (pink line), and PM10 concentration observed at the (a) Daan and Dajia, (b) Dadu, (c) Zhuoshui, and (d) Beinan riverbed monitoring stations, and rainfall amounts observed at the closest general EPA stations adjacent to the rivers from 1 September 2010 to 31 August 2011, and 1 September 2012 to 31 August 2013. Observations from (e) Sanyi background station are plotted for comparison. Two selected events for discussion are marked with yellow bars.
Comparing the monitoring results of the four rivers, the riverbed event in the Zhuoshui River in Central Taiwan was more serious than events in other rivers (Figure 2). The PM10 concentration in the Zhuoshui River exceeded 400 µg m−3 in 16 h per year, of which it exceeded 800 µg m−3 in 2.5 h. In Daan/Dajia, the PM10 concentration exceeded 400 µg m−3 in 5 h per year, of which one hour exceeded 800 µg m−3. For the Beinan River in southeastern Taiwan, PM10 was observed to exceed 400 µg m−3 in 5 h per year. Similar to the Daan/Dajia and Zhuoshui Rivers, the Dadu River is also located in Central Taiwan, but the maximum hourly concentrations of PM10 exceeds 400 µg m−3 only once per year. In addition, aerosol transported from the Asian continent or local pollution to the riverbeds is limited. At the Sanyi background station in Central Taiwan (Figure 2e), the highest hourly PM10 concentrations in the two years were about 250 µg m−3, representing the hourly maximum PM10 value due to long-range transport to the island from abroad. Moreover, the hourly PM10 of the largest city in Central Taiwan (Taichung) is also less than 250 µg m−3 in the two years. Thus, the PM10 concentration due to dust generation from these major rivers is extremely high.
3.2. Average of Hourly Observations
Figure 3 summarizes the PM10 and meteorological values from Figure 2. Figure 3a presents the annual and monthly averaged PM10 concentrations of the major rivers. The results show that although the hourly PM10 concentration in the riverbed is as high as 800 µg m−3, the annual average PM10 concentration in all major rivers is not high. The value range is only 21–57 µg m−3, indicating that the rivers are located in rural areas. The largest annual averaged PM10 is the Zhuoshui River in Central Taiwan, with a value of 57 µg m−3, and the lowest is the Beinan River in southeastern Taiwan, with a value of 21 µg m−3. In addition, the maximum monthly average of PM10 was observed in the Zhuoshui River, with a concentration of 89 µg m−3, which appeared in December. This maximum monthly average of the Zhuoshui River is more than three times the minimum value observed in July (25 µg m−3). Similarly, the monthly average PM10 concentrations during the winter monsoon period (October to April) are all higher than those in the summer monsoon periods (May to September) for other stations, but the ratio of maximum to minimum monthly averages are all around 3. Although the higher PM10 in the riverbeds during the winter monsoon may come from the long-range transport of Asian dust and pollutants, previous studies reported that the monthly or annual average increase in Northern Taiwan is up to about 20 µg m−3 [23][26], indicating the impacts of riverbed dust on PM10 concentration.
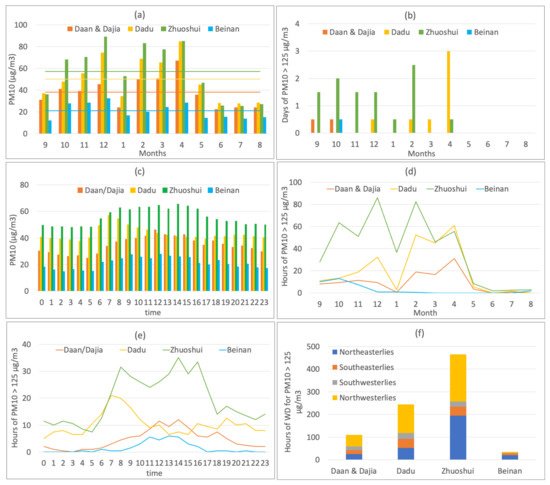
Figure 3. Summary from Figure 2, (a) monthly average PM10 concentration, (b) daily counts of PM10 greater than 125 µg m−3 in each month, (c) annual average PM10 concentration in each hour, (d) hourly counts of PM10 greater than 125 µg m−3 in each month, (e) hourly counts of PM10 greater than 125 µg m−3 in each hour, and (f) hourly counts of wind directions per year for hourly PM10 greater than 125 µg m−3.
Figure 3b counts the total number of days in which the daily averaged PM10 of all riverbeds exceeded the air quality standard of 125 µg m−3 in each month. The results showed that the daily average PM10 exceedance time of all rivers was within 3 days per month, of which the maximum 3 days was observed in the Dadu River in April. In addition, for the entire year, the maximum number of 10 days was observed in the Zhuoshui River. This is because in the Zhuoshui River, the daily PM10 exceeds the standard for nearly half a day to 2.5 days per month in the winter. On the other hand, the Daan/Dajia Rivers exceed the standard value for half a day in September and October, while the Beinan River only exceeds the standard for half a day in October. The low daily average PM10 exceedance time of all rivers in Figure 3b indicates that the high riverbed concentrations occur sporadically within a few hours, and the background concentration of the rivers is relatively low during the rest of the day, and thus the daily average PM10 is not high.
Figure 3c shows the average concentration of PM10 for 24 h. Similar to the monthly average PM10 in Figure 3a, the hourly average PM10 of the riverbed is not high, with the highest values being 65 µg m−3, and appears after noon time (14:00) in the Zhuoshui River. The Daan/Dajia, and Beinan Rivers also have similar high concentrations during the day and low concentrations at night, while the hourly variation of the Dadu River is different from that of other rivers. The high concentration appeared in the morning, and the maximum value was as high as 60 µg m−3 at 7 a.m. In addition to the morning hours, the other hourly average values of the Dadu River are almost all slightly lower than in the Zhuoshui River, which is the river with the second highest concentration.
In order to inspect the occasional high concentrations of PM10 in the riverbed, this study counts the hours of high PM10 concentration. Since the EPA does not have an hourly air quality standard for PM10, we have used the 125 µg m−3 from the PM10 daily air quality standard as the criteria for selecting hourly high-concentration cases. Figure 3d shows the total number of hours exceeding 125 µg m−3 per month for all the rivers in an annual average. The results further highlight that the high concentration of PM10 varies by month and river. During the winter monsoon from October to April of the following year, the maximum number of exceedance hours per month is more than 80 h, while during the summer monsoon period, the value is almost zero in all rivers. Comparing different months, Figure 3d shows that the distribution of PM10 exceedance time is similar to the monthly average distribution in Figure 3a, showing a bimodal type, among which December, February, and April are the months with more exceedance hours for the Daan/Dajia, Dadu, and Zhuoshui Rivers in Central Taiwan. The high number of hours exceeding the criteria in these several months also resulted in high averaged concentrations in these rivers (Figure 3a). In Figure 3d, January is the month when the PM10 exceedance time is the lowest in the winter monsoon, which also results in the lowest monthly average concentration in the season. In addition to these few months, the number of hourly PM10 values exceeding the criteria in the Zhuoshui River was also high in October, and in the Beinan River in southeastern Taiwan was also high in September and October.
When comparing different rivers, Figure 3d shows that the maximum time exceeding the criteria per month was 86 h, which occurred in the Zhuoshui River in December, and the total exceedance is 465 h for the same river in a year. Converting 465 or 86 h into days, there are almost 19 days a year, or 4 days a month, of exceedance time. Interestingly, the number of days when daily PM10 exceeded the standard in the Zhuoshui River was only 10 days per year, and in December it was only 1.5 days (Figure 3b). These results indicate again that high concentrations of PM10 are mostly sporadic for a few hours of the day, rather than continuously occurring, so that the daily average value exceeding the standard is rare, which is different from the high concentration of the Asian dust event observed for several consecutive days [36]. However, if the 465 or 86 h of over-criteria time are evenly distributed to 365 in a year, or 30 days in a month, the riverbed has from 1 h to nearly 3 h a day when PM10 concentration has reached a value of 125 µg m−3. For the Daan/Dajia, and Dadu Rivers, the total number of hours exceeding 125 µg m−3 per month corresponds to about 2 h and 1 h per day in the severe months, respectively. Therefore, although the daily PM10 exceedance time is low, high dust concentrations are often observed over these rivers, especially in severe months.
Figure 3e counts the total number of hours when PM10 exceeds 125 µg m−3 in each 24 h. It can be seen from the figure that the PM10 exceedance hour is unevenly distributed within 24 h. Most riverbeds show high exceedance hours during the daytime. Among all the rivers, the maximum exceedance occurs in the Zhuoshui River, and the over-criteria time from 8:00 to 16:00 during the day is about 25 to 35 h per year, indicating that the riverbed emissions may be higher during these periods. The Daan/Dajia, and Beinan Rivers have similar high PM10 concentrations at noon time, but the frequency is less. Different from other rivers, the Dadu River’s maximum exceedance occurred in the morning, and the value (20 h) is only slightly lower than that of the Zhuoshui River at the same time, similar to the result in Figure 3c. In addition to the daytime exceedance, Figure 3e shows that most rivers in Central Taiwan have also observed high PM10 events at night, implying that the PM10 in these rivers may have other sources.
In addition to monthly and hourly variations in high riverbed concentrations, the wind directions in all rivers that cause hourly PM10 to exceed 125 µg m−3 are also summarized. In order to simplify the wind problem, all wind directions are only divided into four directions, 0 to 90 degrees as northeasterlies (NE), 90 to 180 degrees as southeasterlies (SE), 180 to 270 degrees as southwesterlies (SW), and 270 to 360 degrees as northwesterlies (NW). Figure 3f shows the total number of hours per year for different wind directions leading to high riverbed concentrations. In Figure 3f, the Zhuoshui River has the longest time exceeding the standard per year (465 h), and the Beinan River has the shortest time exceeding the standard per year (35 h). Regardless of the wide range of exceedance time, Figure 3f shows that the main wind directions are northeasterly and northwesterly winds, which account for at least 70% of all riverbed high-concentration events, observed mainly in the northeasterly monsoon seasons. In addition, southwesterly and southeasterly winds are also important, accounting for at least about 15% of the high-concentration events for all the rivers.
Furthermore, we also checked other meteorological conditions that caused the hourly PM10 value to exceed 125 µg m−3, including wind speed, temperature, and humidity. The results showed that all rivers have a wide range of wind speed during high concentrations of hourly PM10. The maximum wind speed was as high as 11 m s−1, but the minimum wind speed was only 0.2 m s−1. The temperature range was likely to be from 11 to 34 °C, and the humidity range was from 33% to 94% at the high hourly concentration of PM10. The wide ranges of the meteorological conditions at high PM10 concentration may be caused by the meteorological conditions of various weather types and will be explored in the following sections.
4. Weather Analysis
To explain the monthly and hourly PM10 variations shown in Figure 3, riverbed dust events with daily PM10 greater than 125 µg m−3, as discussed in Figure 3b, are selected for weather analysis. Table 1 lists the selected days during the two-year period. For each day in Table 1, the weather type is classified according to the weather map. The first events from both the typhoon and non-typhoon types are selected for illustration in the following sections.
Table 1. Riverbed events (day/month/year) with daily averaged PM10 greater than 125 µg m−3 for each of the major rivers are classified into different types.
| Rivers/Types | Typhoon | Non-Typhoon | ||
|---|---|---|---|---|
| Ahead of Front | Ahead of Anticyclone |
Behind Anticyclone |
||
| Daan & Dajia | 27/10/2010 28/09/2012 |
|||
| Dadu | 13/12/2010 10–11/04/2011 |
01–02/04/2011 14/04/2011 29/04/2011 25/02/2013 06/03/2013 |
||
| Zhuoshui | 26–27/10/2010 14/09/2012 28–29/09/2012 10/10/2012 17/10/2012 |
22/11/2010 11/04/2011 26/02/2013 |
28/11/2010 31/12/2010 15/01/2011 09/02/2011 23/12/2012 |
12/11/2010 23/12/2010 07/02/2011 26/02/2011 25/02/2013 |
| Beinan | 31/10/2010 | |||
4.1. Weather Maps of Two Types
Figure 4 shows the weather maps of the first events of the typhoon and non-typhoon types, in which the latter is further classified into ahead of front, ahead of anticyclone, and behind anticyclone. In Figure 4a, the first typhoon type was observed on 27 October 2010 (also see Table 1). In this event, Typhoon Chaba approached Taiwan from near the equator, and later turned northeast to the Japanese coast without passing through Taiwan. On the other hand, a strong anticyclonic circulation occupied China on the same day, and there was an intensive pressure gradient in the coastal areas of China. Due to this strong pressure gradient, strong northeasterly winds prevailed in Taiwan. The approach of the cyclonic circulation of the typhoon accelerated the strong northeasterlies, resulting in the rising of the riverbed sands and dust particles, and has led to the daily PM10 exceedance over the Daan/Dajia and Zhuoshui Rivers (Table 1). Although typhoons are warm and humid cyclones, and often produce rainfall, Typhoon Chaba was far away from Taiwan, so less than 1 mm of precipitation was observed in southeastern Taiwan, and no precipitation was observed in the riverbed area of Central Taiwan.
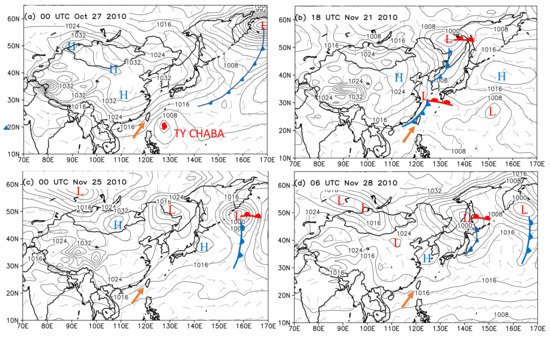
Figure 4. Surface weather maps of (a) typhoon (TY Chaba) type at 00:00 UTC on 27 October 2010; (b) ahead of front in non-typhoon type at 18:00 UTC on 21 November 2010; (c) ahead of anticyclone in non-typhoon type at 00:00 UTC on 25 November 2010; and (d) behind anticyclone in non-typhoon type at 06:00 UTC on 28 November 2010. The full barb and half barb represent 10 and 5 m s−1, respectively. Isobars (line) are analyzed at 4 hPa interval. Taiwan is marked with an arrow. Note that the universal time in the weather map plus 8 h is the local time (created by data from the National Centers for Environmental Prediction, US).
For the non-typhoon type, Figure 4b–d show the weather map of the first consecutive event from 20 November to 30 November 2010. The event includes weather conditions such as Taiwan’s location ahead of the surface front (Figure 4b), ahead of the anticyclonic system (Figure 4c), and behind the anticyclonic system (Figure 4d). This event caused the daily averaged PM10 values of the Zhuoshui River to exceed the standard for two days (22/11/2010 and 28/11/2010 in Table 1). Figure 4b shows the ahead of the front type of weather on 21 November 2010. In this type, a surface front was located on the southeast coast of China, which was about to pass through Taiwan.
After the passage of the surface front, Taiwan was under northeasterly winds ahead of the anticyclonic system. Figure 4c shows the weather map of this type on 25 November 2010. The northeasterly wind lasted for several days until the anticyclonic center moved off the coastal areas of China. Figure 4d shows that after the anticyclonic center passed through areas to the north of Taiwan on 28 November 2010, most areas of Taiwan were dominated by weak easterly winds.
4.2. Hourly Data of Two Types
Figure 5 and Figure 6 plot PM10 concentration and meteorological data of all riverbeds for the typhoon and non-typhoon types discussed in Figure 4. Figure 5 shows the typhoon type data from 24 October to 2 November 2010. In this type, Typhoon Chaba approached Taiwan from 26 to 27 October. Before the arrival of the typhoon on 24 October, land breezes (easterlies on the western coast) were observed in most riverbeds from the evening to early morning, and then sea breezes (westerlies on the western coast) during the day (Figure 5). The land–sea breeze is in the reverse wind direction in the Beinan River over the southeastern coast of Taiwan.
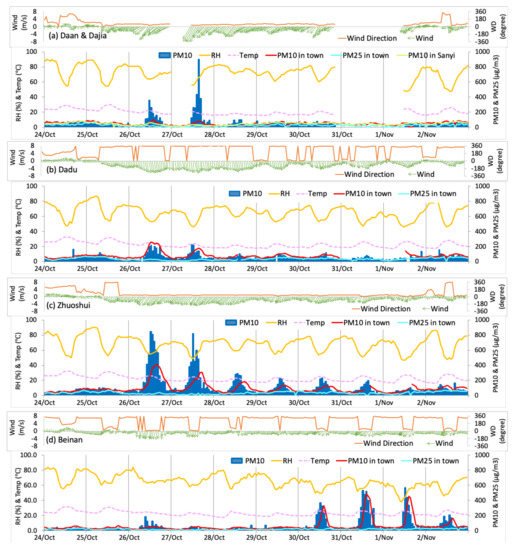
Figure 5. The typhoon type meteorological conditions and aerosol concentration, including wind speeds and directions (wind and WD), relative humidity (RH), temperature (Temp), and PM10 concentration observed at (a) Daan and Dajia, (b) Dadu, (c) Zhuoshui, and (d) Beinan riverbed monitoring stations from 24 October to 2 November 2010. PM10 and PM2.5 observed in the town nearby each riverbed stations and PM10 in the Sanyi background station are also plotted.
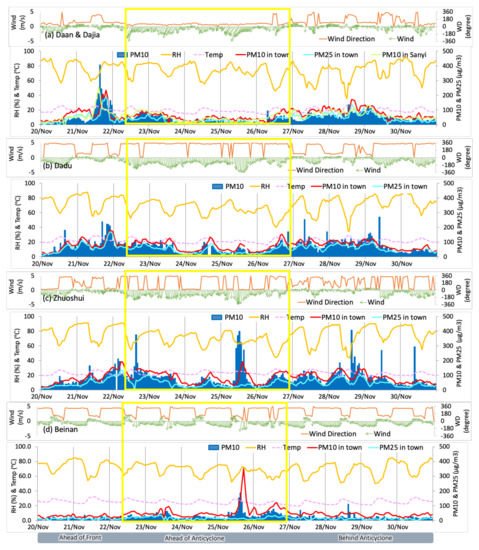
Figure 6. Same as in Figure 5, except for the non-typhoon type that occurred from 20 November to 30 November 2010. The ahead of anticyclone stage is marked with a yellow rectangle.
Followed by the local land–sea breeze on early 25 October, the northeasterlies ahead of the surface anticyclonic system started to affect the coastal areas of East Asia. From 26 to 27 October, the northeasterlies reached their maximum surface wind speed due to the approach of the typhoon. The maximum surface wind speed observed at the Daan/Dajia Rivers was close to 10 m s−1, while at other sites in Central Taiwan it remained at 7 m s−1, and at the Beinan River in southeastern Taiwan it decreased to 5 m s−1. Under the extremely high wind speeds, all riverbed stations observed an increase in PM10 concentration (Figure 5). On 26 and 27 October, the hourly maximum of PM10 was around 350 and 900 µg m−3 at the Daan/Dajia Rivers, respectively, while at the Zhuoshui River, it exceeded 800 µg m−3 on both days (also see Figure 2). The PM10 concentration of the Dadu and Beinan Rivers is lower, but the maximum hourly value is also about 200 µg m−3. In addition, the hourly PM10 concentrations at the Sanyi background station in Central Taiwan during the entire event was less than 70 µg m−3 (Figure 5a), indicating the impacts of long-range transport of aerosol from the Asian continent were small. Also, note that although the prevailing wind was strong throughout the day, the riverbed dust concentration was only enhanced during the day and reached its peak at noon time, when the temperature was warmer and relative humidity of all the rivers decreased to less than 60%, indicating these conditions are conducive to riverbed dust generation.
Among all the rivers, the Zhuoshui River has more obvious riverbed dust enhancement than other rivers (Figure 5c). Except for the extremely high PM10 concentration on 26 and 27 October, PM10 concentration exceeding 200 µg m−3 continued for several days in the river until 31 October. The maximum hourly wind speed observed on the Zhuoshui River during the event (7 m s−1) was lower than the wind speed observed on the Daan/Dajia Rivers (10 m s−1), and was roughly the same as the wind speed observed on the Dadu River. In addition, the temperature (23–24 °C) and relative humidity (49–58%) at the peak PM10 concentration from 27 to 31 October are similar to those of the Dadu River (21–25 °C, 46–60%). However, the maximum concentration of PM10 in the Zhuoshui River was more than 800 µg m−3 and PM10 enhancement lasted for a few days, while the concentration in the Dadu River reached 200 µg m−3 only in the first two days. This suggests that in addition to meteorological conditions, different riverbed characteristics are critical to riverbed dust generation.
After the typhoon, the PM10 concentrations of most rivers decreased, but the opposite occurred in the Beinan River (Figure 5d). From 30 October to 2 November 2010, high PM10 concentrations were observed in the Beinan River at noon time, and the maximum concentration exceeded 500 µg m−3. The wind speed on these days only reached around 4 m s−1, and was less than the peak wind speed (close to 5 m s−1) during the typhoon period. However, the Beinan River is located on the southeastern coast of Taiwan, directly facing the warm and humid air brought by the typhoon’s peripheral circulation, which suppressed the uplifting of dust particles from riverbeds. After the typhoon left, the northeast monsoon followed and the relative humidity decreased to a minimum below 40%. Thus, the riverbed dust particles were uplifted under windy and dry conditions, showing the importance of humidity as a factor. In addition, Figure 5d shows that the PM10 concentration in the town near the riverbed increased during this period. Similarly, the PM10 concentrations in towns near other riverbeds also increased during the typhoon period (Figure 5). Since the concentration of PM2.5 in towns and PM10 in the background Sanyi station were both low during the event, indicating low local pollution or foreign dust concentrations. The high PM10 concentration in towns suggests that the coarse particles from riverbeds have affected those nearby towns.
The second selected weather type is without typhoon, which occurred from 20 November to 30 November 2010, and Figure 6 shows the observed data of this type. In this type, three meteorological stages were observed, including ahead of a surface front, ahead of an anticyclonic system, and behind an anticyclonic system. At the beginning of this type on 21 November, a surface front was approaching Taiwan (Figure 4b). At this time, the wind speed was low and the atmosphere was stable. In addition, due to the approach of the cyclonic circulation of the low-pressure system, southwesterly winds were easily seen in some areas of Western Taiwan [36], causing the pollutants to accumulate over the marginal sea and northwestern Taiwan. In the riverbed area of Central Taiwan, the sea breeze from the northwest prevailed at noon time, bringing pollutants into the riverbed areas (Figure 6a–c). Under the northwesterly wind, high PM10 concentration was observed over the Daan/Dajia Rivers, with the maximum value exceeding 400 µg m−3 (Figure 6a). Since concentrations of PM10 in the Sanyi background station and the PM2.5 in riverside towns were both about 200 µg m−3 at the same time, it suggests that other than the riverbed dust raised by the wind speed, the pollutants carried by the westerly wind affected the riverbeds of the Daan/Dajia Rivers and surrounding areas. The PM10 concentration of other rivers in Central Taiwan also increased, but the time was slightly delayed from north to south (Figure 6b,c).
After the frontal passage on early 22 November, the northeast monsoon prevailed ahead of the anticyclonic system. On 25 November, another anticyclonic system with a strong pressure gradient affected Taiwan and once again triggered strong northeasterly winds. Figure 6 shows that the Daan/Dajia Rivers were affected by wind speeds close to 6 m s−1 and 7 m s−1 at noon time on 22 and 25 November, respectively. On the same days, the Dadu and Zhuoshui Rivers exceeded 4 m s−1 and 5 m s−1, respectively, while the Beinan River was about 3 m s−1 on both days. The wind direction was northeasterly in the Daan/Dajia Rivers, the same as in the typhoon type, but turned into northerly or northwesterly in the Dadu and Zhuoshui Rivers due to the eastward movement of the anticyclone and its interaction with the terrain. The northwesterly wind was seen in the Beinan River, but unlike the rivers in Central Taiwan, the local sea breeze from the south also prevailed during the daytime (Figure 6d). However, although the humidity of all rivers is approximately the same, only a significant increase in PM10 was observed on the Zhuoshui and Beinan Rivers. At noon time on 22 and 25 November, the hourly PM10 peak value of the Zhuoshui River reached about 400 µg m−3 (Figure 6c). During these stages, the PM2.5 and PM10 concentrations were not high in the riverside town and background Sanyi station, suggesting that the high value of suspended particles was mainly from riverbed dust. Similarly, on 25 November, PM10 concentration close to 200 µg m−3 was also observed on the Beinan River when the northeasterly wind prevailed (Figure 6d). Interestingly, the PM10 concentration in the riverside town reached 350 µg m−3, much higher than observed over the riverbed. Although the PM10 concentration in the Sanyi background station in Central Taiwan is low (less than 42 µg m−3), according to the EPA background station over the northeastern tip of Taiwan (Wanli Station), the maximum hourly PM10 concentration observed on that day was close to 140 µg m−3. Therefore, in addition to the dust generated from the riverbed, the PM10 in the riverside town of Beinan River may be partially affected by the long-range transport of coarse particles (such as Asian dust) due to its location over the southeastern coast and directly facing the northeasterly wind.
Late on 26 November, the center of the anticyclonic system left the coastal areas of China and passed over the marginal sea to the north of Taiwan (Figure 4d). Meteorological conditions had shifted to the stage of the behind anticyclonic system. The prevailing wind changed from northeasterly to easterly winds over northern Taiwan, and the wind speed also weakened (Figure 4d). At this stage, most of the riverbed areas were heavy polluted and the PM2.5 concentrations were high (Figure 6). At the same time, the PM10 at the Sanyi background station also reached more than 100 µg m−3, suggesting a high concentration of particles imported from abroad. In addition to the long-range transport, there were also a few cases of high dust concentration in riverbeds during the daytime. For example, at noon on 28 November, an hourly PM10 of 400 µg m−3 was observed over the Zhuoshui River. At the same time, the relative humidity was extremely low, reaching a minimum of around 40%, and was favorable for riverbed emission under a maximum wind speed of 3.5 m s−1. At night, high concentrations of PM10 were also observed, especially in the Dadu River (Figure 6b). The land breeze from the east suggests that the high concentration of the river is related to the pollution of the main city in Central Taiwan (Taichung), which is located 10 km to the east of the river.
4.3. Summary of Two Types
Table 2 summarizes the times, peak PM10 concentrations, and the corresponding meteorological conditions at the peak concentration for each weather type in Table 1. There are 6–11 cases for each type. One case in Table 2 represents one day listed in Table 1. In Table 2, September and October are the months in which the typhoon type cases occurred (also see Table 1). Because there are more typhoon cases observed in October in the Zhuoshui River, they are listed as the main month and river in Table 2. The result in Table 2 explains that in Figure 3d, the higher PM10 exceedance hours observed in October, especially in the Zhuoshui River, resulted from typhoons. In the non-typhoon type in Table 2, the riverbed events in ahead of front, ahead of anticyclone, and behind anticyclone stages were mainly observed in April, December, and both February and April, respectively. Riverbed events in these weather stages were mainly observed in the Zhuoshui and Dadu Rivers.
Table 2. Summary of the aerosol and weather conditions for riverbed events in Table 1, including number of cases, main month and river of the weather type, time of peak concentration, mean peak PM10 concentrations, and mean PM2.5 concentrations in town, mean peak PM10 concentrations in Sanyi background station, mean wind speed (WS), percentage of wind direction (WD), mean temperature (T), and mean relative humidity (RH) at peak PM10 concentrations.
| Types | # of Case | Main Month/River | Time of Peak PM10 (µg m−3) |
Peak PM10 (µg m−3) |
PM2.5 in Town (µg m−3) |
Sanyi PM10 (µg m−3) |
WS (m s−1) |
WD (%) |
T (°C) |
RH (%) |
|
|---|---|---|---|---|---|---|---|---|---|---|---|
| Typhoon | 9 | October/ Zhuoshui |
morning noon |
626 | 37 | 62 | 6.5 | NE:89 NW:11 |
25 | 60 | |
| Non-Typhoon | Ahead of Front |
6 | April/ Dadu, Zhuoshui |
morning noon night |
272 | 128 | 145 | 1.4 | NW:66 SE:17 NE:17 |
23 | 78 |
| Ahead of Anticyclone |
6 | December/ Zhuoshui |
daytime | 428 | 64 | 62 | 5.2 | NE:50 NW:50 |
20 | 60 | |
| Behind Anticyclone |
11 | February, April/ Dadu |
morning night |
301 | 132 | 147 | 0.7 | NE:55 SE:27 NW:18 |
19 | 79 | |
In addition, Table 2 shows the time of peak PM10 concentration for each type. We roughly classified the time of day as morning (06:00–09:00 local time), noon time (10:00–15:00 local time), afternoon (16:00–17:00), and night (18:00–05:00). Although more peak concentrations of riverbed events were observed at noon time from 11:00 to 15:00, peak concentrations were also observed in the morning in the typhoon type. For example, on the Daan/Dajia and Zhuoshui Rivers, a typhoon type on 28 September 2012 was observed at 8:00–9:00 a.m. The occurrence time of the typhoon type is similar to that in the ahead of anticyclone stage, except that the peak time of the ahead of anticyclone stage appears to be more extended, and was observed from 09:00 to 15:00 during the day. These two types also explain that the high concentrations of PM10 in Figure 3e appeared at noon time and a few in the morning. Different from these two types, in the ahead of front stage, peak PM10 concentration appeared throughout the day, while in the behind anticyclone stage, peak PM10 concentration was only observed in the morning and at night. Thus, the peak PM10 concentrations in these two stages resulted from different mechanisms.
Table 2 also lists the average concentration of the peak PM10 in the riverbed, peak PM2.5 of the riverside town, and peak PM10 concentration of the day at the Sanyi background station for each weather type. Among them, the peak PM10 concentration in the riverbed caused by the typhoon types exceeded 600 µg m−3 on average, which is the highest concentration of all types. The ahead of anticyclone stage of the non-typhoon type exceeding 400 µg m−3 is the second highest concentration. In addition, the PM2.5 concentration of these two types is low, with an average of 37 to 64 µg m−3, respectively, indicating that the concentration of pollutants from either local areas or imported is low. Furthermore, during these two types of events, the highest concentration of PM10 at the Sanyi background station in Central Taiwan is about 60 µg m−3, implying that the contribution from Asian dust was low. Therefore, the high riverbed PM10 concentrations of these two types is mainly caused by the riverbed dust generation. On the contrary, the PM10 in the ahead of front and behind anticyclone stages in the non-typhoon types are both around 300 µg m−3 on average, but their PM2.5 concentration is higher, both being about 130 µg m−3, indicating that part of the riverbed aerosol may come from pollution rather than riverbed emission. Also, the background PM10 concentration at Sanyi is close to 150 µg m−3 on average, indicating that the pollution from the Asian continent contributes a lot during these two weather stages.
The influence of the surface wind speed and wind direction on riverbed dust generation is also shown in Table 2. At the peak PM10 concentrations of the typhoon type, the surface wind speeds reach an average value of 6.5 m s−1, while more than 5 m s−1 in the ahead of anticyclone stage, and thus high wind speed is critical for riverbed dust generation. In the typhoon type, the wind directions are mostly northeasterly winds, but in the ahead of anticyclone type, only half of the wind directions are northeasterly winds, and the other half are northwesterly winds. Similarly, Tsai et al. [36] also reported that after a frontal passage over Taiwan, the wind direction changes from northwesterly to northeasterly in Northern Taiwan. In contrast to these two types, the averaged wind speeds in the stages of ahead of front and behind anticyclone are lower, with only 1 m s−1 of average wind speed. In addition, the wind directions of these two types are more diversified, and northeasterlies, northwesterlies, and southeasterlies were all observed in both types at the peak PM10 concentrations. Among them, northwesterly is the main wind direction in the ahead of front stage of the non-typhoon type. As discussed in the case study, most of it is related to the sea breeze during the day and the cyclonic circulation, and the wind direction may carry pollutants to the riverbeds. The southeasterlies in the two stages are mostly observed in the Dadu River. The main city in Central Taiwan is located to the east of the river, and the land breeze can carry pollutants to affect the concentration of the river. Northeasterly is the main wind direction for the behind anticyclone stage. The high concentrations of PM2.5 at the riverside town and PM10 at the background station show that the riverbed is affected by local pollution and foreign aerosol at this time. This is because during the winter monsoon, northeasterly winds can bring pollution from Asia, resulting in high background pollution in Taiwan. Liu et al. [23] and Hung et al. [26] also showed that due to the long-range transport of dust or pollutant from the Asian continent, the averaged background concentration of PM10 in Northern Taiwan can be as high as 100 µg m−3 during the event, and April is the month with the highest background concentration. Our results are consistent with those studies.
The average temperature and relative humidity in Table 2 also give an explanation for the high PM10 concentration in the riverbeds. The typhoon type has the highest average temperature (25 °C), and the weather is usually warm and humid. However, this type of low relative humidity also shows that the moist air has not reached Central Taiwan, where most of the rivers are located, so it is conducive to dust emissions. For the ahead of anticyclone type, the temperature is lower (20 °C), but the dry air (mean humidity of 60%) is also favorable for riverbed emissions. In contrast, the behind anticyclone and ahead of front stages in the non-typhoon types both have high humidity close to 80%. Particularly for the behind anticyclone stage, the cold and humid air is not favorable for dust emission, and thus the riverbed events were significantly affected by local pollutant or foreign aerosol.
4.4. Monthly and Hourly Mean Meteorology
Table 2 shows that the riverbed events were mainly observed during different weather stages in December, February, and April, respectively, and also often observed at noon time. To further explain the high riverbed PM10 concentrations observed in these months rather than in the same weather stages of other months and times, the monthly and hourly mean wind speed, temperature, relative humidity, and precipitations of all the rivers are plotted and the general meteorological conditions are discussed (Figure 7). Figure 7a shows that during the winter monsoon from October to April, higher monthly average wind speeds were observed in all the rivers than in the summer monsoon. In addition, the peak monthly wind speeds were observed from December to February. Thus, during the ahead of anticyclone stage of these months, the strong wind speeds can result in higher riverbed emission compared to other months. In contrast, April is at the end of winter monsoon. The wind speed decreases (Figure 7a) and thus the weak wind speed behind the anticyclone can easily result in the accumulation of local pollution compared to other months, and enhance the riverbed concentration. In addition, a previous study [23] also found that in December and April, the amount of Asian dust transported to Northern Taiwan was higher than in other months. Under high background concentration, more riverbed events can also be observed. However, January is the month with the lowest riverbed concentration (Figure 3), despite the maximum wind speed of the months. It is possible that due to the low temperature in January (Figure 7b), Asian deserts are easily covered by snow, resulting in the reduction of Asian dust emissions and transport. The low foreign dust concentration in this month also resulted in the lower PM10 concentration in the riverbed areas. The similar low PM10 concentration is also seen in a previous study of Northern Taiwan [23].
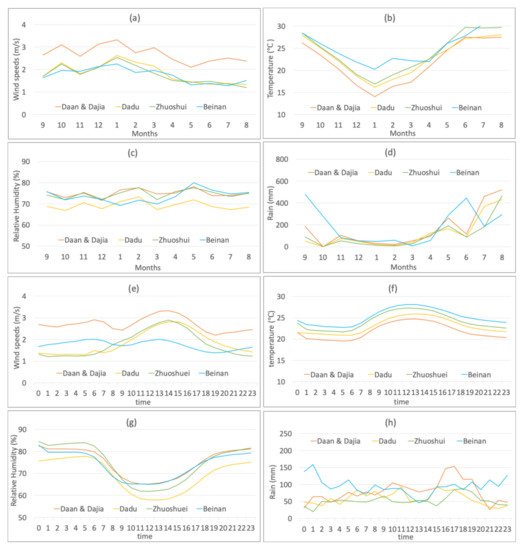
Figure 7. Monthly and hourly mean (a,e) wind speeds, (b,f) temperatures, and (c,g) relative humidity obtained from riverbed monitoring stations, and (d,h) rainfall amounts obtained from the closest EPA monitoring stations adjacent to each of the riverbed stations.
In addition, Figure 7c shows that the monthly average relative humidity is around 70% for all the rivers, and Figure 7d shows that rainfall in all the rivers during the winter monsoon is extremely low, different from that during the summer monsoon (May to September). The dry condition is favorable for riverbed dust generation during those months.
The average meteorological values in a day (Figure 7e–h) show that higher wind speeds often occur around noon for all the rivers, and the maximum wind speed is between 13:00–14:00. The highest temperature was also observed at noon, while the hourly average relative humidity of all rivers reaches a minimum at noon time. The strong wind speed, high temperature, and low humidity at noon time are conducive to dust emission from the riverbed, as shown in Table 2. Furthermore, the hourly average rainfall in Figure 7h shows that the 24-h rainfall of all rivers remains mostly around 50 mm to 100 mm. Among them, the minimum mean precipitation was observed over the Zhuoshui River most of the time, which may be one of the reasons for the high riverbed PM10 concentration shown in Figure 3.
References
- Wang, W.; Huang, J.; Minnis, P.; Hu, Y.; Li, J.; Huang, Z.; Ayers, J.K.; Wang, T. Dusty cloud properties and radiative forcing over dust source and downwind regions derived from A-Train data during the Pacific Dust Experiment. J. Geophys. Res. Atmos. 2010, 115, D4.
- Chen, S.; Huang, J.; Kang, L.; Wang, H.; Ma, X.; He, Y.; Yuan, T.; Yang, B.; Huang, Z.; Zhang, G. Emission, transport, and radiative effects of mineral dust from the Taklimakan and Gobi deserts: Comparison of measurements and model results. Atmos. Chem. Phys. 2017, 17, 2401–2421.
- Zhou, T.; Xie, H.; Bi, J.; Huang, Z.; Huang, J.; Shi, J.; Zhang, B.; Zhang, W. Lidar Measurements of Dust Aerosols during Three Field Campaigns in 2010, 2011 and 2012 over Northwestern China. Atmosphere 2018, 9, 173.
- Zhou, T.; Xie, H.; Jiang, T.; Huang, J.; Bi, J.; Huang, Z.; Shi, J. Seasonal characteristics of aerosol vertical structure and autumn enhancement of non-spherical particle over the semi-arid region of northwest China. Atmos. Environ. 2021, 244, 117912.
- Charlson, R.J.; Schwartz, S.E.; Hales, J.M.; Cess, R.D.; Coakley, J.A.; Hansen, J.E.; Hofmann, D.J. Climate forcing by anthropogenic aerosols. Science 1992, 255, 423–430.
- Sokolik, I.N.; Toon, O.B. Direct radiative forcing by anthropogenic airborne mineral aerosols. Nature 1996, 381, 681–683.
- Ramanathan, V.C.P.J.; Crutzen, P.J.; Kiehl, J.T.; Rosenfeld, D. Aerosols, climate, and the hydrological cycle. Science 2001, 294, 2119–2124.
- Kaufman, Y.J.; Tanre, D.; Boucher, O.A. Satellite view of aerosols in the climate system. Nature 2002, 419, 215–223.
- DeMott, P.J.; Sassen, K.; Poellot, M.R.; Baumgardner, D.; Rogers, D.C.; Brooks, S.D.; Prenni, A.J.; Kreidenweis, S.M. African dust aerosols as atmospheric ice nuclei. Geophys. Res. Lett. 2003, 30, 1732.
- Huebert, B.J.; Bates, T.; Russell, P.B.; Shi, G.Y.; Kim, Y.J.; Kawamura, K.; Carmichael, G.; Nakajima, T. An overview of ACE-Asia: Strategies for quantifying the relationships between Asian aerosols and their climatic impacts. J. Geophys. Res. 2003, 108, D23.
- Vickery, K.J.; Eckardt, F.D. Dust emission controls on the lower Kuiseb River valley, Central Namib. Aeolian Res. 2013, 10, 125–133.
- Dansie, A.P.; Wiggs, G.F.S.; Thomas, D.S.G.; Washington, R. Measurements of windblown dust characteristics and ocean fertilization potential: The ephemeral river valleys of Namibia. Aeolian Res. 2017, 29, 30–41.
- Von Holdt, J.R.; Eckardt, F.D. Dust activity and surface sediment characteristics of the dustiest river in southern Africa: The Kuiseb River, Central Namib. South Afr. Geogr. J. 2018, 100, 104–121.
- Lin, C.W.; Yeh, J.F. Estimating dust emission from a sandbank on the downstream Jhuoshuei River under strong wind conditions. Atmos. Environ. 2007, 41, 7553–7561.
- Kuo, S.C.; Hsieh, L.Y.; Tsai, C.H.; Tsai, Y.I. Characterization of PM2.5 fugitive metal in the workplaces and the surrounding environment of a secondary aluminum smelter. Atmos. Environ. 2007, 41, 6884–6900.
- Lin, C.Y.; Tsai, S.F.; Chuang, C.W. Delineation and management of dust emission potential areas on riverbed. J. Chin. Soil Water Conserv. 2008, 39, 367–377.
- Bachmeier, A.S.; Newell, R.E.; Shipham, M.C.; Zhu, Y.; Blake, D.R.; Browell, E.V. PEM-West A: Meteorological overview. J. Geophys. Res. 1996, 101, 1655–1677.
- Water Resources Agency, Taiwan. (in Chinese). Available online: https://www.wra.gov.tw/cl.aspx?n=3270. (accessed on 4 January 2021).
- Shih, T.T.; Chang, J.C.; Lin, H.M. A geomorphological study on the estuaries in northern Taiwan. Geogr. Res. 1996, 26, 1–38.
- Liang, S.; Wang, Y.J.; Tzou, W.J. A study on utilization mechanism for unsubmerged lands along river channels during low flows. J. Soil Water Conserv. 1999, 31, 123–137.
- Environmental Protection Administration. Evaluation of Aeolian Dust from Rivers on the Aerosol in Central Taiwan; EPA-097-fa14-03-a042; The Research Project of Environmental Protection Administration: Taipei, Taiwan, 2009. (In Chinese)
- Environmental Protection Administration, Taiwan. Available online: https://airtw.epa.gov.tw/ENG/TaskMonitoring/RiverDust/RiverDustIntro.aspx. (accessed on 4 January 2021).
- Liu, T.H.; Tsai, F.; Hsu, S.C.; Hsu, C.W.; Shiu, C.J.; Chen, W.N.; Tu, J.Y. Southeastward transport of Asian dust: Source, transport and its contributions to Taiwan. Atmos. Environ. 2009, 43, 458–467.
- Tsai, F.J.; Fang, Y.S.; Huang, S.J. Case Study of Asian Dust Event on March 19–25, 2010 and Its Impact on the Marginal Sea of China. J. Mar. Sci. Technol. 2013, 21, 353–360.
- Tsai, F. Model simulation of Asian dust and iron depositions over the East Asian marginal seas. J. Mar. Sci. Technol. 2013, 21, 460–468.
- Hung, W.T.; Lu, C.H.S.; Wang, S.H.; Chen, S.P.; Tsai, F.; Chou, C.C.K. Investigation of long-range transported PM2.5 events over Northern Taiwan during 2005–2015 winter seasons. Atmos. Environ. 2019, 217, 116920.
- Lin, C.W.; Yeh, J.F.; Kao, T.C. Source characterization of total suspended particulate matter near a riverbed in Central Taiwan. J. Hazard. Mater. 2008, 157, 418–422.
- Kuo, C.Y.; Lin, C.Y.; Huang, L.M.; Wang, S.; Shieh, P.F.; Lin, Y.R.; Wang, J.Y. Spatial variations of the aerosols in river-dust episodes in central Taiwan. J. Hazard. Mater. 2010, 179, 1022–1030.
- Kuo, C.Y.; Yang, H.J.; Chiang, Y.C.; Lai, D.J.; Shen, Y.H.; Liu, P.M. Concentration and composition variations of metals in the outdoor PM 10 of elementary schools during river dust episodes. Environ. Sci. Pollut. Res. 2014, 21, 12354–12363.
- Kuo, C.Y.; Hsieh, C.Y.; Hu, C.W.; Chen, S.C.; Yang, H.J. PM10 concentration in relation to clinic visits for anxiety disorders: A population-based study of a high river-dust episode region in Taiwan. Air Qual. Atmos. Health 2018, 11, 221–227.
- Syu, J.Y.; Cheng, Y.C.; Kao, Y.Y.; Liang, C.S.; Yan, Y.L.; Lai, C.Y.; Chang, C.T.; Chen, C.C.; Young, C.Y.; Wu, Y.L.; et al. The horizontal and vertical characteristics of Aeolian dust from riverbed. Aerosol Air Qual. Res. 2016, 16, 3026–3036.
- Chiang, Y.C.; Yang, H.J.; Chen, S.C.; Hu, C.W.; Tsai, C.T.; Lai, D.J.; Kuo, C.Y. Inhalation exposure of children to indoor PM 10 and associated metals during river-dust episodes. Air Qual. Atmos. Health 2017, 10, 381–388.
- Giri, D.; Adhikary, P.R.; Murthy, V.K. The influence of meteorological conditions on PM10 concentrations in Kathmandu Valley. Int. J. Environ. Res. 2008, 2, 49–60.
- Nguyen, M.V.; Park, G.H.; Lee, B.K. Correlation analysis of size-resolved airborne particulate matter with classified meteorological conditions. Meteorol. Atmos. Phys. 2017, 129, 35–46.
- Wei, P.; Cheng, S.; Li, J.; Su, F. Impact of boundary-layer anticyclonic weather system on regional air quality. Atmos. Environ. 2011, 45, 2453–2463.
- Tsai, F.; Liu, T.H. Modeling study of three consecutive high ozone episodes over Taiwan in spring 2007. Atmos. Environ. 2013, 80, 131–139.
More
Information
Subjects:
Meteorology & Atmospheric Sciences
Contributor
MDPI registered users' name will be linked to their SciProfiles pages. To register with us, please refer to https://encyclopedia.pub/register
:
View Times:
791
Revisions:
2 times
(View History)
Update Date:
17 Jan 2022
Table of Contents


Notice
You are not a member of the advisory board for this topic. If you want to update advisory board member profile, please contact office@encyclopedia.pub.
OK
Confirm
Only members of the Encyclopedia advisory board for this topic are allowed to note entries. Would you like to become an advisory board member of the Encyclopedia?
Yes
No
${ textCharacter }/${ maxCharacter }
Submit
Cancel
Back
Comments
${ item }
|
${ item.createdUser.fullName }
${ item.createdAt }
${ item.vote }
${ item.reply }
Delete
${ reply.createdUser.fullName }
${ reply.createdAt }
${ reply.vote }
Delete
There is no reply to this comment~
${ item.replyTextCharacter }/${ item.replyMaxCharacter }
Submit
Cancel
More
No more~
There is no comment~
${ textCharacter }/${ maxCharacter }
Submit
Cancel
${ selectedItem.replyTextCharacter }/${ selectedItem.replyMaxCharacter }
Submit
Cancel
Confirm
Are you sure to Delete?
Yes
No