Your browser does not fully support modern features. Please upgrade for a smoother experience.
Submitted Successfully!
 +1 credit
Thank you for your contribution! You can also upload a video entry or images related to this topic.
For video creation, please contact our Academic Video Service.
| Version | Summary | Created by | Modification | Content Size | Created at | Operation |
|---|---|---|---|---|---|---|
| 1 | Taher Hatahet | + 1800 word(s) | 1800 | 2021-12-28 07:13:47 | | | |
| 2 | Jessie Wu | -151 word(s) | 1649 | 2021-12-31 02:20:15 | | | | |
| 3 | Jessie Wu | -151 word(s) | 1649 | 2021-12-31 02:21:39 | | | | |
| 4 | Jessie Wu | Meta information modification | 1649 | 2021-12-31 08:01:54 | | | | |
| 5 | Jessie Wu | Meta information modification | 1649 | 2021-12-31 08:10:29 | | |
Video Upload Options
We provide professional Academic Video Service to translate complex research into visually appealing presentations. Would you like to try it?
Cite
If you have any further questions, please contact Encyclopedia Editorial Office.
Hatahet, T. Virtual Learning Engagement and Student Academic Performance. Encyclopedia. Available online: https://encyclopedia.pub/entry/17663 (accessed on 24 July 2026).
Hatahet T. Virtual Learning Engagement and Student Academic Performance. Encyclopedia. Available at: https://encyclopedia.pub/entry/17663. Accessed July 24, 2026.
Hatahet, Taher. "Virtual Learning Engagement and Student Academic Performance" Encyclopedia, https://encyclopedia.pub/entry/17663 (accessed July 24, 2026).
Hatahet, T. (2021, December 30). Virtual Learning Engagement and Student Academic Performance. In Encyclopedia. https://encyclopedia.pub/entry/17663
Hatahet, Taher. "Virtual Learning Engagement and Student Academic Performance." Encyclopedia. Web. 30 December, 2021.
Copy Citation
This project aims to better understand the relationship among online engagement indicators, continuous assessment marks and personal factors in predicting student performance in final exams.
academic performance
modelling
correlation
education
Virtual learning environment
1. Background
Technology has been increasingly used and applied in many aspects of science. The new era of the digitalised world has also affected higher education. As social media have developed, virtual learning environments (VLEs) have been designed to create an online space for student learning and development. VLEs enable students to access learning resources remotely, such as lecture notes, videos, or quizzes for self-assessment to test learner’s understanding. They also provide discussion forums to enable asynchronous interactions between peers and teachers [1]. The online teaching and learning environment has not only changed the student learning experience, but has also facilitated teaching for educators. Further, it has opened the door for transnational education to evolve. High-ranking universities with campuses in different geographic locations now rely on VLE technology to deliver teaching remotely [2]. The VLE infrastructure is not limited to the teacher student interface. Analytics of student interaction with the VLE content can now be used to indirectly track and follow a student’s learning experience [3].
VLEs with multiple functionalities and tools have been used to monitor student engagement and interaction with content and different learning resources. According to Kuh, “Student Engagement is the extent to which (students) take part in educationally effective practices” [4]. In addition, the National Survey of Student Engagement was established in 1999 to reflect on the role of engagement in student learning and development [5]. Student engagement has been shown to be a key parameter for better learning experiences and higher academic attainment [6][7]. Furthermore, engagement has been shown to be even more important when part or all of a degree is delivered remotely. However, remote teaching is a dichotomy of the opportunities that come with the endless capabilities of the online teaching environment and the disadvantages that come with the learning process being reliant on student self-esteem, motivation and engagement [8]. Although students studying at distance in transnational education are offered a range of remote activities that enable student self-assessment [9], further support is needed to help students understand their own performance compared to a more defined success scale set up by educators themselves [10]. Therefore, if poorly engaging students can be identified before final summative assessments, educators would then be able to take an essential preventive approach to support students [10].
Canvas is an example of a top-ranked VLE and is used by Queen’s University Belfast (QUB) in the delivery of both undergraduate and postgraduate teaching [11]. Canvas provides a friendly learning environment for both teachers and students. It enables educators to merge videos, voice recordings, written texts, images, quizzes, and discussions in any educationally suitable manner they wish. Lectures can be structured as webpages with multiple sorts of information and these pages can be linked to quizzes or discussions [12]. For students, Canvas gathers deadlines in a comprehensive calendar, sends out submission reminders and links students to educators by sending pop up notifications to their smartphone application each time a lecturer posts a new announcement to Canvas [13]. Canvas also has several tools in the course analytics section that can indirectly reflect on student engagement with the taught materials. The appropriate use of these tools can help educators generate a progress scale, which students can use to assess their own performance and educators can use to identify at-risk students.
Canvas VLE engagement indicators are mainly the total number of page views, the last page view, which reflects the student’s last page view, and the total number of participations. VLE engagement indicators alongside coursework marks collected throughout the year can be a useful predictive tool for future student exam performance. However, each of these indicators cannot be used alone in making decisions on students’ engagement or academic performance. Linking these indicators with coursework marks in a comprehensive model with input and output data can take advantage of each indicator, giving each indicator its appropriate weight and appreciation. Creating a predictive model would help educators perform preventive actions for students at risk of failure due to disengagement or low coursework marks. In parallel, publishing the generated model for students would help them to correctly adjust their own progress based on their self-assessment which becomes better calibrated with time [8].
2. Effect of Outliers on Individual Indicators Relationship to Exam Marks
Figure 1 presents the individual relationship of each variable to the student exam mark including all students (with outliers). It was observed that the Pearson correlation coefficients (R-value) coming from VLE report 2 variables were better than the data obtained in VLE report 1, which was generated early in the academic year in terms of the total participation (A vs. D) and last page view (B vs. E). However, both parameters alone did not show a strong correlation to exam marks. Higher R-values were observed with total page views than with other parameters without changing in terms of correlation to the exam mark over the course of the year. In the same manner, practicals and assignments alone failed to show strong relationships to the final exam mark with R values of less than 0.4.
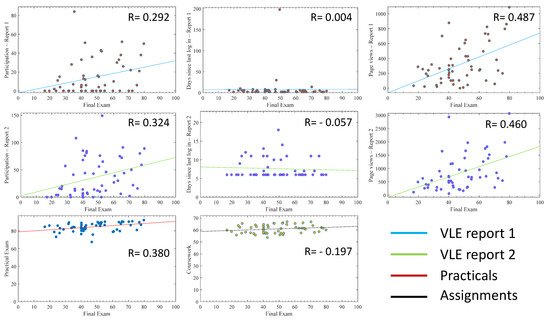
Figure 1. The relationship of individual variables with the final exam mark plotted as scatter with a least-square line including all students (with outliers). The y-axis represents the value of the indicator (total participation number, number of days since last login and total number of page views) or the coursework and practical marks per student (x-axis). The R-value is the Pearson correlation coefficient. Graphs are plotted with the final exam mark on the x-axis and each variable on the y-axis. VLE stands for virtual learning environment.
By removing the outliers from the models (Figure 2), all the correlation coefficients generated from VLE engagement indicators improved. This increase was not apparent in variables H and G, related to coursework marks. With regards to the R-values, variables D (total participation) and F (total page views) in VLE report 2 were the highest and were selected for modelling with a reduced number of variables in the model. Variables G (practicals) and H (assignments) were much more stable to outliers and were also selected for reduced number of variable modelling. It is worth mentioning that the outliers were identified to be eight students.
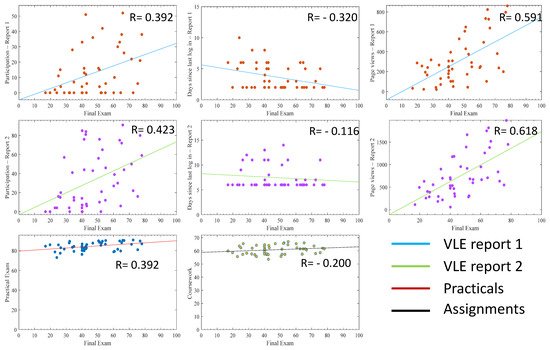
Figure 2. The relationship of individual variables with the final exam mark plotted as scatter with a least-square line including all students (without outliers). The y-axis represents the value of the indicator (total participations number, number of days since last log in, total number of pages views) or the coursework and practicals marks per student (x-axis). The R-value is the Pearson correlation coefficient. Graphs are plotted with the final exam mark on the x-axis and each variable on the y-axis. VLE stands for virtual learning environment.
3. Modelling Using All Variables
When all variables were used in the creation of the model in a simple linear regression model, Equation (1) was obtained with a correlation coefficient of 0.6 (Figure 3 and Table 1). With regards to the weight of each variable in Equation (1), the H and G (coursework marks) variables are the main contributors to the equation. Last page view (E) extracted from the VLE engagement report 2 also has a higher contribution to the model than other VLE engagement indicators. The generated model was statistically significant with a p-value < 0.01 (Table 1). In relation to optimisation of the equation with a correlation coefficient of 1, the optimisation step was carried out with a new predictor (adjusting variable X) in Equation (2) (Figure 3). Equation (2) reinforced the remark that variables H and G (coursework marks) are high contributors in predicting final exam marks. From the VLE engagement point of view, the variable E (Last page view) from report 2 seemed to be crucial as well as an indicator with its high weighting reflecting a student’s overall engagement with the VLE having also accessed the VLE late in term. Equation (2) highlights the huge impact of the personal variable X on Y (exam marks), where this variable X could be more of a personal factor of behavioural origin amongst students. The X optimised generated model was statistically significant with p-value < 0.001 and a perfect fit (R2 = 1) (Table 1). The outcome of removing outliers was clear on all variables modelling with the Pearson correlation coefficient increased from 0.6 in Equation (1) to 0.724 in Equation (3) (Table 1). Removing the outliers improved the overall correlations without changing the importance of variables G, H and E for the equations.
Figure 3. List of the generated equations from simple linear regression with or without X variable with all variables or using E (last page view), F (total pages views), G (practicals) and H (assignments).
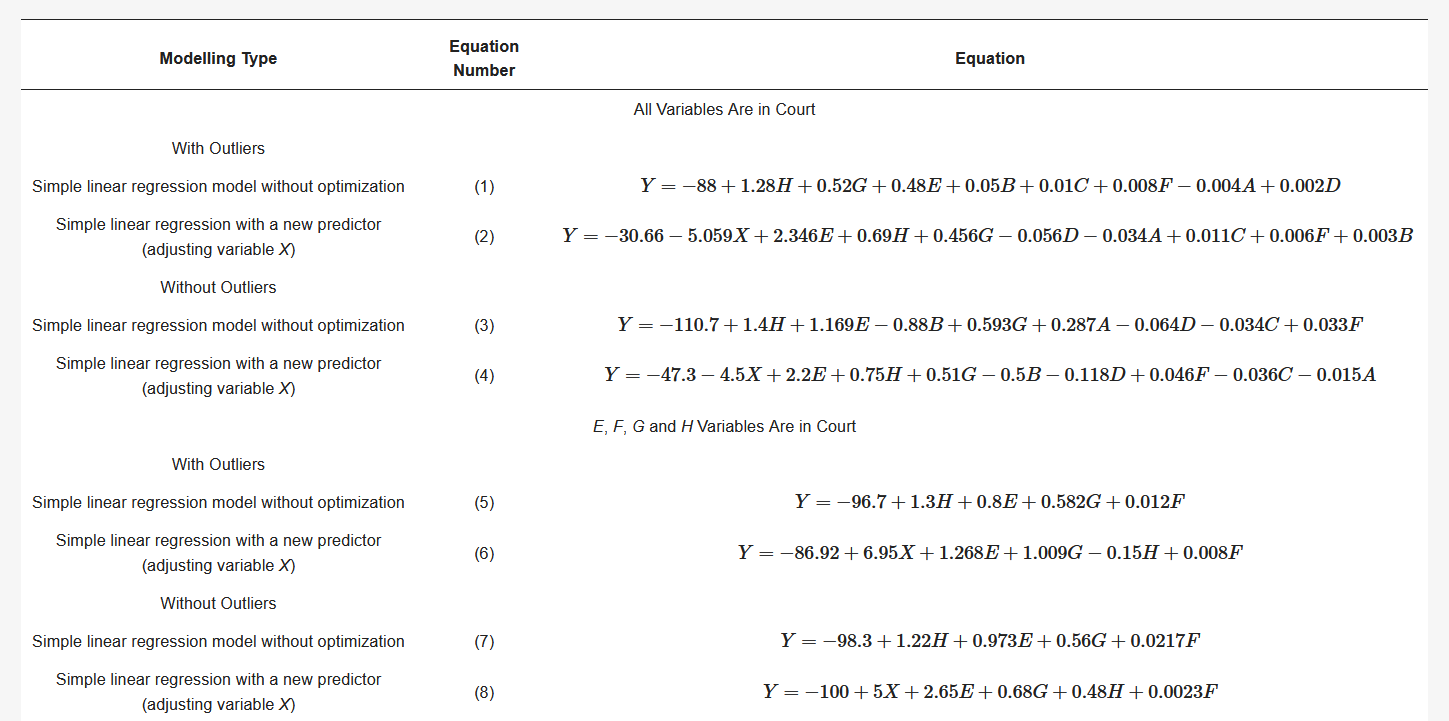
Table 1. Statistical metrics of the generated models, with or without X variable.
| Modelling Type | Equation Number | Number of Observation Error Degrees of Freedom |
Root Mean Squared Error | Pearson Correlation Coefficient R2 Adjusted R2 |
p-Value |
|---|---|---|---|---|---|
| All Variables Are in Court | |||||
| With Outliers | |||||
| Simple linear regression model without optimization | (1) | 55 46 |
14.1 | 0.600 0.350 0.237 |
7.01 × 10⁻³ ** |
| Simple linear regression with a new predictor (adjusting variable X) | (2) | 55 45 |
0.0656 | 1 1 |
2.98 × 10⁻⁶ *** |
| Without Outliers | |||||
| Simple linear regression model without optimization | (3) | 47 38 |
12.4 | 0.724 0.524 0.424 |
1.89 × 10⁻⁴ *** |
| Simple linear regression with a new predictor (adjusting variable X) | (4) | 47 37 |
0.276 | 1 1 |
1.77 × 10−64 *** |
| D, E, G and H Variables Are in Court | |||||
| With Outliers | |||||
| Simple linear regression model without optimization | (5) | 55 50 |
13.6 | 0.585 0.342 0.289 |
2.72 × 10⁻⁴ *** |
| Simple linear regression with a new predictor (adjusting variable X) | (6) | 55 49 |
0.264 | 1 1 |
3.18 × 10−87 *** |
| Without Outliers | |||||
| Simple linear regression model without optimization | (7) | 47 42 |
12.1 | 0.700 0.493 0.445 |
7.28 × 10⁻⁶ *** |
| Simple linear regression with a new predictor (adjusting variable X) | (8) | 47 41 |
0.106 | 1 1 |
1.36 × 10−89 *** |
** and *** are used to indicate p value less than 0.01 and 0.001 respectively.
4. Modelling Using E, F, G and H Variables
Because VLE engagement report 1 variables showed low weight in the generated models, these variables were removed from consideration and new models were created using four variables instead of eight (Figure 3, Equations (5)–(8)). The use of fewer variables affected the overall Pearson correlation coefficients to 0.585 with outliers and to 0.7 without outliers (table 1, Equations (5) and (7)). Again, the removal of outliers improved the correlation and the addition of an X variable showed to predominate in top match equations (Figure 3 and table 1, Equations (6) and (8)).
References
- Weller, M. Virtual Learning Environments: Using, Choosing and Developing Your VLE; Routledge: London, UK, 2007.
- O’Mahony, J. Enhancing Student Learning and Teacher Development in Transnational Education; Higher Education Academy: York, UK, 2014.
- Wolff, A.; Zdrahal, Z.; Nikolov, A.; Pantucek, M. Improving Retention: Predicting at-Risk Students by Analysing Clicking Behaviour in a Virtual Learning Environment. In Proceedings of the Third International Conference on Learning Analytics and Knowledge, Leuven, Belgium, 8–12 April 2013; Association for Computing Machinery: New York, NY, USA, 2013; pp. 145–149.
- Kuh, G.D.; Cruce, T.M.; Shoup, R.; Kinzie, J.; Gonyea, R.M. Unmasking the Effects of Student Engagement on First-Year College Grades and Persistence. J. High. Educ. 2008, 79, 540–563. Available online: http://www.jstor.org/stable/25144692 (accessed on 29 November 2021).
- Axelson, R.D.; Flick, A. Defining Student Engagement. Change Mag. High. Learn. 2011, 43, 38–43.
- Casuso-Holgado, M.J.; Cuesta-Vargas, A.I.; Moreno-Morales, N.; Labajos-Manzanares, M.T.; Barón-López, F.J.; Vega-Cuesta, M. The association between academic engagement and achievement in health sciences students. BMC Med. Educ. 2013, 13, 33.
- Hamane, A. Student Engagement in an Online Course and Its Impact on Student Success. Ph.D. Thesis, Pepperdine University, Malibu, CA, USA, 2014. Available online: https://digitalcommons.pepperdine.edu/etd/428 (accessed on 20 September 2021).
- Boud, D.; Lawson, R.; Thompson, D.G. Does student engagement in self-assessment calibrate their judgement over time? Assess. Eval. High. Educ. 2013, 38, 941–956.
- Boud, D.; Falchikov, N. Developing assessment for informing judgement. In Rethinking Assessment in Higher Education; Routledge: Oxfordshire, UK, 2007; pp. 191–207.
- Boud, D. Enhancing Learning through Self-Assessment; Routledge: London, UK, 2013.
- Grossi, M.G.R.; Elias, M.; Chamon, C.M.; Leal, D. The educational potentialities of the virtual learning environments moodle and canvas: A comparative study. Int. J. Inf. Educ. Technol. 2018, 8, 514–519.
- Endozo, A.N.; Oluyinka, S.; Daenos, R.G. Teachers’ Experiences towards Usage of Learning Management System: CANVAS. In Proceedings of the 2019 11th International Conference on Education Technology and Computers; Association for Computing Machinery: New York, NY, USA, 2019; pp. 91–95.
- al Khoeri, A.F.; Nuraini, W.; Ramdani, R.; Agum, S. The implementation of Canvas to enhance English teaching and learning. In International Conference on Education of Suryakancana (IConnects Proceedings); Suryakancana University: Jawa Barat, Indonesia, 2021.
More
Information
Subjects:
Education & Educational Research
Contributor
MDPI registered users' name will be linked to their SciProfiles pages. To register with us, please refer to https://encyclopedia.pub/register
:
View Times:
1.2K
Revisions:
5 times
(View History)
Update Date:
31 Dec 2021
Table of Contents


Notice
You are not a member of the advisory board for this topic. If you want to update advisory board member profile, please contact office@encyclopedia.pub.
OK
Confirm
Only members of the Encyclopedia advisory board for this topic are allowed to note entries. Would you like to become an advisory board member of the Encyclopedia?
Yes
No
${ textCharacter }/${ maxCharacter }
Submit
Cancel
Back
Comments
${ item }
|
${ item.createdUser.fullName }
${ item.createdAt }
${ item.vote }
${ item.reply }
Delete
${ reply.createdUser.fullName }
${ reply.createdAt }
${ reply.vote }
Delete
There is no reply to this comment~
${ item.replyTextCharacter }/${ item.replyMaxCharacter }
Submit
Cancel
More
No more~
There is no comment~
${ textCharacter }/${ maxCharacter }
Submit
Cancel
${ selectedItem.replyTextCharacter }/${ selectedItem.replyMaxCharacter }
Submit
Cancel
Confirm
Are you sure to Delete?
Yes
No