 +1 credit
| Version | Summary | Created by | Modification | Content Size | Created at | Operation |
|---|---|---|---|---|---|---|
| 1 | Juan Blanco | + 2968 word(s) | 2968 | 2021-12-15 06:55:32 | | | |
| 2 | Yvaine Wei | -9 word(s) | 2959 | 2021-12-28 10:02:02 | | | | |
| 3 | Juan Blanco | -20 word(s) | 2939 | 2021-12-28 11:21:58 | | | | |
| 4 | Yvaine Wei | Meta information modification | 2939 | 2021-12-29 10:01:41 | | | | |
| 5 | Yvaine Wei | Meta information modification | 2939 | 2021-12-29 10:04:41 | | |
Video Upload Options
Forest succession is an ecological phenomenon that can span centuries. Nowadays it is recognized that stochastic events and disturbances play a pivotal role in forest succession. In spite of that, forest maps and management plans around the world are developed and focused on a unique “climax” community, likely due to the difficulty of quantifying alternative succession pathways. Our work demonstrated that a three-pathway stochastic succession model can mimic the observed landscape distribution among different stand types before commercial logging started in the region. We conclude that, while knowing the difficulty of parameterizing this type of models, their use is needed to recognize that for a given site, there may be multiple “climax” communities and hence forest management should account for them.
1. Introduction
Forest succession is an ecological phenomenon that, while having been long recognized, is still hard to adequately characterize and integrate into management practices [1]. After many decades of research, the mechanisms underlying species replacement and successional change in plant communities are still fiercely debated [2]. Forest succession depends on how communities change over time, what type of disturbances occur, the relative role of early- and late-colonizing species, and life-history characteristics of plant species [3]. In particular, there has been a recognition that spatial scale is an important factor in forest succession [4]. In addition, long periods are usually needed to appreciate and document vegetation changes in forest ecosystems. Both facts together indicate that studying forest succession empirically becomes complex [5].
When studying forest succession, the complexity is further increased due to the importance of random or fortuitous events, such as the occurrence of stand-replacing disturbances (i.e., wildfires, windstorms) or the stochastic nature of seed distribution, seedling survival and tree establishment [6]. However, despite recognizing that forest succession mechanisms have a stochastic nature, in many regions around the world, ecological zonation and mapping are carried out only with a focus on climax communities. This somehow ignores that such ecological classification implicitly assumes a Clementsian (non-stochastic) succession process [7]. When large time and spatial scales are considered, random events are less important [8]. Therefore, ecological classification and mapping of large regions may not be much influenced by the underlying assumptions of stochastic vs. non-stochastic succession patterns [9]. However, understanding the relative importance of such processes becomes much more imperative when ecological classification and mapping of climax communities are used as the benchmark for sustainable forest management plans.
One of the main features of sustainable forest management is to maintain forests and their associated ecological values inside their natural variability ranges, which are defined by historical observations [10]. To do so, successional mechanisms should be accurately understood [11], and its stochastic nature embraced. This is particularly important when managing mixed forests, as their successional processes are influenced by intra- and inter-specific competition and species-specific features [12].
As understanding of successional processes expanded, alternatives to deterministic (Clementsian) successional models were created [13][14][15]. These alternative models were based on the stochastic nature of both ecological disturbances and forest regeneration processes. Such models inherently accept that there is not a fixed climax community, but several potential climax communities that may be present in the same region. These alternatives depend on a chain of stochastic events that happened in the past and influenced current vegetation distribution. Hence, a useful tool to explore the alternative climax communities that could appear in a given region are stochastic succession models [16], such as Markov Chain models.
A Markov Chain model consists of a set of ecological states and a set of transitions between these states. Each transition has an associated probability of occurrence. The transition probabilities are summarized in what is called a transition matrix [17] (Figure 1). Therefore, in a first-order Markov Chain model, the ecological state of an ecosystem depends only on the previous state.
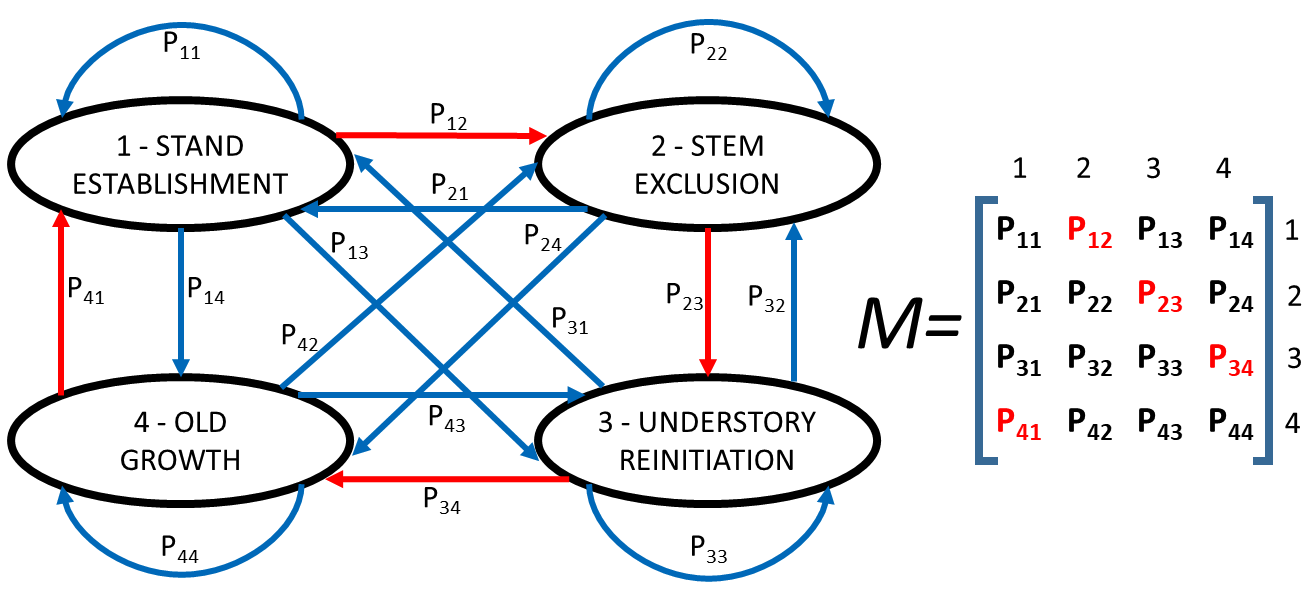
Figure 1. Diagram of a hypothetical Markov Chain model simulating forest stand dynamics. Black ovals represent four phases in stand dynamic in which the forest can be at a given moment. Blue and red arrows show the possible transitions between states. The probability of each transition is denoted as Pij, being i the present stage and j the future stage. All the probabilities together create M (the transition matrix). In a deterministic (Clementisan) model, all the probabilities in red (corresponding to transitions marked by red arrows) have a value of one, and the rest a value of zero.
The transitions between ecological states define the distribution of the states in the next time interval or computational iteration. Compared to other process-based approaches to model forest succession at landscape level (e.g., FATES [18], FORMIND [19], LANDIS-II [19], Forest Vegetation Simulator [20]), Markov Chain models stand out for their simplicity, as there are no ecophysiological parameters that need to be estimated, only probabilities for transitioning between ecological states. Hence, Markovian models do not involve an explicit recognition of the mechanisms or the determinants of the ecological transitions. They are purely based on estimates of the probabilities that any given state will transform into different ecological states over the next iteration of the model (Figure 1). They are, therefore, empirically based models [21][22]. In addition, Markov Chain models can be formally studied with probability theory, as they simulate environmental changes that are inherently a sequence of conditional probabilities.
However, Markov Chain models are not adequate for simulating systems in which there are a multitude of different states (such as complex landscapes), as the transition matrix quickly becomes too complex. Similarly, if the time interval is too short, Markov Chain models are not appropriate because the transitions in short time spans cannot always be considered random, but rather deterministically related in time [23]. Therefore, Markov Chain models are ideal to simulate changes in vegetation dynamics of systems that involve a low number of possible ecological states over long periods.
2. An Example of Use
Here we provide an example of the use of a Markov Chain successional model for the Pacific Northwest conifer forests. In this region, forest management plans must be based on the ecological classification map of British Columbia[6]. On northern Vancouver Island, difficulties for regenerating stands after clearcutting have been routinely reported for decades by logging companies in mixed old growth forests of western red cedar (Thuja plicata Donn ex D. Don) and western hemlock (Tsuga heterophylla (Raf.) Sarge), usually abbreviated as CH in Canadian forestry literature (from cedar-hemlock). However, such issues have not been reported in nearby sites with western hemlock mixed with Pacific silver fir (Abies amabilis Douglas ex J. Forbes) sites, usually abbreviated as HA (from Hemlock-Amabilis fir) [24][25].
The relationships between these stand types have been studied for over 40 years [26], usually from the perspective of converting CH sites into HA stands by means of forest management. The assumption was that CH and HA sites are found in similar sites due to successional processes. This assumption was originally supported by observations of the landscape mosaic created by the distribution of these sites on mesic and mesotrophic sites, which shows sharp boundaries between stand types [24].
Over time, several explanations have been offered for the coexistence of these forest types. Lewis' [26] original hypothesis followed a traditional Clementsian model in which HA sites evolve into CH in absence of disturbance. After Lewis’ hypothesis was formulated, differences in humus forms between stand types due to poor drainage were described [27]. Then, differences between sites in terms of nutrient availability were reported [28] , and later on, differences among sites in soil oxygen availability were detected [29][30]. However, there has been no conclusive evidence of differences among stand types due to parent material, soil chemistry or topography [31][32][33]. Nevertheless, further studies provided evidence that multiple stable forest types (stand replacing) could develop in the same site, depending on the combination of disturbance intensity, timing and stand composition [16][25].
All these evidences point to the fact that dominant tree species influence site properties, rather than the opposite. Based on this, an alternative multiple pathway succession model was suggested [25]. Our initial hypothesis is that a multiple pathway succession model for these forests is a better representation of natural successional processes than a deterministic Clementsian model. To test this hypothesis, a Markov Chain model was developed to describe the main states of the CH-HA system and their relative distribution in the landscape. The objective of this work was to clarify the key processes involved in the HA to CH transition as described in previous research [16][25][32][33], and to explore the sensitivity of the conceptual model presented by [25] to assumptions about transition probabilities. First, the model is described and values for the transition probabilities are proposed. Then, the model is used to examine several sets of probabilities to infer the combination that might better mimic the regional stand type distribution observed before logging started. The current distribution is the result of natural disturbances and succession processes taking place over the past 3000 years.
In the Clementsian deterministic succession model (as formulated by Lewis [26]), young HA stands composed of hemlock and fir reach the stem exclusion phase (sensu [34]). Then, the gaps formed by wind allow the establishment of red cedar seedlings, creating the hemlock-amabilis fir (cedar) stand type, or HA(C). As trees age, the old growth phase of original HA stands becomes a mixture of cedar-hemlock (CH) and Hemlock-Amabilis fir (HA). As old trees are infected by dwarf mistletoe (Arceuthobium spp. M. Bieb), their susceptibility to wind increases and eventually a self-maintaining CH stand develops in the absence of intense stand-replacing windstorms (Figure 2).
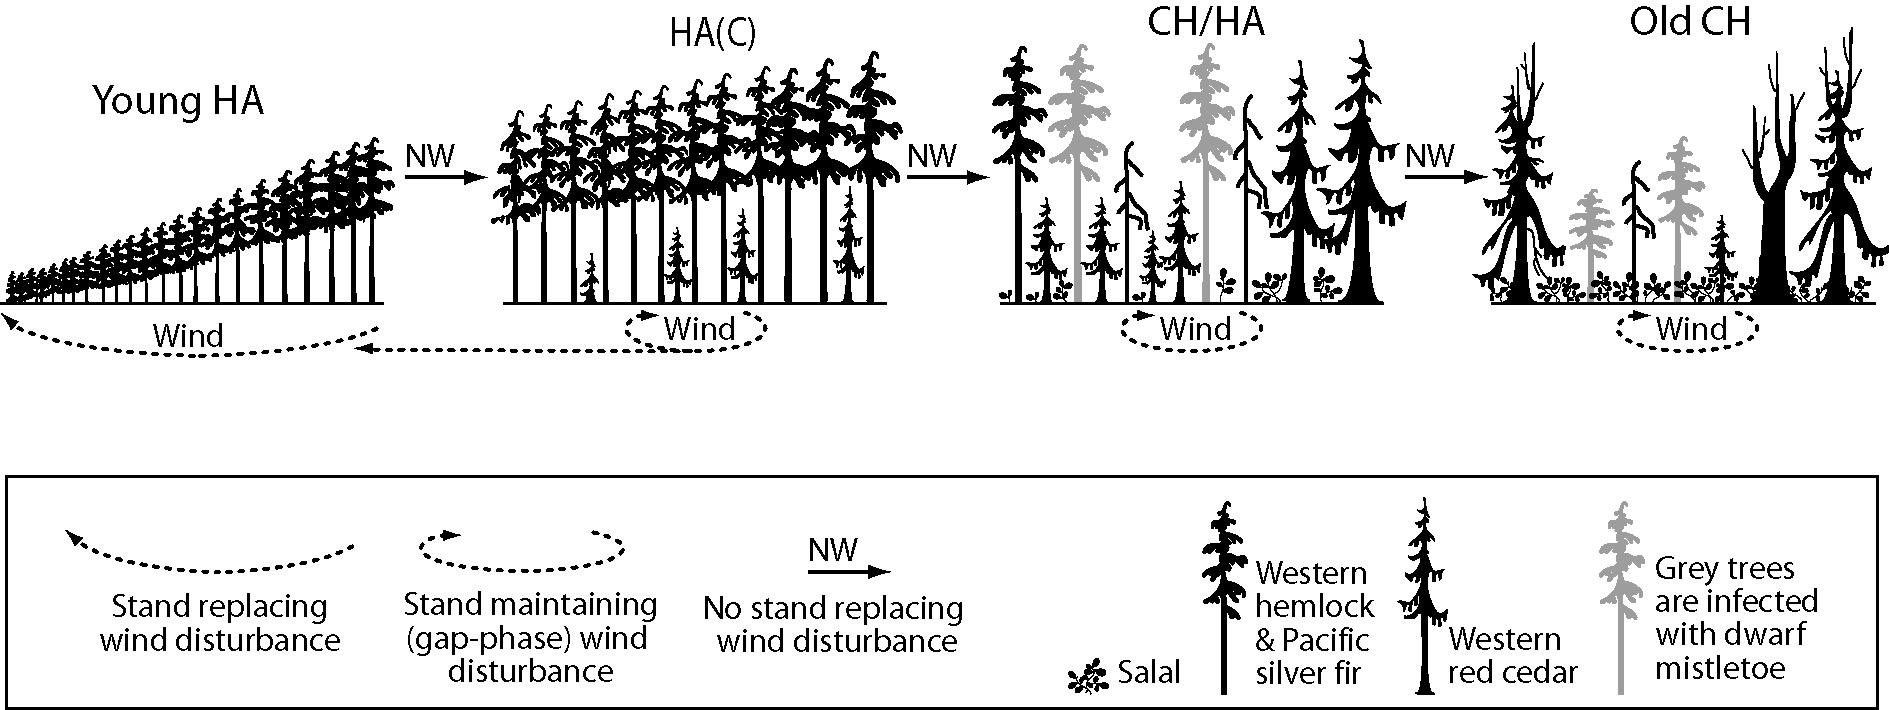
Figure 2. Forest succession on northern Vancouver Island forests, in which frequency and intensity of wind disturbance rules the deterministic (Clementsian) model (Elaborated upon data from [25]). Adapted with permission from Ref [25]. © 2014, the Authors.
In the proposed stochastic multiple pathway model [25], succession is also determined by wind frequency and intensity, but also by the presence of western red cedar seedlings above a certain threshold in HA stands, and with an important presence of salal and dwarf mistletoe (Figure 3). When a given site starts as a young HA forest, if there is no red cedar recruitment (or seedlings do not survive), the stand can become first mature and then old growth HA in the continued absence of windstorms (Figure 3). However, if red cedar seedlings survive, but account for less than 15% of the stand basal area, the stand will become young and then mature HA(C) (Figure 3). On the other hand, if there are disturbances, the stand can develop towards a CH stand. However, if there is a strong regeneration of red cedar in the HA stand (more than 15% of the basal area composed by red cedar saplings), the stand may become a mature, and eventually old growth, CH stand. Windstorms could move old growth stands back into young CH stands (Figure 3), but once a site is a CH stand, it is unlikely to return to HA through natural disturbance, as western red cedar seedlings will establish vigorously under other trees [25].
This stochastic model is implemented here as a Markov Chain model, composed by a series of successional states corresponding to the different possible stand types. Ecosystem stages are defined based on the dominant species, the dominant stand age and the presence of red cedar regeneration. The transformation of one ecological stage to another one is called a transition, and each transition is defined by the probability that such transformation may happen. In Markov Chain models, these probabilities are required input parameters. We assume a first-order model (the future state only depends on the present) and an ergodic structure in which transition probabilities are constant through space and time [35].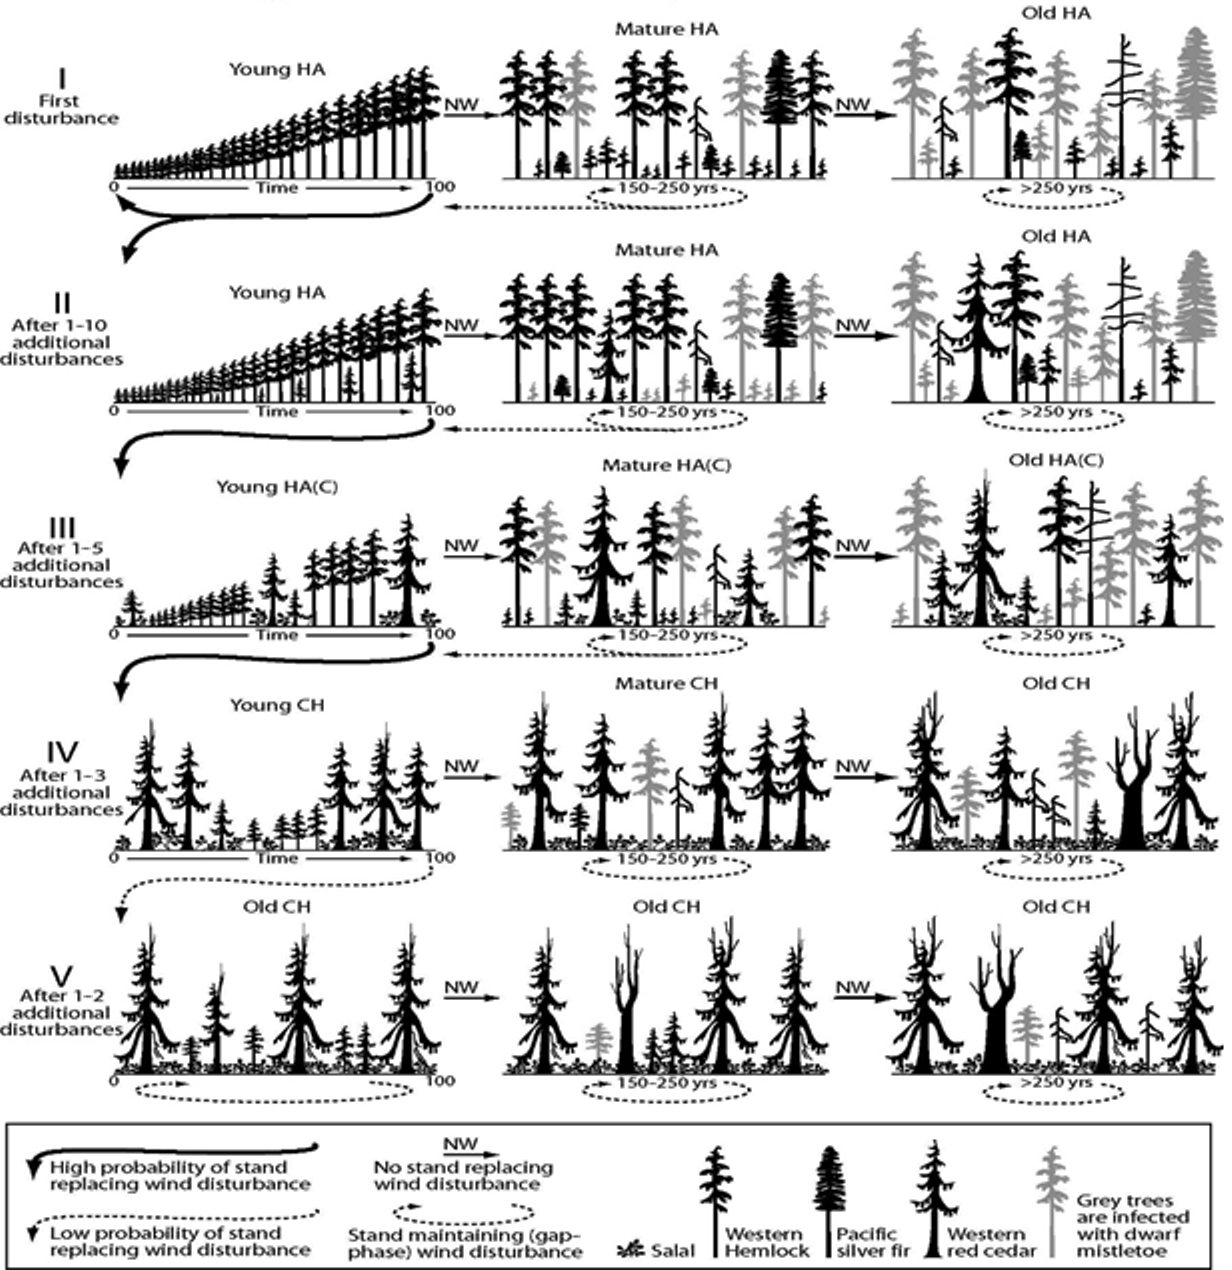
Figure 3. Alternative, multiple-pathway succession process proposed by [25] for zonal sites on northern Vancouver Island. Adapted with permission from Ref [35]. © 2004 Prentice Hall.
The model is constructed around three major successional pathways, as suggested by [25] (Figure 3). The model can also be considered as containing the Clementsian model, as the CHo (the climax stage in the Clementsian model; Figure 2), Running the model for 3000 years with a set of specific probability values provided the results shown in FIgure 4.
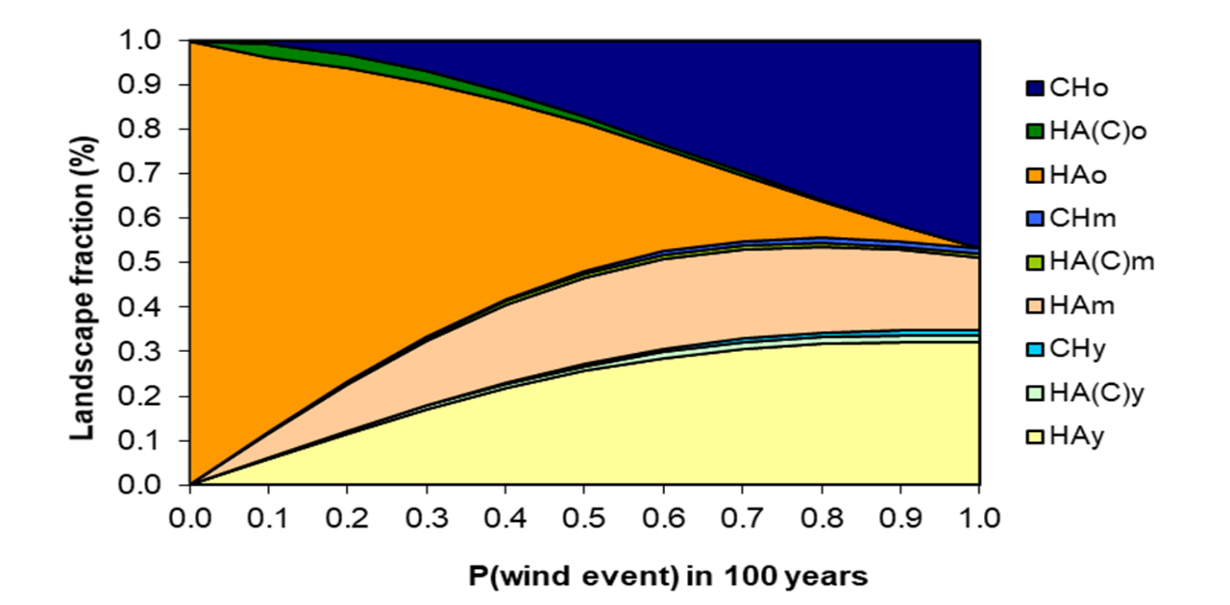
Figure 4. Model calibrated with the opinion of the expert panel, showing the fraction (%) occupied by different stand types after 3000 years (30 model iterations) for different probabilities (return periods) of wind storms. HA: Helmock-Amabilis fir stands- CH: Cedar-Hemlock stands; y: young stands; m: mature stands; o: old stands.
3. Plausibility of the Multiple Pathway Succession Model
One of the main advantages of Markov Chain models is their capacity to aggregate very complex information in few parameters (the probabilities in the transition matrix), which allows us to simulate the consequences of the transformations between different ecological states, even when the underlying ecological processes taking place in such transitions are not fully understood [15]. An acceptable successional theory for this area must explain how red cedar has been able to colonize nearly half the zonal portions of the landscape, given the relative shade intolerance of red cedar germinants and the lack of evidence that HA stands are actually being actively colonized by red cedar.
If the Markov Chain model presented here is valid, there should be a progressive increase in the area of mature and old CH. This is in fact suggested by the pollen and genetic records from the region [34][36]. Due to this temporal variation in stand type ratios over the last millennia, there is no way of validating this model outside of a detailed history of past stand and landscape disturbances, which unfortunately is not available. In addition, due to the permanent stochasticity of ecological processes, there is no “correct” landscape ratio to be compared with the model´s predictions, as the real landscape have always been fluctuating [37]. Therefore, one way to evaluate forest successional models such as this one is by projecting long periods of forest change and then comparing the proportion of each ecological stage estimated by the model with those of the distribution observed in the field [38], an approach used since the early development of successional Markovian models [39].
At this region, the mean size of forest patches was found to be 10.8 ha, with 81% of these sites being young HA stands (<100 years) of windthrow origin and 19% classified as HA old forest [10]. While HA stands occupy about 50% of northern Vancouver Island (~175,000 hectares), only 2000 to 3000 hectares are simultaneously at any given time in some type of intermediate state between HA and CH (i.e., HA(C)). This is only 1%–2% of the current HA stands extension [26]. Hebda presented an estimation of forest development on northern Vancouver Island following de-glaciation based on pollen analysis from sites on Vancouver Island. The analysis indicated that conifers of the Cupressaceae family have been widespread on northern Vancouver Island only recently, a fact also confirmed by genetic markers [37]. Thus, red cedar has only been dominant on northeastern Vancouver Island for approximately 3000 years, while hemlock has been a feature of this landscape for approximately 9000 years [34]. If CH stands have been spreading uniformly across the landscape for the most recent 3000-year period, then the rate of spread would amount to about 1000 hectares per century across the area that was not converted back to HA stands.
It is recognized that Markov Chain successional models are able to predict changes in species abundance, but they require a deep knowledge of successional patterns and the probabilities for transitioning between different ecological stages [17]. In particular, a potential limitation to a mechanistic interpretation of the ecological transitions arises from the assumption that in first-order Markov models (such as the one presented here) the transition towards the future stage depends only on the present stage. As the importance of ecological legacies could be high in some situations [40], this assumption needs further tests [17]. However, our Markov Chain model also complies with the ergodic property of this type of model, in which the succession will ultimately converge towards an inherent final stage [14], somehow emulating the climax community in Clementsian succession. In the suggested model such ergodic maximum is also the CHo stand type, but the key difference is the existence of random mechanisms (i.e., stand-replacing windstorms), which ensures that at any given time, only a fraction of the landscape is composed by CHo stands, as observed in the region.
4. Conclusions
Our forest succession model for this area suggests that infrequent disturbances relative to the duration of the current bioclimatic era are responsible for maintaining a non-equilibrium distribution of stands across the landscape. With long-lived species like red cedar and changes in global climate, successional theories incorporating species composition relative to climate change may become more important. Our lack of understanding of the processes that lead to current species distributions is problematic. The possibly unique interactions between disturbances and species’ autoecology for a given area suggest that understanding of successional trends needs to be area specific. Northeastern Vancouver Island’s bioclimatic eras since the last glaciation have ranged in duration from 1800 to 4000 years (mean = 2800 years), with the current bioclimatic era beginning 3000 ybp , coinciding with the onset of CH expansion. The Markov Chain model presented here can predict the theoretical course of succession, the ratio between its final stages, and the mean time it would take to reach the final stage(s) under the hypothesis of invariance. It thus gives geobotanic knowledge in a quantitative form, capable of being used for prediction [41]. The transition matrix model developed in this study demonstrates that a Clementsian, linear succession model cannot explain the trends in species establishment currently seen on the landscape. In addition, our model suggests that the transition from HA to CH can only occur when there is stand replacing disturbance. Our model is consistent with the observed site differences and multiple pathways of succession reported for these sites, and indicates that forest management should account for the co-existence of several potential “climax” communities in the same site. The full material and methods in which this communication are based can be consulted in Blanco et al. [42].
References
- Spies, T.A.; Hessburg, P.F.; Skinner, C.N.; Puettmann, K.J.; Reilly Matthew, J.; Davis, R.J.; Kertis, J.A.; Long, J.W.; Shaw, D.C. Chapter 3: Old growth, disturbance, forest succession, and management in the area of the Northwest Forest Plan. In Synthe-sis of Science to Inform Land Management within the Northwest Forest Plan Area; General Technical Report PNW-GTR-966; Spies, T.A., Stine, P.A., Gravenmier, R., Long, J.W., Reilly, M.J., Eds.; U.S. Department of Agriculture, Forest Service, Pacific Northwest Research Station: Portland, OR, USA, 2018; pp. 95–243.
- Pandolfi, J.M. Succession. In Encyclopedia of Ecology; Jorgensen, S.E., Fath, B., Eds.; Academic Press: Oxford, UK, 2008; pp. 3416–3424.
- Finegan, B. Forest succession. Nature 1984, 312, 109–114.
- Hall, F.G.; Botkin, D.B.; Strebel, D.E.; Woods, K.D.; Goetz, S.J. Large-scale patterns of forest succession as determined by re-mote sensing. Ecology 1991, 72, 628–640.
- Prach, K.; Ujházy, K.; Knopp, V.; Fanta, J. Two centuries of forest succession, and 30 years of vegetation changes in perma-nent plots in an inland sand dune area, The Netherlands. PLoS ONE 2021, 16, e0250003.
- Campbell, E.M.; Saunders, S.C.; Coates, K.D.; Meidinger, D.V.; MacKinnon, A.; O’Neill, G.A.; MacKillop, D.J.; DeLong, S.C.; Morgan, D.G. Ecological Resilience and Complexity: A Theoretical Framework for Understanding and Managing British Columbia’s Forest Ecosystems in a Changing Climate; Forest Science Program Technical Report 055; BC Ministry of Forests and Range: Vic-toria, BC, Canada, 2009.
- Connell, J.H.; Slatyer, R.O. Mechanisms of Succession in Natural Communities and Their Role in Community Stability and Organization. Am. Nat. 1977, 111, 1119–1144. https://doi.org/10.1086/283241.
- Fresco, L.O.; Kroonenberg, S.B. Time and spatial scales in ecological sustainability. Land Use Policy 1992, 9, 155–168. https://doi.org/10.1016/0264-8377(92)90040-4.
- Turner, M.G.; Romme, W.H.; Gardner, R.H.; O’Neill, R.V.; Kratz, T.K. A revised concept of landscape equilibrium: Disturb-ance and stability on scaled landscapes. Landsc. Ecol. 1993, 8, 213–227. https://doi.org/10.1007/bf00125352.
- Perera, A.H.; Buse, L.J. Emulating Natural Disturbance in Forest Management: An Overview. In Emulating Natural Forest Landscape Disturbances: Concepts and Applications; Perera, A.H., Buse, L.J., Webe, M.G., Eds.; Columbia University Press: New York, NY, USA, 2004; pp. 1–7.
- Keane, R.E.; Hessburg, P.F.; Landres, P.B.; Swanson, F.J. The use of historical range and variability (HRV) in landscape management. For. Ecol. Manag. 2009, 258, 1025–1037. https://doi.org/10.1016/j.foreco.2009.05.035.
- Blanco, J.A.; González de Andrés, E.; San Emeterio, L.; Lo, Y.H. Modelling mixed forest stands: Methodological challenges and approaches. In Advanced Modelling Techniques Studying Global Changes in Environmental Sciences; Park, Y.S., Lek, S., Baehr, C., Jorgensen, S.E., Eds.; Elsevier: Amsterdam, The Netherlands, 2015; pp. 186–223. ISBN 978-0-444-63-536-5.
- Van Hulst, R. On the dynamics of vegetation: Markov chains as models of succession. Veg. 1979, 40, 3–14. https://doi.org/10.1007/bf00052009.
- Usher, M.B. Modelling ecological succession, with particular reference to Markovian models. Veg. 1981, 46, 11–18. https://doi.org/10.1007/bf00118380.
- Baltzer, H. Markov Chain models for vegetation dynamics. Ecol. Model. 2000, 126, 139–154.
- Weber, A.; Leckie, S.; Kimmins, J.P.; Gilbert, B.; Blanco, J.A.; Lo, Y.H. Survival and growth as measures of shade tolerance of planted western redcedar, western hemlock and amabilis fir seedlings in hemlock-fir forests of northern Vancouver Island. For. Ecol. Manag. 2017, 386, 13–21.
- Liénard, J.; Florescu, I.; Strigul, N. An appraisal of the classic forest succession paradigm with the Shade Tolerance Index. PLoS ONE 2015, 10, e01117138.
- Koven, C.D.; Knox, R.G.; Fisher, R.A.; Chambers, J.Q.; Christoffersen, B.O.; Davies, S.J.; Detto, M.; Dietze, M.C.; Faybishen-ko, B.; Holm, J.; et al. Benchmarking and parameter sensitivity of physiological and vegetation dynamics using the Function-ally Assembled Terrestrial Ecosystem Simulator (FATES) at Barro Colorado Island, Panama. Biogeosciences 2020, 17, 3017–3044. https://doi.org/10.5194/bg-17-3017-2020.
- Rödig, E.; Cuntz, M.; Heinke, J.; Rammig, A.; Huth, A. Spatial heterogeneity of biomass and forest structure of the Amazon rain forest: Linking remote sensing, forest modelling and field inventory. Glob. Ecol. Biogeogr. 2017, 26, 1292–1302. https://doi.org/10.1111/geb.12639.
- Dixon, G.E. Essential FVS: A User’s Guide to the Forest Vegetation Simulator; Internal Rep.; U. S. Department of Agriculture, Forest Service, Forest Management Service Center: Fort Collins, CO, USA, 2002; 226p.
- Blanco, J.A.; Ameztegui, A.; Rodríguez, F. Modelling Forest Ecosystems: A crossroad between scales, techniques and applica-tions. Ecol. Model. 2020, 425, 109030.
- Kimmins, J.P.; Blanco, J.A.; Seely, B.; Welham, C.; Scoullar, K. Forecasting Forest Futures: A Hybrid Modelling Approach to the Assessment of Sustainability of Forest Ecosystems and Their Values; Earthscan Ltd.: London, UK, 2010; 281p. ISBN 978-1-84407-922-3.
- Delsole, T. A Fundamental Limitation of Markov Models. J. Atmos. Sci. 2000, 57, 2158–2168. https://doi.org/10.1175/1520-0469(2000)0572.0.co;2.
- Prescott, C.E.; Weetman, G. Salal Cedar Hemlock Integrated Research Program: A Synthesis; Faculty of Forestry, University of British Columbia: Vancouver, BC, Canada, 1994; 85p.
- Weber, A.; Kimmins, J.H.; Gilbert, B.; Lo, Y.-H.; Blanco, J.A. Multiple-pathway succession in coastal Tsuga heterophylla, Thuja plicata, and Abies amabilis forests on northeastern Vancouver Island, British Columbia. Can. J. For. Res. 2014, 44, 1145–1155. https://doi.org/10.1139/cjfr-2014-0060.
- Lewis, T. Ecosystems of the Port McNeill Block (Block 4) of Tree Farm License 25; Western Forest Products: Vancouver, BC, Can-ada, 1982.
- DeMontigny, L.E. An Investigation into the Factors Contributing to the Growth Check of Conifer Regeneration on Northern Vancouver Island. Ph.D. Thesis, The University of British Columbia, Vancouver, BC, Canada, 1992.
- Prescott, C.E.; Sajedi, T. The role of salal in forest regeneration problems in coastal British Columbia: Problem or symptom? For. Chron. 2008, 84, 29–36. https://doi.org/10.5558/tfc84029-1.
- Sajedi, T.; Prescott, C.E.; Seely, B.; Lavkulich, L.M. Relationships among soil moisture, aeration and plant communities in natural and harvested coniferous forests in coastal British Columbia, Canada. J. Ecol. 2012, 100, 605–618. https://doi.org/10.1111/j.1365-2745.2011.01942.x.
- Prescott, C.E.; Nery, V.; Van Niejenhuis, A.; Sajedi, T.; Marshall, P. Nutrition management of cedar and hemlock plantations in coastal British Columbia. New For. 2013, 44, 769–784. https://doi.org/10.1007/s11056-013-9380-x.
- Keenan, R.J.; Prescott, C.E.; Kimmins, J.H. Mass and nutrient content of woody debris and forest floor in western red cedar and western hemlock forests on northern Vancouver Island. Can. J. For. Res. 1993, 23, 1052–1059. https://doi.org/10.1139/x93-134.
- Weber, A.; Gilbert, B.; Kimmins, J.P.; Prescott, C.E. Factors limiting the early survivorship of Thuja plicata on northern Van-couver Island, British Columbia. Can. J. For. Res. 2003, 33, 854–861.
- Weber, A.; Karst, J.; Gilbert, B.; Kimmins, J.P. Thuja plicata exclusion in ectomycorrhiza-dominated forests: Testing the role of inoculum potential of arbuscular mycorrhizal fungi. Oecologia 2004, 143, 148–156. https://doi.org/10.1007/s00442-004-1777-y.
- Oliver, C.; Larson, B. Forest Stand Dynamics; Wiley: New York, NY, USA, 1996; p. 544.
- Weber, A.; Kimmins, J.H.; Gilbert, B.; Lo, Y.-H.; Blanco, J.A. Multiple-pathway succession in coastal Tsuga heterophylla, Thuja plicata, and Abies amabilis forests on northeastern Vancouver Island, British Columbia. Can. J. For. Res. 2014, 44, 1145–1155.
- Kimmins, J.P. Forest Ecology, 3rd edition. Prentice Hall, Upper Saddle River, NJ, USA. 2004; p. 611.
- O’Connell, L.M.; Ritland, K.; Thompson, S.L. Patterns of post-glacial colonization by western redcedar (Thuja plicata, Cu-pressaceae) as revealed by microsatellite markers. Bot. 2008, 86, 194–203. https://doi.org/10.1139/b07-124.
- Donato, D.C.; Halofsky, J.S.; Reilly, M.J. Corralling a black swan: Natural range of variation in a forest landscape driven by rare, extreme events. Ecol. Appl. 2020, 30, e02013. https://doi.org/10.1002/eap.2013.
- Shugart, H.H.; West, D.C. Development of an Appalachian Deciduous Forest Succession Model and its Application to As-sessment of the Impact of the Chestnut Blight. J. Environ. Manag. 1977, 5, 161–179.
- Hebda, R.J. Late-glacial and postglacial vegetation history at Bear Cove Bog, northeast Vancouver Island, British Columbia. Can. J. Bot. 1983, 61, 3172–3192.
- Blanco, J.A. Forests may need centuries to recover their original productivity after continuous intensive management: An example from Douglas-fir. Sci. Total. Environ. 2012, 437, 91–103.
- Blanco, J.A.; Welham, C.; Kimmins, J.P.; Seely, B.; Mailly, D. Guidelines for modeling natural regeneration in boreal forests. For. Chron. 2009, 85, 427–439.
- Juan A. Blanco; Yueh-Hsin Lo; James P. Kimmins; Adrian Weber; Highlighting Complex Long-Term Succession Pathways in Mixed Forests of the Pacific Northwest: A Markov Chain Modelling Approach. Forests 2021, 12, 1770, 10.3390/f12121770.


