 +1 credit
Video Upload Options
As the hybrid offspring of yak (♀) and cattle (Bos taurus) (♂), female cattleyak has obvious heterosis than yak, especially its lactation performance. Dairy products making from fermented and processed milk are popular with local herdsmen and tourists. As the main energy substance in milk, milk fat only accounts for 3 ~ 5% of the milk content, but determines the nutritional value of milk. Therefore, it is greatly meaningful to increase the percentage of milk fat and improve the composition of fatty acids of cattleyak. SNPs can help us finding potential molecular markers for milk fat traits of cattleyak, and can be screened according to molecular markers when they are young. It provides a reference for cultivating high milk fat cattle population in the future. The results of this study suggested that the SORBS1 gene polymorphism was closely related to the milk fat traits of cattleyak, which could be used as a candidate genetic marker for milk fat traits selection in cattleyak. This study provides a new molecular marker and theoretical basis for screening the milk fat traits of cattleyak. It has a certain reference value for the research and improvement of milk quality.
1. PCR amplification and SNPs screening
The concentration and purity of genomic DNA in cattleyak blood were detected by nucleic acid concentration detector, and the samples were all qualified. Using 2% agarose gel electrophoresis to detect four amplified products, clear and single-purpose bands were obtained. The specificity is good and can be used for subsequent sequencing analysis. A total of 9 SNPs in the CDS and their adjacent regions of SORBS1 gene were detected in cattleyak population by PCR and sequencing (Figure 2). g.6256 C>T (c.298 C>T) and g.24791 G>A (c.706 A>G) were detected by primer 1 and primer 4 PCR product, g.29029 C>T, g.29050 A>G, g.29121 A>G (c.979 A>G), g.29245 T>C, g.29305 T>C and g.29347 T>C were detected by primer 5 PCR product, g.96284 G>A (c.3090 G>A) was detected by primer 10 PCR product. Additionally, 4 SNPs (g.6256 C>T, g.24791 G>A, g.29121 A>G and g.96284 G>A) are located in the CDS region, while the other 5 SNPs are located in the intron region adjacent of SORBS1 gene.
2. SNPs genotyping of SORBS1 gene
The genotype frequency, allele frequency and polymorphic information content of 9 SNPs loci were shown in Table 2. The results showed that all the 9 SNPs loci had three genotypes in cattleyak population. The PIC of g.6256 C>T, g.24791 G>A, g.29029 C>T and g.29050 A>G were 0.361, g.29121 A>G was 0.346, g.29245 T>C, g.29305 T>C, g.29347 T>C and g.96284 G>A were 0.358. The PIC of all SNPs was between 0.25~0.5, and all of them were moderately polymorphic. All the other SNPs conformed to Hardy-Weinberg balance except g.29121 A>G site (P > 0.05).
3. Haplotype and diplotype analysis of each amino acid mutation site of SORBS1
Comparison of the amino acid residue sequence alignment of SORBS1 gene before and after mutation, we found that 3 SNPs (g.6256 C>T, g.24791 A>G, g.29121 A>G) caused amino acid changes among the 4 SNPs located in the CDS region. And no amino acid changes were observed at g.96284 G>A. The 3 mutations were Ser100Pro, Arg229His and Ala327Thr (Table 2). Using the 3 SNPs, a haplotype analysis was carried out using Haploview software (Table 3). Haplotype analysis showed that the 3 haplotypes were in fact found in the population of cattleyak, of which H1 (C-A-A) and H2 (T-G-G) were the major haplotypes, accounting for 61.9% and 33.3%, respectively. The frequency of H3 (T-G-A) was 4.9%. Based on these 3 haplotypes, we further obtained 4 combinations, in the form of H1-H1 (CCAAAA), H1-H2 (CTAGAG), H1-H3 (CTAGAA) and H2-H2 (TTGGGG) (Figure 3), of which H1-H1 (38.3%) and H2-H2 (37.4%) belonged to dominant diplotypes.
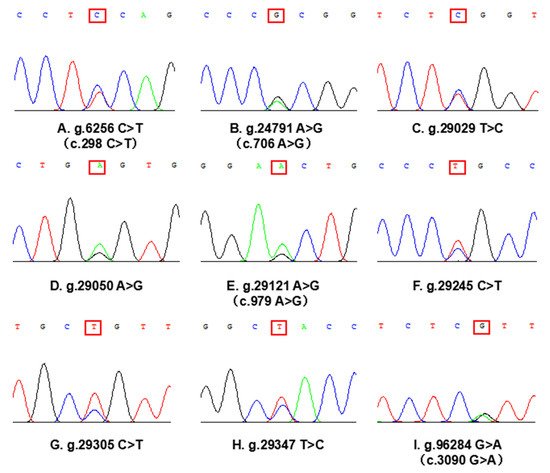
Figure 1. Sequencing diagram of heterozygous genotypes in SNPs loci of SORBS1 gene(red box marker). Four SNPs (A, B, E, I) are located in the CDS region of SORBS1 gene, c. system naming indicates the position of the site on the cDNA sequence. Five SNPs (C, D, F, G, H) are located in the intron region adjacent to the CDS region of SORBS1 gene.
Table 1. SNPs analysis of population genetic parameters of SORBS1
|
Loci |
Genomic Region |
Amino Acid |
Genotype |
Genotype Frequency (%) |
Allele |
Allele Frequency (%) |
Ho |
He |
Ne |
PIC |
P Value |
|
g.6256 C>T |
Exon 3 |
Ser100Pro |
CC |
38.3 |
C |
61.9 |
0.528 |
0.472 |
1.894 |
0.361 |
0.054 |
|
|
|
|
CT |
47.1 |
T |
38.1 |
|
|
|
|
|
|
|
|
|
TT |
14.6 |
|
|
|
|
|
|
|
|
g.24791 A>G |
Exon 7 |
Arg229His |
AA |
38.3 |
A |
61.9 |
0.528 |
0.472 |
1.894 |
0.361 |
0.054 |
|
|
|
|
AG |
47.1 |
G |
38.1 |
|
|
|
|
|
|
|
|
|
GG |
14.6 |
|
|
|
|
|
|
|
|
g.29029 T>C |
Intron 7 |
- |
TT |
38.3 |
T |
61.9 |
0.528 |
0.472 |
1.894 |
0.361 |
0.054 |
|
|
|
|
TC |
47.1 |
C |
38.1 |
|
|
|
|
|
|
|
|
|
CC |
14.6 |
|
|
|
|
|
|
|
|
g.29050 A>G |
Intron 7 |
- |
AA |
38.3 |
A |
61.9 |
0.528 |
0.472 |
1.894 |
0.361 |
0.054 |
|
|
|
|
AG |
47.1 |
G |
38.1 |
|
|
|
|
|
|
|
|
|
GG |
14.6 |
|
|
|
|
|
|
|
|
g.29121 A>G |
Exon 8 |
Ala327Thr |
AA |
48.0 |
A |
66.7 |
0.556 |
0.444 |
1.799 |
0.346 |
0.017 |
|
|
|
|
AG |
37.4 |
G |
33.3 |
|
|
|
|
|
|
|
|
|
GG |
14.6 |
|
|
|
|
|
|
|
|
g.29245 C>T |
Intron 8 |
- |
CC |
40.6 |
C |
63.0 |
0.534 |
0.466 |
1.873 |
0.358 |
0.073 |
|
|
|
|
CT |
44.8 |
T |
37.0 |
|
|
|
|
|
|
|
|
|
TT |
14.6 |
|
|
|
|
|
|
|
|
g.29305 C>T |
Intron 8 |
- |
CC |
40.6 |
C |
63.0 |
0.534 |
0.466 |
1.873 |
0.358 |
0.073 |
|
|
|
|
CT |
44.8 |
T |
37.0 |
|
|
|
|
|
|
|
|
|
TT |
14.6 |
|
|
|
|
|
|
|
|
g.29347 T>C |
Intron 8 |
- |
TT |
40.6 |
T |
63.0 |
0.534 |
0.466 |
1.873 |
0.358 |
0.073 |
|
|
|
|
TC |
44.8 |
C |
37.0 |
|
|
|
|
|
|
|
|
|
CC |
14.6 |
|
|
|
|
|
|
|
|
g.96284 G>A |
Exon 28 |
Ser1030Ser |
GG |
39.7 |
G |
62.7 |
0.532 |
0.468 |
1.879 |
0.358 |
0.057 |
|
|
|
|
GA |
46.0 |
A |
37.3 |
|
|
|
|
|
|
|
|
|
AA |
14.3 |
|
|
|
|
|
|
|
Abbreviations: Ho = Homozygosity; He = Heterozygosity; Ne = Effective number of alleles; PIC = Polymorphic information content.
P>0.05 suggested that the population gene is in Hardy-Weinberg balance and the sample comes from the same mendel population.
Table 2. Haplotype and haplotype frequencies of the three mutations in the SORBS1 gene.
|
Haplotype |
Ploymorphism Sites of SORBS1 Gene |
Frequency(%) |
||
|
g.6256 C>T (c.298 C>T) |
g.24791 A>G (c.706 A>G) |
g.29121 A>G (c.979 A>G) |
||
|
H1 |
C |
A |
A |
61.8 |
|
H2 |
T |
G |
G |
33.3 |
|
H3 |
T |
G |
A |
4.9 |
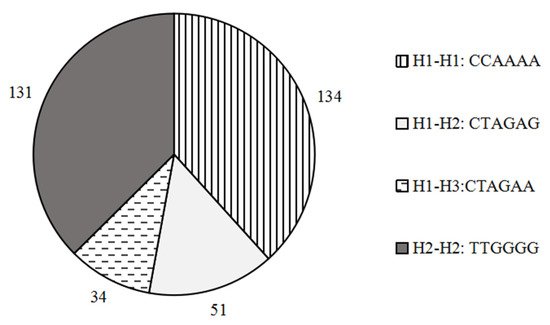
Figure 2. Diplotypes and frequencies of the three mutations in the SORBS1 gene.
4. Association analysis between SNPs genotypes and milk fat traits
Based on the data of SNPs genotyping, the correlation analysis of single locus with milk fat percentage and fatty acids of cattleyak was carried out. As shown in Table 4, in terms of milk fat percentage and fatty acids content, most of the homozygous (CC genotype at g.6256 C>T, AA genotype at g.24791 A>G, TT genotype at g.29029 T>C, AA genotype at g.29050 A>G, AA genotype at g.29121 A>G, CC genotype at g.29245 C>T, CC genotype at g.29305 C>T, TT genotype at g.29347 T>C and GA genotype at g.96284 G>A) were significantly higher than the other genotypes (P < 0.05). At locus g.96284 G>A, the milk fat percentage, monounsaturated fatty acid (MUFA), polyunsaturated fatty acid (PUFA) and saturated fatty acid (SFA) of GA genotype were significantly higher than that in GG and AA genotypes (P < 0.05).
5. Association analysis between genetype combinations and milk fat traits of cattleyak
The genotype combination of H2-H2 did not cause the change of amino acid. There is a possibility of amino acid variation in the part of cattleyak whose genotype combinations are H1-H2 and H1-H3 The base mutation in the combination of H1-H1 resulted in the mutation of all three amino acids. The results of the Analyze-ANOVA showed that H1-H1 had the highest milk fat percentage, MUFA, PUFA and SFA, while H2-H2 had the lowest milk fat percentage and fatty acid content (Table 5). The differences were statistically significant (P < 0.05).
Table 3. Association analysis between genotypes and milk fat of cattleyak
|
Loci |
Genotype |
Milk Fat Percentage (%) |
MUFA |
PUFA |
SFA |
|
g.6256 C>T |
CC |
5.649±0.499a |
1.605±0.212a |
0.180±0.018a |
3.771±0.388a |
|
|
CT |
4.783±0.732b |
1.305±0.177b |
0.162±0.023b |
3.268±0.479b |
|
|
TT |
3.280±0.677c |
1.033±0.231c |
0.130±0.011c |
1.834±0.529c |
|
g.24791 A>G |
AA |
5.649±0.499a |
1.605±0.212a |
0.180±0.018a |
3.771±0.388a |
|
|
AG |
4.783±0.732b |
1.305±0.177b |
0.162±0.023b |
3.268±0.479b |
|
|
GG |
3.280±0.677c |
1.033±0.231c |
0.130±0.011c |
1.834±0.529c |
|
g.29029 T>C |
TT |
5.649±0.499a |
1.605±0.212a |
0.180±0.018a |
3.771±0.388a |
|
|
TC |
4.783±0.732b |
1.305±0.177b |
0.162±0.023b |
3.268±0.479b |
|
|
CC |
3.280±0.677c |
1.033±0.231c |
0.130±0.011c |
1.834±0.529c |
|
g.29050 A>G |
AA |
5.649±0.499a |
1.605±0.212a |
0.180±0.018a |
3.771±0.388a |
|
|
AG |
4.783±0.732b |
1.305±0.177b |
0.162±0.023b |
3.268±0.479b |
|
|
GG |
3.280±0.677c |
1.033±0.231c |
0.130±0.011c |
1.834±0.529c |
|
g.29121 A>G |
AA |
5.516±0.621a |
1.568±0.225a |
0.178±0.021a |
3.662±0.516a |
|
|
AG |
4.729±0.715b |
1.274±0.152b |
0.160±0.020b |
3.278±0.401b |
|
|
GG |
3.280±0.677c |
1.033±0.231c |
0.130±0.011c |
1.834±0.529c |
|
g.29245 C>T |
CC |
5.611±0.588a |
1.587±0.231a |
0.178±0.021a |
3.746±0.465a |
|
|
CT |
4.773±0.696b |
1.305±0.167b |
0.163±0.022a |
3.625±0.428b |
|
|
TT |
3.280±0.677c |
1.033±0.231c |
0.130±0.011c |
1.834±0.529c |
|
g.29305 C>T |
CC |
5.611±0.588a |
1.587±0.231a |
0.178±0.021a |
3.746±0.465a |
|
|
CT |
4.773±0.696b |
1.305±0.167b |
0.163±0.022a |
3.625±0.428b |
|
|
TT |
3.280±0.677c |
1.033±0.231c |
0.130±0.011c |
1.834±0.529c |
|
g.29347 T>C |
TT |
5.611±0.588a |
1.587±0.231a |
0.178±0.021a |
3.746±0.465a |
|
|
TC |
4.773±0.696b |
1.305±0.167b |
0.163±0.022a |
3.625±0.428b |
|
|
CC |
3.280±0.677c |
1.033±0.231c |
0.130±0.011c |
1.834±0.529c |
|
g.96284 G>A |
GG |
4.335±0.772c |
1.297±0.377b |
0.152±0.029b |
2.829±0.679b |
|
|
GA |
5.334±0.612a |
1.483±0.167a |
0.174±0.021a |
3.565±0.467a |
|
|
AA |
5.040±0.283b |
1.278±0.088b |
0.168±0.011a |
3.417±0.024a |
Abbreviations: MUFA = Monounsaturated fatty acid; PUFA = Polyunsaturated fatty acids; SAFA = Saturated fatty acid.
a-c Values within a row with different superscripts differ significantly at P < 0.05.
Table 4. Association analysis of different genotype combinations of amino acid mutation sites with milk fat traits.
|
Diplotype |
Combinatorial Genotype |
Number of Amino Acid Mutations |
Milk Fat Percentage(%) |
MUFA |
PUFA |
SFA |
|
H1-H1 |
CCAAAA |
3 |
5.649±0.499a |
1.605±0.161a |
0.180±0.018a |
3.771±0.388a |
|
H1-H2 |
CTAGAG |
0-3 |
4.783±0.595b |
1.305±0.143c |
0.162±0.020c |
3.268±0.396b |
|
H1-H3 |
CTAGAA |
1-3 |
4.992±0.465b |
1.421±0.122b |
0.171±0.027b |
3.321±0.516b |
|
H2-H2 |
TTGGGG |
0 |
3.280±0.652c |
1.033±0.153d |
0.130±0.011d |
1.834±0.262c |
Abbreviations: MUFA = Monounsaturated fatty acid; PUFA = Polyunsaturated fatty acids; SAFA = Saturated fatty acid.
a-d Values within a row with different superscripts differ significantly at P < 0.05.

