2. The Political Scene in Poland
The single-party political system has marked its presence in all the countries of Central and Eastern Europe which, following the socio-economic transformation and the demise of the communist system from the late 1980s, attempted to establish or recreate a pluralist party system, in line with the idea that political parties represent vehicles of contemporary democracy
[16]. In Poland, the re-structuring of the political scene resulted from the Round Table Agreements (The Round Table Agreements: negotiations conducted between 6 February and 5 April 1989 by representatives of the government of the Polish People’s Republic, the democratic opposition and Church organisations (the Catholic Church and the Evangelical Church of the Augsburg Confession)), leading to the country’s constitution being amended in April 1989. For the first time for 40 years, the communist party (the Polish United Workers’ Party, PZPR) did not affect the opposition’s tickets (Solidarność, Solidarity), a breakthrough moment that paved the way for a pluralist party system
[17]. During the transformation, the Polish political scene emerged dynamically and was accompanied by new antagonisms. The original, idealist assumption of maintaining unity in the post-Solidarity milieu proved unrealistic. Once the common “enemy” in the form of the PZPR had been defeated, the post-Solidarity (rightist) factions started to compete, at the same time representing one of the major areas of the Polish political scene in the early 1990s. Across the divide, tentatively referred to as “post-communist”, the new leftist movement was in the making. Notably, during the four years following the 1989 elections, attempts at stabilising the political scene proved futile. The fragmentation of political parties and the changing of coalitions resulted in a liquid political scene and short-term governance
[18]. During these four years, governments ruled on average for about a year. The negative experiences of these years triggered a change to the electoral system, specifically the introduction of an electoral threshold of 5% for political parties and 8% for party coalitions. Exempt from the threshold were electoral committees of organisations of ethnic minorities. The new electoral system, based on the d’Hondt method preferring the biggest parties, limited the number of small parties in Parliament
[19]. This contributed to the introduction to the lower chamber of the Parliament a maximum of six parties (election committees)
[17]. The establishment of a more stable party system did not eliminate turbulence: throughout the transformation, political parties emerged and disappeared. The political scene in Poland has not assumed its stable shape to date.
2005 was a breakthrough year from the point of view of the development of the present-day political stage, as for the first time since the shift of the political and economic system, parliamentary and presidential elections were held in the same year
[20][21]. As a result, the strategies and tactics of political life differed from before, and therefore the election campaign was unique. This had an impact on the sphere of public discourse, the image of politics in the media and its social perception. Moreover, the election results were unusual, because for the first time in post-communist history the candidates and groups associated with the former system did not play a major role. The last time the new leftist party marked a significant political presence was in 2001, when the SLD-UP coalition (the Democratic Left Alliance and Labour Union) won in the parliamentary elections (
Table 1). This new, exceptional situation saw the 2005 elections described as critical elections. An important consequence of these changes was a fundamental shift in the structure of competition in the Polish political scene. The political and electoral axis of division into left and right, which had previously delineated political and electoral rivalry, was no longer important. Of greater significance was the older, less prominent yet still relevant division into “Solidary Poland” and “Liberal Poland”
[22][23][24]. Since that time, the Polish political scene has been clearly polarised, bringing the party system closer to the two-block/bipolar system
[24][25] in which two factions—“Solidary Poland” and “Liberal Poland”—fight for power. The groups forming the “new” opposition differ more clearly from each other in terms of their socio-demographic characteristics than the left and the right. The opposition of “Solidary Poland” vs “Liberal Poland” is closely linked to real interests and, above all (and of particular interest for this entry), to matters of socio-economic growth
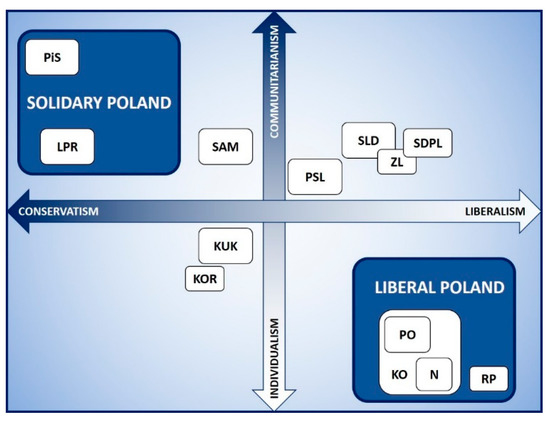
[20][24]. In a generalised perspective, given the values and ideologies professed, the Polish political scene can be divided along two axes: conservatism vs liberalism and individualism vs communitarianism (
Figure 1).
Figure 1. The principal division of the Polish political scene in 2005–2019 (source: own elaboration). Legend: PiS—Prawo i Sprawiedliwość; LPR—Liga Polskich Rodzin; SAM—Samoobrona; Kuk—Kukiz’15; Kor—KORWiN; PSL—Polskie Stronnictwo Ludowe; SLD—Sojusz Lewicy Demokratycznej; ZL—Zjednoczona Lewica (SLD, Zieloni, etc.); SDPL—Socjaldemokracja Polska; PO—Platforma Obywatelska; N—Nowoczesna; RP—Ruch Palikota; KO—Koalicja Obywatelska.
Table 1. Political parties’ results in elections to the Parliament of the Republic of Poland in 2001–2019 * (source: own elaboration on the basis of data from the National Electoral Commission).
| 2001 |
2005 |
2007 ** |
2011 |
2015 |
2019 |
| Party |
% of Votes |
Party |
% of Votes |
Party |
% of Votes |
Party |
% of Votes |
Party |
% of Votes |
Party |
% of Votes |
| SLD-UP |
41.04 |
PiS |
26.99 |
PO |
41.51 |
PO |
39.18 |
PiS |
37.58 |
PiS |
43.59 |
| PO |
12.68 |
PO |
24.14 |
PiS |
32.11 |
PiS |
29.89 |
PO |
24.09 |
KO |
27.40 |
| SRP |
10.20 |
Samoobrona |
11.41 |
SLD |
13.51 |
Ruch Palikota |
10.02 |
Kukiz’15 |
8.81 |
SLD |
12.56 |
| PiS |
9.50 |
SLD |
11.31 |
PSL |
8.91 |
PSL |
8.36 |
Nowoczesna |
7.60 |
PSL |
8.55 |
| PSL |
8.98 |
LPR |
7.97 |
|
|
SLD |
8.24 |
PSL |
5.13 |
KWiN |
6.81 |
| LPR |
7.87 |
PSL |
6.96 |
|
|
|
|
KORWiN |
4.76 |
|
|
| |
|
|
|
|
|
|
|
ZL |
7.55 |
|
|
Thus, the political parties that won seats in national parliamentary elections during the period of Poland’s integration with the EU (2005, 2007, 2011 2015 and 2019) can be further aggregated into two main political camps. The core of the first—the conservative and communitarian “Solidary Poland”—essentially consists of two parties, Law and Justice (Prawo i Sprawiedliwość, or PiS, 2005, 2007, 2011, 2015 and 2019) and the League of Polish Families (Liga Polskich Rodzin, or LPR, 2005). In the other camp, the liberal and individual “Liberal Poland” is represented by four political parties, Civic Platform (Platforma Obywatelska, PO, 2005, 2007, 2011 and 2015), Ruch Palikota (RP, 2011), Modern (Nowoczesna, N, 2015) and Koalicja Obywatelska (KO, mainly consisting of Platforma Obywatelska, PO, and Nowoczesna, N, 2019). The electoral programmes of these parties are strictly in line with the slogans of the political camp, whereas those of the other parties are more varied and only partially in line with the main slogans of one of the camps.
Dominant among the supporters of the “Solidary Poland” camp are the so-called losers of the transformation process, who find ideological options referring to social solidarity particularly attractive. They expect, among other aspects, state aid, equal opportunities and an extensive social policy
[20]. Supporters of this camp also call for greater state control over local self-government, which may contribute to the centralisation of power. The voters of “Solidary Poland” are primarily inhabitants of rural areas, showing relatively greater conservatism and conformism
[22][26]. By contrast, “Liberal Poland” is composed of winners who have “made it” in the wake of the transformation process. They are in favour of broad liberalism, which emphasises individual freedom. To pursue their interests, the winners of the transformation expect as few restrictions as possible from state institutions
[20]. They advocate economic freedom based on the free market and private property and support the devolution of power and the development of self-government
[27]. Voters supporting the “Liberal Poland” camp are much more often residents of larger cities, who are more open to change and more concerned about their own interests than their more rural counterparts
[22][26].
3. Geographical Patterns of Electoral Behaviour in Poland
As has already been emphasised, during the system transformation the new leftist movement played a significant role in the Polish political scene until 2001. On the other hand, in the years to come, the new leftist movement (Sojusz Lewicy Demokratycznej, SLD consistently made its way to the lower chamber of the Parliament (except for in 2015), although since 2005, it was not capable of creating a governmental coalition, support for this faction oscillating between 8% and 13% (Table 1). In any analysis of the emerging balance of power in the Polish Parliament in the years 2005–2019, one should first of all point to the dominance of two opposition political camps and their constituent parties. In 2005, voters cast almost 60% of the votes for the “Solidary Poland” camp, represented by PiS and LPR, and the “Liberal Poland” camp, associated with PO (Table 1). In the subsequent parliamentary elections, the positions of these camps on the Polish political scene were clearly strengthened. In 2015, the two camps, respectively represented by PiS and PO together with N, enjoyed a total support level of 70%. It should be noted that in 2007 and 2011, this increase mainly owed to an increase in support for only one party in the “Liberal Poland” camp: PO (from 24.14% to approximately 40%). The situation in the parliamentary elections in 2015 was different, as PO recorded a significant decline whereas PiS’ share increased to over 37%. In the period under analysis, the remaining groups were much less significant in shaping the Polish political scene, support for them usually not exceeding 10%.
The results of the parliamentary elections (
Table 1) justify the statement that the Polish political scene is subject to polarisation, bringing the party system closer to a bipolar system
[24][25] in which the power struggle takes place between “Solidary Poland” and “Liberal Poland” camps. For this reason, geographical patterns of electoral behaviour can be identified on the basis of support for these two dominant political options. The choice between them essentially reflects the social mood in Poland and the directions of developmental changes desired by citizens. PiS, which is the core of “Solidary Poland”, can be classified as a radical, populist right-wing party. It supports traditional values, a solidary policy and close relations between Church and State
[28][29]. By contrast, the main “Liberal Poland” party, PO, has a more lax economic programme, which aims to limit the regulatory role of the state and decentralise power. At the same time, PO is in favour of separating Church from State as well as openness and religious and sexual tolerance
[30].
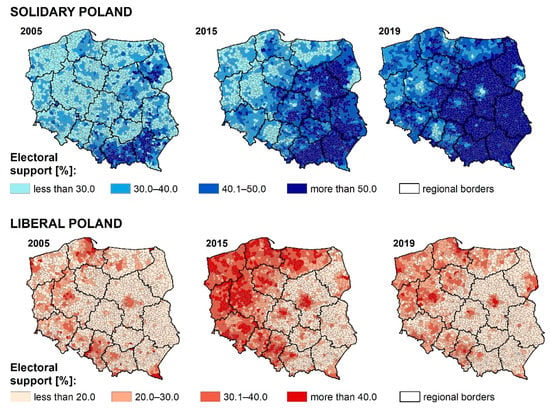
This analysis of the spatial differentiation of the two main political camps’ election results (i.e., “Solidary Poland” and “Liberal Poland”) in local units is based on the level of electoral support recorded in the parliamentary elections of 2005, 2015 and 2019 (Table 1, Figure 2). The spatial distribution of support for the two opposition camps in the 2005 and 2015 parliamentary elections reveals significant changes in the growing polarisation of political views in Poland. In 2005, the highest concentration of support for the “Solidary Poland” camp could be observed in the south-eastern part of the country and ranged from over 70% in selected communes of Podkarpackie Voivodeship to just 3–5% in some communes of Podlaskie Voivodeship, home to a Belarusian minority, Orthodox Christians and Muslim descendants of Polish Tatars. On the other hand, the highest support (50–60%) for the “Liberal Poland” camp could be found in north-western Poland as well as in highly urbanised areas of south and eastern Poland, including the Warsaw and Krakow agglomerations. It should be stressed, however, that the distribution of communes with an above-average level of support for both political formations was to a large extent spot-centred (Figure 2), indicating a relatively small degree of differentiation among Poles in terms of their political views.
Figure 2. Support for the political camps in parliamentary elections in 2005–2019 (source: own elaboration on the basis of data from the National Electoral Committee).
Nevertheless, this situation would change significantly over the next ten years. In 2015, political views unequivocally divided Poland into two parts and the distribution of support was territory-centred. Voters of the “Liberal Poland” camp were concentrated in north-western Poland (e.g., the Poznań agglomeration), with a level of support of 50–60%, whereas voters of the “Solidary Poland” camp dominated in central-eastern Poland (e.g., selected communes of the Podlaskie, Podkarpackie and Małopolskie voivodeships), with more than 70% of support (
Figure 2). Furthermore, in 2005 and 2015 an additional distinct concentration of support for the “Liberal Poland” camp occurred in the Bieszczady Mountains in Podkarpackie Voivodeship, where there is a high percentage of migrants from various regions of Poland, a consequence on the one hand of the “Vistula” operation (The “Vistula” operation was a forced pacification action of a military character carried out in the years 1947–1950 by the state structures of the Polish People’s Republic against the Ukrainian Insurgent Army (UPA) and the Organisation of Ukrainian Nationalists operating in the territory of Poland, in order to cut off the fighting units from their natural base. The operation consisted of the mass displacement of the civilian population from south-eastern Poland (mainly from Bieszczady) to western territories. From the 1960s, these areas started to be repopulated (e.g., via financial incentives for migration), with people coming from various regions of Poland, including large cities
[31][32][33]) and on the other of the specificity of this area, which attracts “unconventional” inhabitants. Those were, e.g., economic migrants, political refugees from Greece and Macedonia, or generally individuals looking for widely understood freedom and their own “place on Earth” in a romantic mountain landscape.
Notably, the results of the 2019 elections showed a significant increase in support for the “Solidary Poland” camp (e.g., support for PiS exceeded 40%), as demonstrated by a large number of communes where maximum support exceeded 80% (40 communes), while minimum support in selected communes increased to approximately 20%. In the area of prevailing support for the “Solidary Poland” camp, in 2019 (just as in 2015) there were clusters of communes where such support was relatively weak. Exceptions included highly urbanised communes of the Warsaw and Lodz agglomerations, selected communes located in north-eastern Poland (Podlasie) inhabited by Belarusians, Muslims and members of the Orthodox Church, and the Bieszczady Mountains located in peripheral parts of south-eastern Poland and inhabited by a population from western Poland. Additionally notably, in 2005 the distribution of communes with above-average support for either political formation was to a large extent of a point-concentric nature, providing evidence that Poles did not vary greatly in their political opinions. However, the situation changed dramatically in the next few years. Starting in 2007, political views continued to divide Poland into two parts, while the distribution of support changed into surface-concentric. This may be interpreted as an increase in the diversity of citizens’ political views in a spatial arrangement.
4. Socio-Economic Growth vs. Political Preferences in Poland in the Years 2005–2015
The spatial distribution of the level of social and economic development demonstrates clear regularities, corresponding to the spatial distribution of political support (especially in 2015) for the political parties representing “Solidary Poland” and “Liberal Poland”.
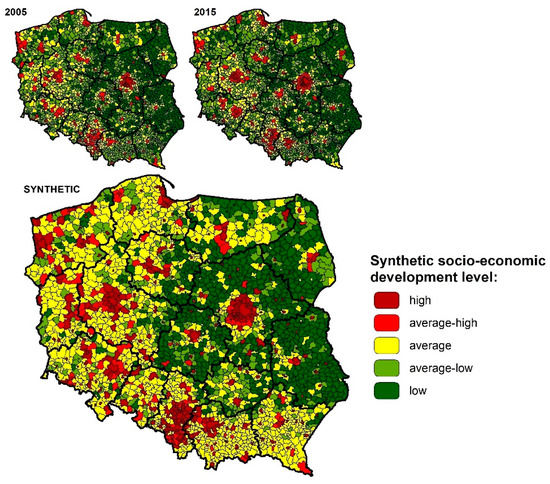
In Poland, differences in socio-economic development are quite apparent at a local level, in a generalised division between western and eastern Poland. To present these differences, we use classification showing in a synthetic way the development of communes in 2004–2018. Due to the fact that a classification is a synthetic picture, we can assume that it depicts fixed social and economic differences in Poland at a local level, as confirmed by the partial distributions for 2005 and 2015 (Figure 3).
Figure 3. Socio-economic development in Poland by commune (source: authors’ own elaboration).
In the classification, five types of communes can be identified, encompassing units with high to low levels of development. The spatial distribution of communes with high and average-high levels of growth strongly corresponds with highly urbanised (and, to some extent, highly industrialised) areas (
Figure 3). The biggest cities and their immediate vicinities can be treated as growth poles and areas of socio-economic development, in a national and regional approach (mainly in western Poland). The major cities include Warsaw, Poznań, Wrocław, Krakow, Tri-City, Szczecin and, to a lesser extent, the remaining capitals of the provinces. On the other hand, eastern Poland hosts an above-average concentration of communes with low and average-low levels of development, located chiefly in regional and industrial centres. Therefore, poorly developed areas can be treated as peripheries of socio-economic growth
[34][35].
Therefore, an attempt was made to verify the hypothesis concerning the relationship between the level of social and economic development and the level of political support. For this purpose, several regression methods were used, in which the level of political support for political parties representing the “Solidary Poland” block, expressed as a percentage of votes cast for parties from this block, was assumed as a dependent variable (Y), while the value of a synthetic indicator presenting the level of social and economic development was assumed as an explanatory variable. Each time the survey was conducted for both 2005 and 2015. The variables used in the analysis were continuous (quotient), but they did not have a normal distribution (tests for normality: Kolmogorov–Smirnov, Lilliefors, Shapiro–Wilk, p < 0.00000).
In the first step, a simple regression analysis using the least squares method was carried out. OLS regression modelling showed no correlation between the indicated variables. The determination factor R2 was 0.04 and 0.08, respectively, at Akaike information criterion values of 19,248 and 19,524. To identify the spatial differentiation of the relationship between the level of socio-economic development and the level of political support, GWR models were estimated. As a result of the estimation procedure, a set of 2478 localised regression equations and local measures of the degree of matching were obtained (
Table 2). The GWR models, through which for each observation, equations were estimated taking into account the characteristics (explanatory variable) of the neighbouring locations, indicated a much better match between the model and the empirical data. The global values of the adjusted GWR model determination factor were 0.553 and 0.767, respectively, while the AIC values were 17,506 and 16,237 (σ = 8.022 and 6.258) (All computations were based on ArcGIS 10.3 software with the GWR module
[36]). However, it should be remembered that GWR only allows one to determine the strength of the impact of an explanatory variable on a dependent variable in a specific location. The local values of R2 indicate how well the explanatory variable values around a specific point replicate the dependent variable. Therefore, these values should not be directly identified with R2 from the global model. Local R2 values reflect two issues: how well the model replicates data and how stationary the modelled processes are.
Table 2. Properties of the estimated GWR models * (source: authors’ own compilation).
| |
2005 |
2015 |
| R2 adj. |
0.553 |
0.767 |
| AIC |
17,506 |
16,237 |
| Sigma |
8.022 |
6.258 |
| Effective number |
327 |
256 |
| Bandwidth (m) |
28,470 |
32,329 |
| |
SE |
b0 |
b1 |
SE b1 |
local R2 |
SE |
b0 |
b1 |
SE b1 |
local R2 |
| Min |
0.83 |
–32.34 |
–147.42 |
12.57 |
0.000 |
0.93 |
–5.41 |
–266.11 |
10.64 |
0.000 |
| Max |
7.88 |
75.26 |
324.48 |
155.74 |
0.431 |
6.17 |
123.40 |
182.13 |
97.32 |
0.595 |
| Mean |
7.45 |
16.22 |
85.98 |
44.37 |
0.105 |
5.92 |
61.05 |
–79.11 |
31.17 |
0.133 |
| St. dev. |
0.53 |
15.98 |
71.17 |
15.69 |
0.099 |
0.32 |
22.18 |
63.04 |
11.65 |
0.125 |
| coefficient of variation |
0.07 |
0.99 |
0.83 |
0.35 |
0.945 |
0.05 |
0.36 |
0.80 |
0.37 |
0.940 |
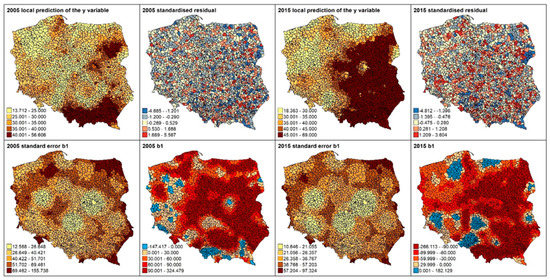
The spatial distribution of predicted values of political support resulting from the level of socio-economic development in both years under review is generally highly consistent with the actual distribution of political preferences (Figure 4). Nevertheless, in both 2005 and 2015 there was spatial autocorrelation of standardised remnants of regression (GWR). The values of Moran I global statistics were 0.124 (z-score 9.99, p = 0.00000) and 0.216 (z-score 17.375, p = 0.00000), respectively, but it is worth noting that no LISA (Local Indicators of Spatial Association) was statistically significant at α = 0.001. At α = 0.05, by contrast, there were several statistically significant hot spots, most of which were relatively easy to interpret. The low-low areas include the south-eastern part of Podlaskie Voivodeship where there are Belarusian, Orthodox and Muslim minorities, the area of Opole Silesia inhabited by a German minority, the Silesian-Dąbrowa Basin with a traditionally left-wing electorate (Sosnowiec was the birthplace of Edward Gierek, First Secretary of the Polish United Workers’ Party between 1970 and 1980, who is associated with industrialisation and improving people’s quality of life) and the Bieszczady Mountains with a significant immigrant population. In turn, hot-hot areas are found in Kashubia and Podhale (traditional family model), in the Legnica-Głogów Basin and in the vicinity of Bełchatów and Stalowa Wola (industrial districts characterised by a large share of workers and their families).
Figure 4. Selected local parameters of GWR (source: own elaboration).
This situation indicates that the GWR model does not take into account variables related, for example, to the intensity of occurrence of national and/or religious minorities. The lack of such data in the communal perspective in both analysed periods results from the lack of official public statistics (the last data come from 2002 from the National Census). By contrast, the standard errors of the explanatory variables in both cases are highest in border areas, associated instead with the edge effect occurring when estimating the bandwidth and the kernel function.
 +1 credit