Your browser does not fully support modern features. Please upgrade for a smoother experience.
Submitted Successfully!
 +1 credit
Thank you for your contribution! You can also upload a video entry or images related to this topic.
For video creation, please contact our Academic Video Service.
| Version | Summary | Created by | Modification | Content Size | Created at | Operation |
|---|---|---|---|---|---|---|
| 1 | Carolina Rojas | + 2475 word(s) | 2475 | 2021-12-14 04:43:01 | | | |
| 2 | Bruce Ren | Meta information modification | 2475 | 2021-12-22 02:01:39 | | |
Video Upload Options
We provide professional Academic Video Service to translate complex research into visually appealing presentations. Would you like to try it?
Cite
If you have any further questions, please contact Encyclopedia Editorial Office.
Rojas, C. Fabrics to Eco-Friendly Blue-Green for Urban Wetland Development. Encyclopedia. Available online: https://encyclopedia.pub/entry/17392 (accessed on 22 June 2026).
Rojas C. Fabrics to Eco-Friendly Blue-Green for Urban Wetland Development. Encyclopedia. Available at: https://encyclopedia.pub/entry/17392. Accessed June 22, 2026.
Rojas, Carolina. "Fabrics to Eco-Friendly Blue-Green for Urban Wetland Development" Encyclopedia, https://encyclopedia.pub/entry/17392 (accessed June 22, 2026).
Rojas, C. (2021, December 21). Fabrics to Eco-Friendly Blue-Green for Urban Wetland Development. In Encyclopedia. https://encyclopedia.pub/entry/17392
Rojas, Carolina. "Fabrics to Eco-Friendly Blue-Green for Urban Wetland Development." Encyclopedia. Web. 21 December, 2021.
Copy Citation
In an urbanized world, the sustainability of cities will depend on their form and urban structure. In this sense, fabrics that are compact, dense, green, and suitable for non-motorized transport methods are more environmentally efficient.
urban fabric
urban wetlands
blue–green infrastructure
eco-friendly design
urban planning
1. Introduction
As we live on an urbanized planet, we know that the sprawl of cities has damaged aquatic ecosystems such as rivers, wetlands, lakes, and other ecosystems; additionally, the loss of biodiversity that has resulted from urban sprawl has affected cities. Therefore, since it has been demonstrated that human beings require proximity and interaction with nature in order to maintain a healthy lifestyle, this trend reduces our quality of life since natural spaces help reduce conditions that have a negative effect on mental health [1], such as stress [2][3][4]; this is especially important today due to the consequences of the COVID-19 pandemic. The confinement that has been caused by the pandemic has worsened the mental health condition of the population [5][6]. For this reason, access to leisure and recreation spaces is essential for improving the satisfaction and personal well-being of residents [7] around the word, and special attention should be paid to natural spaces. Likewise, the accessibility and integration of open and natural spaces within cities are crucial aspects that should be considered when discussing sustainable urban planning [8].
In modern cities, a number of new urban developments have not integrated nature as an essential ecosystemic element for the environmental quality of residential neighborhoods. While urban development has historically attempted to create healthier cities, such as through the theoretical garden city that was developed by Ebenezer Howard in 1898 [9], which favored greener and more natural designs, which, despite its contributions to urban planning, has ended up as a very utopian concept for developing cities because of staggering urban growth and environmentally negative external factors. In fact, the application of greener and more natural designs to a real city with a similar residential fabric and transport structures to that of Howard’s proposed garden city also implies that these cities are more accessible, with residents being able to walk to open, green spaces, as opposed to in traditional cities, where one may experience longer travel times [10]. Therefore, one of the largest challenges that is faced by present-day cities that have already been built and that are undergoing continuous expansion is the fact that they have only ever included the development of grey infrastructure; this makes it difficult to be able to achieve eco-friendly urban development and a design that can overcome the lack of access to open, green spaces; the use of water; traffic due to an increase in motorization; pollution and CO2 emissions; among other things, and this new type of urban development is an opportunity for sustainability.
One of the current movements in urban planning has been seen through strong government policies to build low-emission eco-cities that allow for the co-existence of nature and sustainability; these cities are primarily found in China and Japan [11][12]. However, in cities that have highly organic and uneven growth, such as cities in Latin America, this is practically impossible. Latin American cities, despite being low in emissions and carbon footprint compared to European and US cities [13][14], face multiple issues of socioeconomic inequality and deficient environmental conditions along with weak urban planning and design instruments, such that creating a sustainable city would be an enormous feat. One possible route is urban development that not only includes green spaces but that also blue spaces, as one of the critical points of sustainable development is the protection and integration of nature, especially bodies of water such as wetlands, in residential areas, as these ecosystems are disappearing.
It is estimated that 4.6% of the Earth’s surface is wetlands [15] (Gardner et al., 2015), of which around 70% have suffered some type of transformation, degradation, or have simply disappeared in the last few decades [16][17]. In fact, Latin America is the leader in terms of wetland loss in recent decades [18], as the role wetlands play in controlling flooding, water cycles, and their potential as blue–green spaces in the city for leisure and recreation has been ignored. The rising level of urbanization in Latin American cities has brought about a sharp loss and the fragmentation of wetlands and has negatively impacted their ecological value and biodiversity [19][20]. Even in wetlands that are located in cities or urban wetlands that are classified under the Ramsar conservation system in addition to losses in surface area the surrounding areas have been urbanized by residential complexes, as in the case of Pantanos de Villa in Lima, Peru [21]. Coastal wetlands are ecosystems that provide multiple benefits for cities (i.e., biodiversity, flood control, coastal protection, carbon sequestration, etc.) [22][23][24], and understanding all of their functions and current status is crucial for their protection and conservation [25]. Due to urban and suburban growth, wetlands have been susceptible to transformations [26] and, to offset the negative effects of urbanization, they must be incorporated within urban planning [27].
In global sustainability efforts, we are aware of the 17 SDGs (Sustainable Development Goals), where SDG 11 presents goals for more inclusive, healthier, safer, and more resilient cities and settlements. However, urban development policies have provided less attention to the biodiversity and ecosystem services of natural open spaces (such as wetlands) in the planning of residential neighborhoods and have instead focused more on access to green areas [20][21][22][23][24][25][26][27][28][29] due to their multiple benefits for the urban form and for the health of residents. In fact, the proximity of residential areas to nature favors health conditions to address cardiovascular risks [30] and can even reduce mortality rates [31]. Urban designs that integrate green and blue spaces (blue–green infrastructure), such as flooding parks or waterfronts, are essential for advancing towards sustainable and healthy cities with more resilient neighborhoods.
To integrate the blue–green solution, or a strategically planned network with nature-based solutions that provide ecosystem services [32], it is necessary to first understand how the urban form of the city operates. That is, it is necessary to delve into the characterization and planning of residential urban fabrics in order to favor urban development and a landscape with more sustainable urban forms. This comprehension needs mathematical models, or so-called “science of cities”, due to the complex evolution of urban settlements, and in this way, it is possible to discover opportunities for urban development to allow for the integration of natural green and blue spaces such as wetlands for more livable neighborhoods. Urban fabrics are physical expressions of the forms of urban land use, and these have largely been planned without considering the ecological attributes of land-use. Urban fabrics also have an impact on mobility, as they are structures that favor walking, public transportation, or automobile use in city neighborhoods [33]; this translates into compact and disperse structures, with compact structures being more environmentally sustainable because of their proximity, and these structures are also better able to mitigate climate change [34].
2. Urban Fabrics
First, Latin American cities have diverse types of residential fabrics in nearby areas, making their detection a highly complex task. In the case of the areas surrounding the Concepcion wetlands, the dominant construction type corresponds to low- and medium-density fabrics and has a highly heterogeneous distribution, and the distribution of the fabrics shows that they continue to be less consolidated areas with a large amount of open land with vegetation to be managed. The distribution of the fabrics and the land uses are presented in Figure 1.
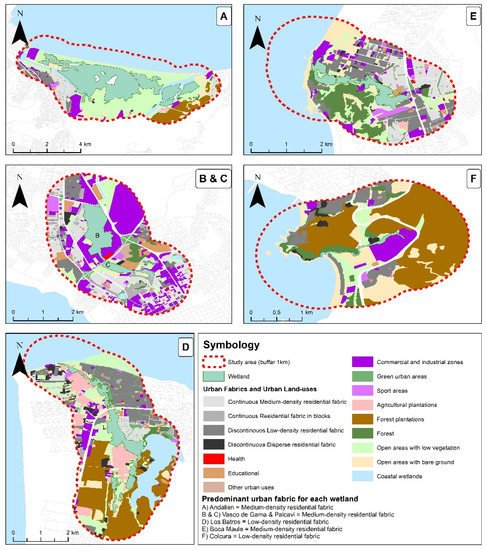
Figure 1. Characterization of the urban-natural fabrics of wetlands. (A) Rocuant-Andalién; (B,C) Vasco de Gama and Paicaví; (D) Los Batros; (E) Boca Maule; (F) Colcura.
The urban fabrics detected may differ by wetland and are presented in Table 1. The following paragraphs discuss their percentages by considering 100% of the total surface area of the 1 km buffer:
Table 2. Types of urban fabrics and land uses.
| Andalién | Paicaví-Vasco de Gama | Los Batros | Boca Maule | Colcura | ||||||
|---|---|---|---|---|---|---|---|---|---|---|
| Urban Fabrics and Urban Land Uses | Ha | % | Ha | % | Ha | % | Ha | % | Ha | % |
| Low-density residential fabric | 82 | 3.5 | 83 | 8.3 | 233 | 14 | 158.4 | 15.6 | 54 | 8.9 |
| Medium-density residential fabric | 146 | 6.2 | 206 | 21 | 59 | 3.4 | 115.1 | 11.3 | 9 | 1.4 |
| Disperse residential fabric | 5 | 0.2 | 10 | 1 | 55 | 3.2 | 10.7 | 1 | 0 | 0 |
| Residential fabric in blocks | 2 | 0.1 | 63 | 6.4 | 22 | 1.3 | 4.7 | 0.5 | 0 | 0 |
| Commercial and industrial zones | 140 | 6 | 335 | 34 | 59 | 3.4 | 64.8 | 6.4 | 31 | 5.2 |
| Open areas with low vegetation | 803 | 34 | 96 | 9.6 | 272 | 16 | 131.9 | 13 | 37 | 6.1 |
| Open areas with bare ground | 158 | 6.8 | 14 | 1.4 | 65 | 3.8 | 128.3 | 12.6 | 81 | 13.4 |
| Sports areas | 11 | 0.5 | 29 | 2.9 | 11 | 0.6 | 18.2 | 1.8 | 2 | 0.3 |
| Coastal wetlands | 748 | 32 | 12 | 1.2 | 343 | 20 | 247.5 | 24.4 | 133 | 22.1 |
| Green urban areas | 13 | 0.5 | 37 | 3.8 | 39 | 2.3 | 14.4 | 1.4 | 0 | 0 |
| Forest | 15 | 0.7 | 24 | 2.4 | 18 | 1 | 13.9 | 1.4 | 27 | 4.6 |
| Agricultural plantations | 16 | 0.7 | 0 | 0 | 157 | 9.1 | 5.7 | 0.6 | 0 | 0 |
| Educational | 12 | 0.5 | 65 | 6.5 | 16 | 0.9 | 10.1 | 1 | 1 | 0.2 |
| Forest plantations | 184 | 7.9 | 0 | 0 | 365 | 21 | 89.8 | 8.9 | 227 | 37.7 |
| Health | 1 | 0 | 4 | 0.4 | 0 | 0 | 0.7 | 0.1 | 0 | 0 |
| Other urban uses | 1 | 0 | 18 | 1.8 | 7 | 0.4 | 1.4 | 0.1 | 0 | |
A. Rocuant-Andalién: The largest wetland in surface area presents the highest percentage of use in open natural areas with low vegetation (34.4%), followed by forest plantations (7.9%). In the case of artificial lands, the most predominant are residential fabrics with medium density at 6%, which put pressure on the coastal marsh, followed by commercial and industrial areas, also with 6%. The low amount of surface area in green urban areas in these urbanizations must be mentioned, with a low representation of just 0.5%.
B and C. Vasco de Gama and Paicaví: These are marsh wetlands and are perhaps the most urbanized in the area. These wetlands are dominated by commercial and industrial areas, with 33.6% coverage, with respect to urban fabrics, and medium-density residential fabrics represent 21% in these neighborhoods, with 9% in open areas with low vegetation, and low-density residential fabrics with 8%. These urbanizations show a larger presence of green urban areas with 37 hectares (ha).
D. Los Batros: Recognized as an area of important biodiversity, it is highly impacted by forest plantations, with this use being the most relevant at 21.2%, followed by open areas with low vegetation with 15%. Of the constructed areas, the low-density residential fabric represents 13% of residential complexes as well as good transport infrastructure for cars and accessibility to the main urban centers. The northern part of this wetland also has agricultural plantations (vegetables) with 9.1%.
E. Boca Maule: Artificial lands correspond to 15.6%, and in constructed areas, low-density residential fabrics have the greatest representation (15.6%), followed by the medium-density residential fabric (11.3%). In terms of non-constructed spaces, it has open areas with low vegetation (13%) and bare soil (12.6%).
F. Colcura: This wetland is in a more rural setting and is characterized by one-third of its surface area being used for forest plantations (37.7%) followed by bare soil (13.4%). With respect to residential fabrics, they are more dispersed, with the most common being the low density fabric at 8.9%.
3. Urbanization Process
The results of the statistical models help describe the urbanization processes that these wetlands have suffered through due to the fact that urban growth directly and indirectly alters ecosystems and their surroundings, especially when the land use is more artificial. Specifically, the wetlands in Concepcion have experienced a reduction in surface area and increased fragmentation and invasion of exotic species, turning natural water landscapes into fragmented soils [35]. However, the different occupancy types of the construction models were unknown, and we will explain this according to the urbanization factors that were evaluated.
This study considers the usual 5% for significance, and the results are presented for each wetland (Table 2 and Figure 2).
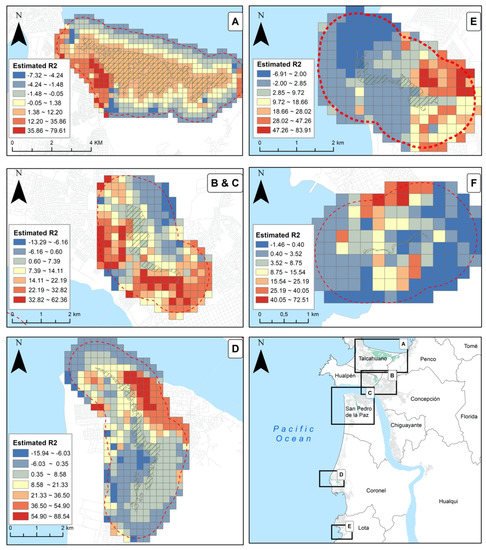
Figure 2. Geographical distribution of OLS for “Ruta del Agua” Wetlands (The OLS model represents an overall parameter of the average influence of the explanatory variables on the dependent variable. Figure 2 shows that there are zones with a greater R2, which means that the variables better explain the behavior of the medium- and low-density urban fabric here, where a negative R2 means that the variables fail to explain such behavior, such as in non-urbanized areas. The proximity of urbanized areas to the wetlands with a positive R2 reflects the zones where these natural spaces face strong pressure from human activity and must be considered fundamental to the comprehensive planning of blue–green infrastructure). (A) Rocuant-Andalién; (B,C) Vasco de Gama and Paicaví; (D) Los Batros; (E) Boca Maule; (F) Colcura.
Table 2. Summary of OLS model results for the Concepcion wetlands.
| Wetland | Rocuant-Andalién | |||||||
| Dependent Variable | Medium-Density Residential Fabric | No. of Observations | 573 | |||||
| Akaike’s Information Criterion (AICc) | 4281.46 | Adjusted R-Squared (d): | 0.574749 | |||||
| Variable | Coefficient (a) | StdError | t-Statistic | Probability | Robust_SE | Robust_t | Robust_Pr | VIF |
| Intercept | 1.479578 | 0.603576 | 2.451355 | 0.014520 * | 0.341604 | 4.331266 | 0.000021 * | −−−−−−−− |
| UF (8) Commercial | −0.077781 | 0.030034 | −2.589762 | 0.009844 * | 0.023914 | −3.252481 | 0.001226 * | 1.024641 |
| DW | −0.004292 | 0.001314 | −3.266029 | 0.001171 * | 0.001209 | −3.551688 | 0.000428 * | 1.098586 |
| PD | 0.202241 | 0.017155 | 11.788753 | 0.000000 * | 0.065895 | 3.069135 | 0.002261 * | 2.239917 |
| GA | 27.61484 | 3.163336 | 8.729656 | 0.000000 * | 8.769027 | 3.149134 | 0.001737 * | 1.298518 |
| SC | 0.01919 | 0.004671 | 4.107877 | 0.000052 * | 0.01436 | 1.336309 | 0.181994 | 2.139414 |
| Wetland | Vasco de Gama and Paicaví | |||||||
| Dependent Variable | Medium-Density Residential Fabric | No. of Observations | 229 | |||||
| Akaike’s Information Criterion (AICc) | 1924.43 | Adjusted R-Squared (d): | 0.437780 | |||||
| Variable | Coefficient (a) | StdError | t-Statistic | Probability | Robust_SE | Robust_t | Robust_Pr | VIF |
| Intercept | 0.58516 | 2.185359 | 0.267764 | 0.789133 | 1.801237 | 0.324866 | 0.745597 | −−−−−−−− |
| DR | 0.010105 | 0.002935 | 3.442485 | 0.000700 * | 0.002734 | 3.69566 | 0.000286 * | 1.165158 |
| DW | −0.01438 | 0.003374 | −4.261519 | 0.000034 * | 0.003209 | −4.480949 | 0.000014 * | 1.105671 |
| PD | 0.036331 | 0.019897 | 1.825942 | 0.069199 | 0.021786 | 1.667633 | 0.096802 | 1.382216 |
| GA | −1.423271 | 1.440658 | −0.987931 | 0.324247 | 0.782351 | −1.819223 | 0.070222 | 1.022536 |
| SC | 0.062238 | 0.006427 | 9.683684 | 0.000000 * | 0.008261 | 7.533562 | 0.000000 * | 1.332181 |
| Wetland | Los Batros | |||||||
| Dependent Variable | Low-Density Residential Fabric | No. of Observations | 357 | |||||
| Akaike’s Information Criterion (AICc) | 2829.48 | Adjusted R-Squared (d): | 0.692092 | |||||
| Variable | Coefficient (a) | StdError | t-Statistic | Probability | Robust_SE | Robust_t | Robust_Pr | VIF |
| Intercept | −4.416449 | 2.492263 | −1.772064 | 0.077262 | 2.204961 | −2.00296 | 0.045948 * | −−−−−−−− |
| Land use Agricultural | −0.094866 | 0.036419 | −2.604849 | 0.009578 * | 0.02459 | −3.857895 | 0.000145 * | 1.113709 |
| DR | 0.003053 | 0.000932 | 3.276515 | 0.001170 * | 0.00084 | 3.633749 | 0.000333 * | 1.310147 |
| DW | −0.010435 | 0.002133 | −4.891931 | 0.000002 * | 0.002213 | −4.714317 | 0.000005 * | 1.142465 |
| DC | 0.001445 | 0.000697 | 2.072198 | 0.038971 * | 0.000742 | 1.945934 | 0.052461 | 1.060735 |
| BP | 1.306881 | 0.291555 | 4.48245 | 0.000012 * | 0.450045 | 2.903889 | 0.003925 * | 1.263293 |
| PD | 0.041848 | 0.017654 | 2.37042 | 0.018298 * | 0.023473 | 1.782853 | 0.075484 | 1.512545 |
| SC | 0.098315 | 0.005166 | 19.030168 | 0.000000 * | 0.008312 | 11.828637 | 0.000000 * | 1.736653 |
| Wetland | Boca Maule | |||||||
| Dependent variable | Medium-Density Residential Fabric | No. of Observations | 199 | |||||
| Akaike’s Information Criterion (AICc) | 1595.38 | Adjusted R-Squared (d): | 0.619829 | |||||
| Variable | Coefficient (a) | StdError | t-Statistic | Probability | Robust_SE | Robust_t | Robust_Pr | VIF |
| Intercept | −12.333295 | 6.249969 | −1.973337 | 0.049888 * | 3.99988 | −3.083416 | 0.002356 * | −−−−−−−− |
| DR | 0.00265 | 0.001708 | 1.55107 | 0.122543 | 0.001047 | 2.531566 | 0.012149 * | 2.858122 |
| DC | 0.004346 | 0.002406 | 1.806327 | 0.072437 | 0.002291 | 1.896477 | 0.059398 | 3.539482 |
| BP | 0.166251 | 0.087164 | 1.907328 | 0.05797 | 0.048656 | 3.416839 | 0.000784 * | 1.197356 |
| DD | 0.537628 | 0.087482 | 6.145548 | 0.000000 * | 0.12766 | 4.211402 | 0.000043 * | 2.224324 |
| GA | 21.521305 | 3.578551 | 6.013972 | 0.000000 * | 5.00599 | 4.299111 | 0.000031 * | 1.417597 |
| SC | 0.019234 | 0.00684 | 2.811806 | 0.005439 * | 0.010076 | 1.908937 | 0.057761 | 1.91318 |
| Wetland | Colcura | |||||||
| Dependent Variable | Low-Density Residential Fabric | No. of Observations | 120 | |||||
| Akaike’s Information Criterion (AICc) | 898.590344 | Adjusted R-Squared (d): | 0.625410 | |||||
| Variable | Coefficient (a) | StdError | t-Statistic | Probability | Robust_SE | Robust_t | Robust_Pr | VIF |
| Intercept | −1.478911 | 1.59619 | −0.926526 | 0.356105 | 1.327025 | −1.114455 | 0.267404 | −−−−−−−− |
| DR | 0.002968 | 0.002847 | 1.042518 | 0.299352 | 0.002089 | 1.420563 | 0.158157 | 1.138438 |
| PD | 0.321759 | 0.03921 | 8.206065 | 0.000012 * | 0.071776 | 4.482846 | 0.000020 * | 1.352942 |
| GA | 4.846815 | 5.635868 | 0.859994 | 0.391573 | 7.171373 | 0.675856 | 0.500487 | 1.032187 |
| SC | 0.048614 | 0.008622 | 5.638533 | 0.000112 * | 0.015297 | 3.178003 | 0.001911 * | 1.520436 |
A. Rocuant-Andalién: In the case of Andalién, type 1 was used (medium-density residential fabric) as a dependent variable, with five explanatory variables. The model presented an R2 of 0.57, which is fairly optimal, with a significant density of inhabitants and density of green areas and the highest positive coefficient, indicating that there is greater probability of an increase in density as the density of green areas also increases.
B and C. Paicaví and Vasco de Gama: The Paicaví and Vasco de Gama urban wetlands behave similarly, which is why they were evaluated together. Once again, type 1 (medium-density residential fabric) was the dependent variable, with five explanatory variables, obtaining an R2 of 0.43, which shows an excellent balance. The variable with the greatest effect is also the density of green areas, which had a negative value this time (−1.42), showing that when the surroundings are less green and more urbanized, densification rises, which is also affected by the slightly positive effect of road and highway density.
D. Los Batros: In the case of Los Batros, type 3 was used (low-density residential fabric) as a dependent variable, with five respective explanatory variables. This included the type 11 urban fabric (agricultural plantations), which represents a large part of the land. It shows a balanced R2 of 0.68, making it the most balanced model, where the positive construction permit variable has the greatest coefficient of 1.30, explaining why the low-density fabric increases with construction permits along with road and highway density.
E. Boca Maule: The Boca Maule wetland used type 1 (Medium-density residential fabric) as a dependent variable and six explanatory variables, obtaining a well-balanced R2 of 0.619, where the density of green areas explains the existence of medium-density fabrics with a positive coefficient, demonstrating that housing density has a lesser effect.
F. Colcura: In the case of the Colcura wetland, the most rural of the area’s wetlands, type 3 was used (low-density residential fabric) as the dependent variable, with four explanatory variables. A balanced R2 of 0.625 was obtained, explaining 60% variance. In this case, the density of the green area variable carries the most weight in the model, demonstrating a positive coefficient (4.8), repeating the relationship found between Rocuant-Andalién and Boca Maule.
References
- Chiabai, A.; Quiroga, S.; Martinez-Juarez, P.; Suárez, C.; García de Jalón, S.; Taylor, T. Exposure to green areas: Modelling health benefits in a context of study heterogeneity. Ecol. Econ. 2020, 167, 106401.
- Hedblom, M.; Gunnarsson, B.; Iravani, B.; Knez, I.; Schaefer, M.; Thorsson, P.; Lundström, J.N. Reduction of physiological stress by urban green space in a multisensory virtual experiment. Sci. Rep. 2019, 9, 10113.
- Tyrväinen, L.; Ojala, A.; Korpela, K.; Lanki, T.; Tsunetsugu, Y.; Kagawa, T. The influence of urban green environments on stress relief measures: A field experiment. J. Environ. Psychol. 2014, 38, 1–9.
- Stigsdotter, U.A. Urban green spaces: Promoting health through city planning. In Proceedings of the Inspiring Global Environmental Standards and Ethical Practices, The National Association of Environmental Professionals, Alexandria, VA, USA, 16–19 April 2005.
- Moreno, C.; Wykes, T.; Galderisi, S.; Nordentoft, M.; Crossley, N.; Jones, N.; Cannon, M.; Correll, C.U.; Byrne, L.; Carr, S.; et al. How mental health care should change as a consequence of the COVID-19 pandemic. Lancet Psychiatry. 2020, 7, 813–824.
- Ramírez-Ortiz, J.; Castro-Quintero, D.; Lerma-Córdoba, C.; Yela-Ceballos, F.; Escobar-Córdoba, F. Mental health consequences of the COVID-19 pandemic associated with social isolation. Colomb. J. Anesthesiol. 2020, 48.
- Loftness, V.; Aziz, A.; Choi, J.; Kampschroer, K.; Powell, K.; Atkinson, M.; Heerwagen, J. The value of post-occupancy evaluation for building occupants and facility managers. Intell. Build. Int. 2009, 1, 249–268.
- Gupta, K.; Roy, A.; Luthra, K.; Maithani, S. Mahavir GIS based analysis for assessing the accessibility at hierarchical levels of urban green spaces. Urban For. Urban Green. 2016, 18, 198–211.
- Howard, E. To-Morrow: A Peaceful Path to Real Reform; Cambridge University Press: Cambridge, UK, 1989.
- Yuan, Z.; Zheng, X.; Lv, L.; Xue, C. From design to digital model: A quantitative analysis approach to Garden Cities theory. Ecol. Modell. 2014, 289, 26–35.
- Li, J.; Wang, Q.; Xuan, Y.; Zhou, H. User demands analysis of Eco-city based on the Kano model—An application to China case study. PLoS ONE 2021, 16, e0248187.
- Lin, Z. Ecological urbanism in East Asia: A comparative assessment of two eco-cities in Japan and China. Landsc. Urban Plan. 2018, 179, 90–102.
- Muñiz, I.; Rojas, C. Urban form and spatial structure as determinants of per capita greenhouse gas emissions considering possible endogeneity and compensation behaviors. Environ. Impact Assess. Rev. 2019, 76, 79–87.
- Gilles, E.; Ortiz, M.; Cadarso, M.-Á.; Monsalve, F.; Jiang, X. Opportunities for city carbon footprint reductions through imports source shifting: The case of Bogota. Resour. Conserv. Recycl. 2021, 172, 105684.
- Gardner, R.C.; Barchiesi, S.; Beltrame, C.; Finlayson, C.M.; Galewski, T.; Harrison, I.; Paganini, M.; Perennou, C.; Pritchard, D.; Rosenqvist, A.; et al. State of the World’s Wetlands and Their Services to People: A Compilation of Recent Analyses. SSRN Electron. J. 2015.
- Bouahim, S.; Rhazi, L.; Ernoul, L.; Mathevet, R.; Amami, B.; Er-Riyahi, S.; Muller, S.D.; Grillas, P. Combining vulnerability analysis and perceptions of ecosystem services in sensitive landscapes: A case from western Moroccan temporary wetlands. J. Nat. Conserv. 2015, 27, 1–9.
- MEA (MIllennium Ecosystem Assessment). Ecosystems and Human Well-Being: Synthesis. In Ecosystems and Human Well-Being: Synthesis; Island Press: Washington, DC, USA, 2005.
- Darrah, S.E.; Shennan-Farpón, Y.; Loh, J.; Davidson, N.C.; Finlayson, C.M.; Gardner, R.C.; Walpole, M.J. Improvements to the Wetland Extent Trends (WET) index as a tool for monitoring natural and human-made wetlands. Ecol. Indic. 2019, 99, 294–298.
- Martínez, C.; López, P.; Rojas, C.; Qüense, J.; Hidalgo, R.; Arenas, F. A sustainability index for anthropized and urbanized coasts: The case of Concón Bay, central Chile. Appl. Geogr. 2020, 116, 102166.
- Rojas, C.; Munizaga, J.; Rojas, O.; Martínez, C.; Pino, J. Urban development versus wetland loss in a coastal Latin American city: Lessons for sustainable land use planning. Land Use Policy 2019, 80, 47–56.
- Rojas, C. Urban wetland trends in three Latin American cities during the latest decades (2002–2020): Concón (Chile), Barranquilla (Colombia), and Lima (Perú). Wetl. Sci. Pract. 2020, 37, 283–293.
- Dabrowska-Zielinska, K.; Budzynska, M.; Tomaszewska, M.; Bartold, M.; Gatkowska, M.; Malek, I.; Turlej, K.; Napiorkowska, M. Monitoring Wetlands Ecosystems Using ALOS PALSAR (L-Band, HV) Supplemented by Optical Data: A Case Study of Biebrza Wetlands in Northeast Poland. Remote Sens. 2014, 6, 1605–1633.
- Penatti, N.C.; de Almeida, T.I.R.; Ferreira, L.G.; Arantes, A.E.; Coe, M.T. Satellite-based hydrological dynamics of the world’s largest continuous wetland. Remote Sens. Environ. 2015, 170, 1–13.
- Basu, T.; Das, A.; Pham, Q.B.; Al-Ansari, N.; Linh, N.T.T.; Lagerwall, G. Development of an integrated peri-urban wetland degradation assessment approach for the Chatra Wetland in eastern India. Sci. Rep. 2021, 11, 4470.
- Novoa, V.; Rojas, O.; Ahumada-Rudolph, R.; Sáez, K.; Fierro, P.; Rojas, C. Coastal Wetlands: Ecosystems Affected by Urbanization? Water 2020, 12, 698.
- Athukorala, D.; Estoque, R.C.; Murayama, Y.; Matsushita, B. Impacts of Urbanization on the Muthurajawela Marsh and Negombo Lagoon, Sri Lanka: Implications for Landscape Planning towards a Sustainable Urban Wetland Ecosystem. Remote Sens. 2021, 13, 316.
- Jia, H.; Ma, H.; Wei, M. Urban wetland planning: A case study in the Beijing central region. Ecol. Complex. 2011, 8, 213–221.
- Rigolon, A. A complex landscape of inequity in access to urban parks: A literature review. Landsc. Urban Plan. 2016, 153, 160–169.
- Neuvonen, M.; Sievänen, T.; Tönnes, S.; Koskela, T. Access to green areas and the frequency of visits—A case study in Helsinki. Urban For. Urban Green. 2007, 6, 235–247.
- Liu, T.; Cai, B.; Peng, W.; Xiao, L.; Shi, H.; Wu, X.; Gao, H.; Jia, X. Association of neighborhood greenness exposure with cardiovascular diseases and biomarkers. Int. J. Hyg. Environ. Health. 2021, 234, 113738.
- Gascon, M.; Triguero-Mas, M.; Martínez, D.; Dadvand, P.; Rojas-Rueda, D.; Plasència, A.; Nieuwenhuijsen, M.J. Residential green spaces and mortality: A systematic review. Environ. Int. 2016, 86, 60–67.
- Mijic, A.; Brown, K. Integrating Green and Blue Spaces into Our Cities: Making It Happen; Grantham Institute: London, UK, 2019; Volume 30.
- Helminen, V.; Tiitu, M.; Kosonen, L.; Ristimäki, M. Identifying the areas of walking, transit and automobile urban fabrics in Finnish intermediate cities. Transp. Res. Interdiscip. Perspect. 2020, 8, 100257.
- Angel, S.; Arango Franco, S.; Liu, Y.; Blei, A.M. The shape compactness of urban footprints. Prog. Plan. 2020, 139, 100429.
- Rojas, C.; Sepúlveda-Zúñiga, E.; Barbosa, O.; Rojas, O.; Martínez, C. Patrones de urbanización en la biodiversidad de humedales urbanos en Concepción metropolitano. Rev. Geogr. Norte Gd. 2015, 181–204.
More
Information
Subjects:
Geography
Contributor
MDPI registered users' name will be linked to their SciProfiles pages. To register with us, please refer to https://encyclopedia.pub/register
:
View Times:
1.0K
Entry Collection:
Environmental Sciences
Revisions:
2 times
(View History)
Update Date:
22 Dec 2021
Table of Contents


Notice
You are not a member of the advisory board for this topic. If you want to update advisory board member profile, please contact office@encyclopedia.pub.
OK
Confirm
Only members of the Encyclopedia advisory board for this topic are allowed to note entries. Would you like to become an advisory board member of the Encyclopedia?
Yes
No
${ textCharacter }/${ maxCharacter }
Submit
Cancel
Back
Comments
${ item }
|
${ item.createdUser.fullName }
${ item.createdAt }
${ item.vote }
${ item.reply }
Delete
${ reply.createdUser.fullName }
${ reply.createdAt }
${ reply.vote }
Delete
There is no reply to this comment~
${ item.replyTextCharacter }/${ item.replyMaxCharacter }
Submit
Cancel
More
No more~
There is no comment~
${ textCharacter }/${ maxCharacter }
Submit
Cancel
${ selectedItem.replyTextCharacter }/${ selectedItem.replyMaxCharacter }
Submit
Cancel
Confirm
Are you sure to Delete?
Yes
No