Submitted Successfully!
To reward your contribution, here is a gift for you: A free trial for our video production service.
Thank you for your contribution! You can also upload a video entry or images related to this topic.
Version Summary Created by Modification Content Size Created at Operation
1 + 945 word(s) 945 2021-12-15 08:58:51 |
2 update references and layout + 676 word(s) 1621 2021-12-21 02:11:29 | |
3 update layout + 681 word(s) 1626 2021-12-21 02:12:17 |

Video Upload Options

Do you have a full video?

Confirm

Are you sure to Delete?
Cite
If you have any further questions, please contact Encyclopedia Editorial Office.
Li, H. Transcription Factor 21 and Chicken Adipocyte Differentiation. Encyclopedia. Available online: https://encyclopedia.pub/entry/17320 (accessed on 27 July 2024).
Li H. Transcription Factor 21 and Chicken Adipocyte Differentiation. Encyclopedia. Available at: https://encyclopedia.pub/entry/17320. Accessed July 27, 2024.
Li, Hui. "Transcription Factor 21 and Chicken Adipocyte Differentiation" Encyclopedia, https://encyclopedia.pub/entry/17320 (accessed July 27, 2024).
Li, H. (2021, December 20). Transcription Factor 21 and Chicken Adipocyte Differentiation. In Encyclopedia. https://encyclopedia.pub/entry/17320
Li, Hui. "Transcription Factor 21 and Chicken Adipocyte Differentiation." Encyclopedia. Web. 20 December, 2021.
Transcription Factor 21 and Chicken Adipocyte Differentiation
Edit

Transcription factor 21 (TCF21) could promote chicken preadipocytes differentiation at least in part via activating MAPK/JNK pathway. 

broiler adipogenesis transcription factor 21 MAPK/JNK signaling

1. Introduction

In the poultry industry, excessive fat deposition in broiler chicken is not wanted by most customers, because many metabolic diseases like coronary heart disease and arteriosclerosis are strongly related to increased dietary intake of cholesterol [1]. Increased dietary cholesterol intake from fat may lead to increased serum cholesterol levels and further increased risks of metabolic diseases [2][3]. Additionally, excessive fat deposition hinders processing and leads to significant reductions in feed efficiency and carcass yield, thus incurring economic losses for poultry producers and processors [4][5]. In addition, excessive fat deposition in chicken has increased the incidence of metabolic disorders, such as pulmonary hypertension syndrome, sudden death, fatty liver disease [6][7][8], and reduced reproductive performance, such as less sperm concentration, more sperm with abnormal morphology, and less egg production [9].
Obesity onset is closely linked with the differentiation of adipocytes [10][11]. Therefore, to facilitate therapeutic prevention or treatment of obesity, it is of great significance to get a deeper understanding of the molecular mechanisms involved in adipogenesis. Multiple distinct transcription factors and signaling pathways serve together to regulate adipogenesis [12]. Many studies have provided detailed insights into the role of transcription factors in peroxisome proliferator activated receptor (PPAR) and CCAAT/enhancer binding protein (C/EBP) family, Wnt signaling, and TGF-β signaling in this context [13][14]. To offer new insights into the molecular mechanisms of adipogenesis, identification of novel transcription factors and pathways regulating adipogenesis is particularly vital. Recently, we have identified a novel transcription factor 21 (TCF21), which promotes chicken preadipocyte differentiation by regulating the expression of lipoprotein lipase (LPL) [15]. However, the signaling pathways, by which TCF21 influences this differentiation process, remain to be characterized.

2. Overexpression of TCF21 Leads to Enhanced Lipid Droplets Accumulation

To select a suitable time point for the following experiment, we compared the lipid accumulation between LV-control and LV-TCF21 during differentiation. First, we examined the overexpression effect of TCF21 in LV-TCF21 cells and the expression patterns of TCF21 in LV-control and LV-TCF21 cells. The results showed that both mRNA and protein expression levels of TCF21 in LV-TCF21 were significantly higher than those in LV-control before (0 h) and after induction of differentiation (24, 48, 72, 96, 120 h) (p < 0.01, Supplementary Figure S1). The expression patterns of TCF21 were similar in LV-control and LV-TCF21 cells that the expressions of TCF21 had an elevated trend after differentiation induction (Supplementary Figure S1). Specifically, the mRNA and protein expression patterns of TCF21 in LV-control cells were gradually increased after induction (Supplementary Figure S1). The mRNA expression pattern of TCF21 in LV-TCF21 cells was also gradually increased after induction, but its protein expression in LV-TCF21 cells had a minor decrease at 72 h after induction (Supplementary Figure S1). Meanwhile, we compared the lipid accumulation between LV-TCF21 and LV-control during differentiation in order to select an appropriate time point for the following experiment. The results showed that LV-TCF21 had remarkably more lipid droplets accumulation since 24 h post-induction of differentiation (p < 0.05 or p < 0.01, Figure S1).Overexpression of TCF21 leads to enhanced lipid droplets accumulation. Oleic acid was used to induce the differentiation of LV-control and LV-TCF21 preadipocytes for 0 - 120 h. (A) Images of the accumulation of lipid droplets in LV-control and LV-TCF21 cells by Oil red-O staining (representative of three independent experiments); (B) The Oil red-O dye was extracted from stained LV-control and LV-TCF21 preadipocytes at the indicated time points in order to quantify staining intensity. Graphs are plotted as mean ± SE from three independent experiments. NS, no significance, * P < 0.05, ** P < 0.01.

Overexpression of TCF21 leads to enhanced lipid droplets accumulation. Oleic acid was used to induce the differentiation of LV-control and LV-TCF21 preadipocytes for 0 - 120 h. (A) Images of the accumulation of lipid droplets in LV-control and LV-TCF21 cells by Oil red-O staining (representative of three independent experiments); (B) The Oil red-O dye was extracted from stained LV-control and LV-TCF21 preadipocytes at the indicated time points in order to quantify staining intensity. Graphs are plotted as mean ± SE from three independent experiments. NS, no significance, * P < 0.05, ** P < 0.01.

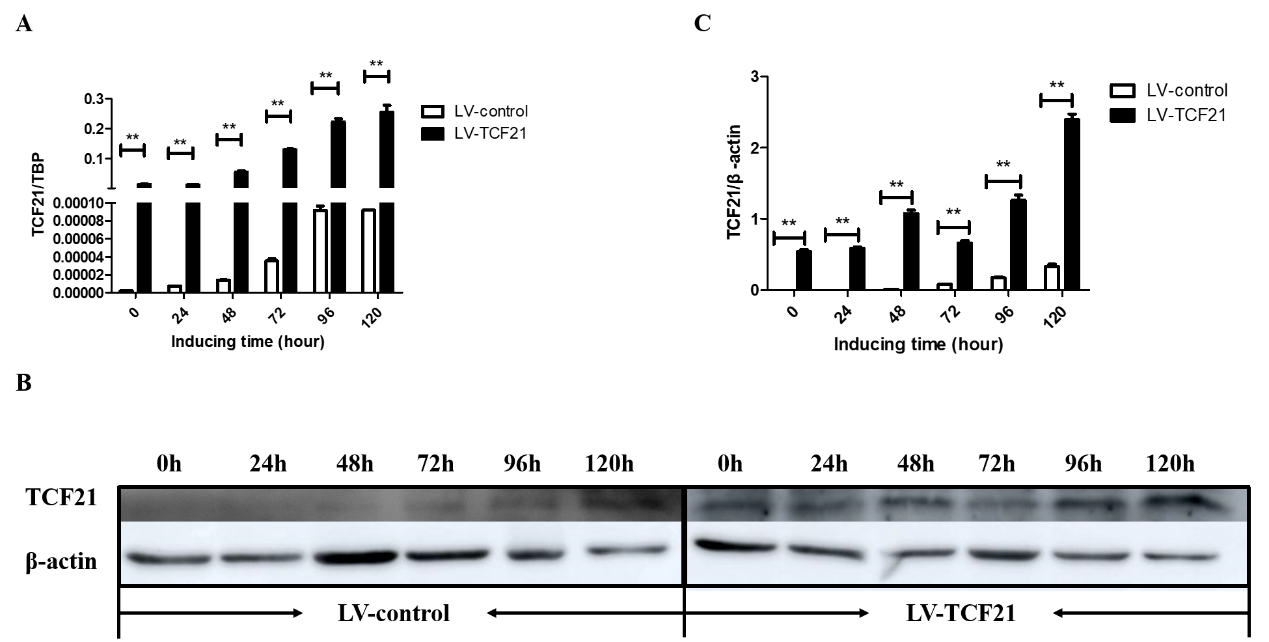
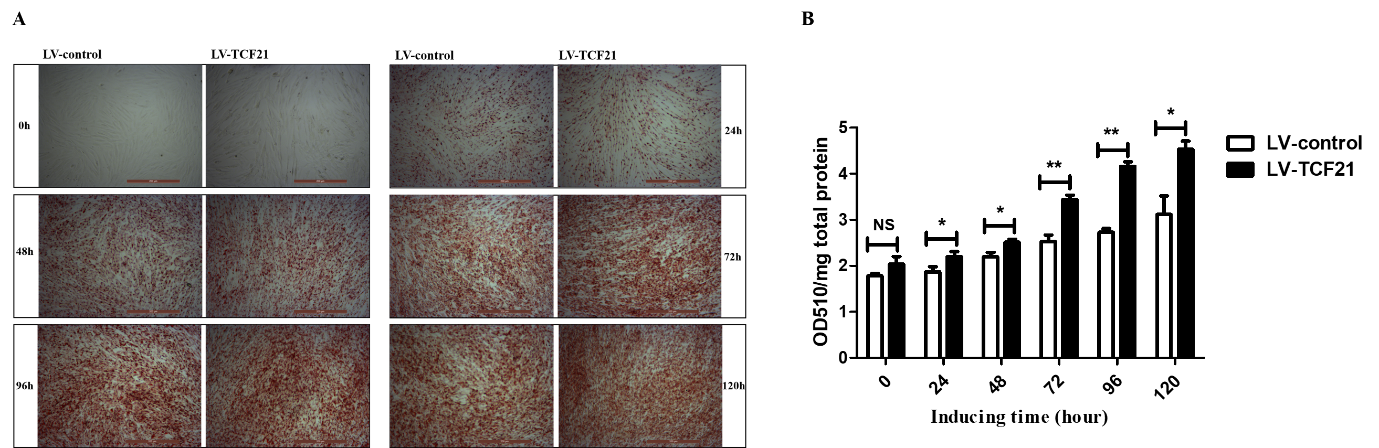
Supplementary Figure S1. Detection of TCF21 over-expression efficiency and its effect on lipid droplets accumulation. Oleic acid was used to induce the differentiation of LV-control and LV-TCF21 preadipocytes for 0 - 120 h. (A) The mRNA expression of TCF21 in LV-control and LV-TCF21 detected by real-time PCR. (B) Images for the protein expression of TCF21 in LV-control and LV-TCF21 detected by western blot (representative of three independent experiments). (C) The quantification of protein bands by Image J. (D) Images of the accumulation of lipid droplets in LV-control and LV-TCF21 cells by Oil red-O staining (representative of three independent 
experiments). (E) The Oil red-O dye was extracted from stained LV-control and LV-TCF21 preadipocytes at the indicated time points in order to quantify staining intensity. Graphs are plotted as mean ±SE from three independent experiments. NS, no significance, *p<0.05, ** p< 0.01

3. MAPK/JNK Signaling Pathway Was Activated by TCF21 Overexpression

Based on these initial findings, we selected 24 h to screen signaling pathways that were significantly activated or repressed in response to TCF21 overexpression. Among the 45 signaling pathways we analyzed, the activity of MAPK/JNK signaling pathway was significantly elevated by TCF21 overexpression (p = 0.000423, Figure 1A and  Table 1). Western blotting further confirmed that TCF21 overexpression enhanced JNK phosphorylation (p < 0.01, Figure 1B,C).
Table 1. The luciferase reporter assay of 45 pathways in LV-control and  LV-TCF21 
Pathway

LV-control(mean±SE)

LV-TCF21(mean±SE)

P-value

Amino acid deprivation

0.41 ± 0.37

0.062 ± 0.043

0.44

Androgen

/

/

/

Antioxidant response

/

/

/

ATF6

0.015 ± 0.0048

0.013 ± 0.0027

0.72

C/EBP

/

/

/

cAMP/PKA

/

/

/

Cell cycle

/

/

/

DNA damage

/

/

/

EGR1

/

/

/

ER stress

0.95 ± 0.72

0.90 ± 0.60

0.96

Estrogen

/

/

/

GATA

/

/

/

Glucocorticoid

/

/

/

Heat shock

/

/

/

Heavy metal

0.090 ± 0.065

0.11 ± 0.078

0.87

Hedgehog

/

/

/

HNF4

/

/

/

Hypoxia

/

/

/

Interferon regulation

/

/

/

Type 1 interferon

/

/

/

Interferon-r

/

/

/

KLF4

/

/

/

Liver X

/

/

/

MAPK/Erk

0.12 ± 0.043

0.11 ± 0.044

0.88

MAPK/Jnk

0.028 ± 0.0060

0.19 ± 0.014

0.000423

MEF2

/

/

/

Myc

/

/

/

Nanog

/

/

/

Notch

/

/

/

NFκB

0.081 ± 0.037

0.20 ± 0.11

0.36

Oct4

/

/

/

Pax6

/

/

/

PI3K/Akt

/

/

/

PKC/Ca+2

/

/

/

PPAR

/

/

/

Progesterone

/

/

/

Retinoic acid

/

/

/

Retinoid X

/

/

/

Sox2

/

/

/

SP1

0.3 ± 0.28

0.097 ± 0.067

0.52

STAT3

/

/

/

TGF-β

/

/

/

Vitamin D

/

/

/

Wnt

/

/

/

Xenobiotic

/

/

/

Negative control

0.00057 ± 0.000067

0.000625 ± 0.000062

0.59

MAPK/JNK Signaling Pathway was activated by TCF21 overexpression. At 24 h post- induction of differentiation, lysates from LV-control and LV-TCF21 cells were collected. (A) A Luciferase activity-based array was used in order to identify those signaling pathways that were responsive to overexpression of TCF21. Graphs are plotted as mean ± SE relative to luciferase activity in LV-control cells from three independent experiments; (B) Images for TCF21, JNK1, JNK2, p-JNK1, p-JNK2 and β-actin expressions in cells by western blotting; (C) Bands intensities were quantified by Image J software. Graphs are plotted as mean ± SE from three independent experiments. ** P < 0.01.

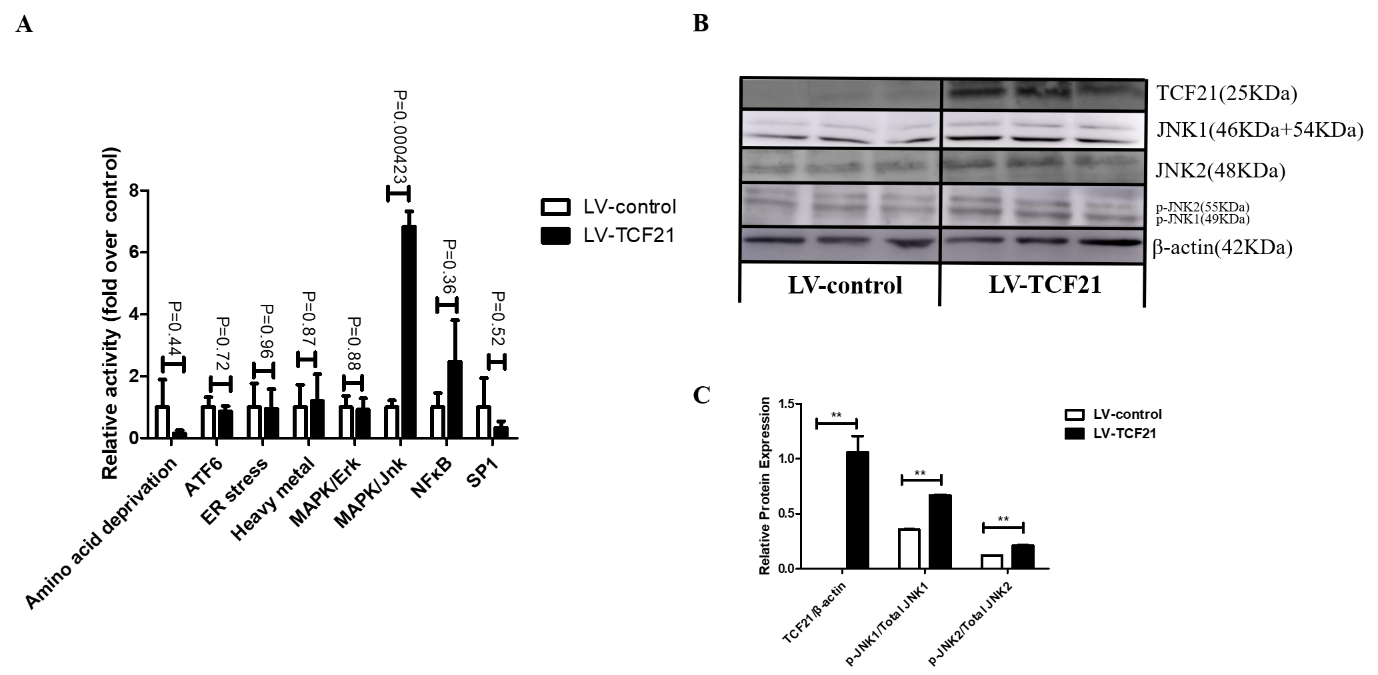
Figure 1. MAPK/JNK signaling pathway was activated by TCF21 overexpression. At 24 h post-induction of differentiation, lysates from LV-control and LV-TCF21 cells were collected. (A) A schematic overview of the constructs used for the Cignal Finder 45-Pathway Reporter Array. A. The inducible transcription factor-responsive construct expressing firefly luciferase. B. The constitutively expressing Renilla luciferase construct. C. The non-inducible firefly luciferase reporter construct. D. The constitutively expressing GFP construct. E. The constitutively expressing firefly luciferase construct. The negative control is a mixture of C. and B. (20:1). The positive control is a mixture of D., E. and B. Each reporter is a mixture of A. and B. (20:1). (B) A Luciferase activity-based array was used in order to identify those signaling pathways that were responsive to overexpression of TCF21. Graphs are plotted as mean ± SE relative to luciferase activity in LV-control cells from three independent experiments; (C) images for TCF21, JNK1, JNK2, p-JNK1, p-JNK2, and β-actin expressions in cells by Western blotting; (D) bands intensities were quantified by Image J software. Graphs are plotted as mean ± SE from three independent experiments. ** p < 0.01.

4. MAPK/JNK Signaling and Lipid Droplets Accumulation Are Inhibited by SP600125 in a Dose-Dependent Manner

To investigate the role of MAPK/JNK signaling in chicken adipogenesis, ICP cells were treated with JNK inhibitor SP600125 at the concentrations of 0, 2.5, 5, and 10 μM, respectively. We found that the protein level of p-JNK (Figure 2A) and accumulation of lipid droplet were reduced by SP600125 in a dose-dependent manner. Additionally, the accumulation of lipid droplets in ICP cells was remarkably decreased by SP600125 at the concentration of 10 μM (Figure 2B). Therefore, SP600125 at the concentration of 10 μM was used in the following experiment.MAPK/JNK signaling and lipid droplets accumulation were inhibited by SP600125 in a dose-dependent manner. At 24 h post-induction of differentiation, ICP cells were then incubated for an additional 24 h in differentiation medium containing 0μM, 2.5μM, 5μM or 10μM SP600125. (A) Images for JNK1, JNK2, p-JNK1, p-JNK2, and β-actin expressions in cells treated with different concentrations of SP600126 by western blotting (representative of three independent experiments). Then the bands intensities were quantified by Image J software. Graphs are plotted as mean ± SE from three independent experiments. Different uppercase letters above columns denote significant differences; (B) Images for oil-red O staining of lipid droplets in preadipocytes treated with different concentrations of SP600125 (representative of three independent experiments). Then oil-red O dye was extracted from the cells treated with different concentrations of SP600125 in order to quantify staining intensity. Graphs are plotted as mean ± SE from three independent experiments. Different uppercase letters above columns denote significant differences.

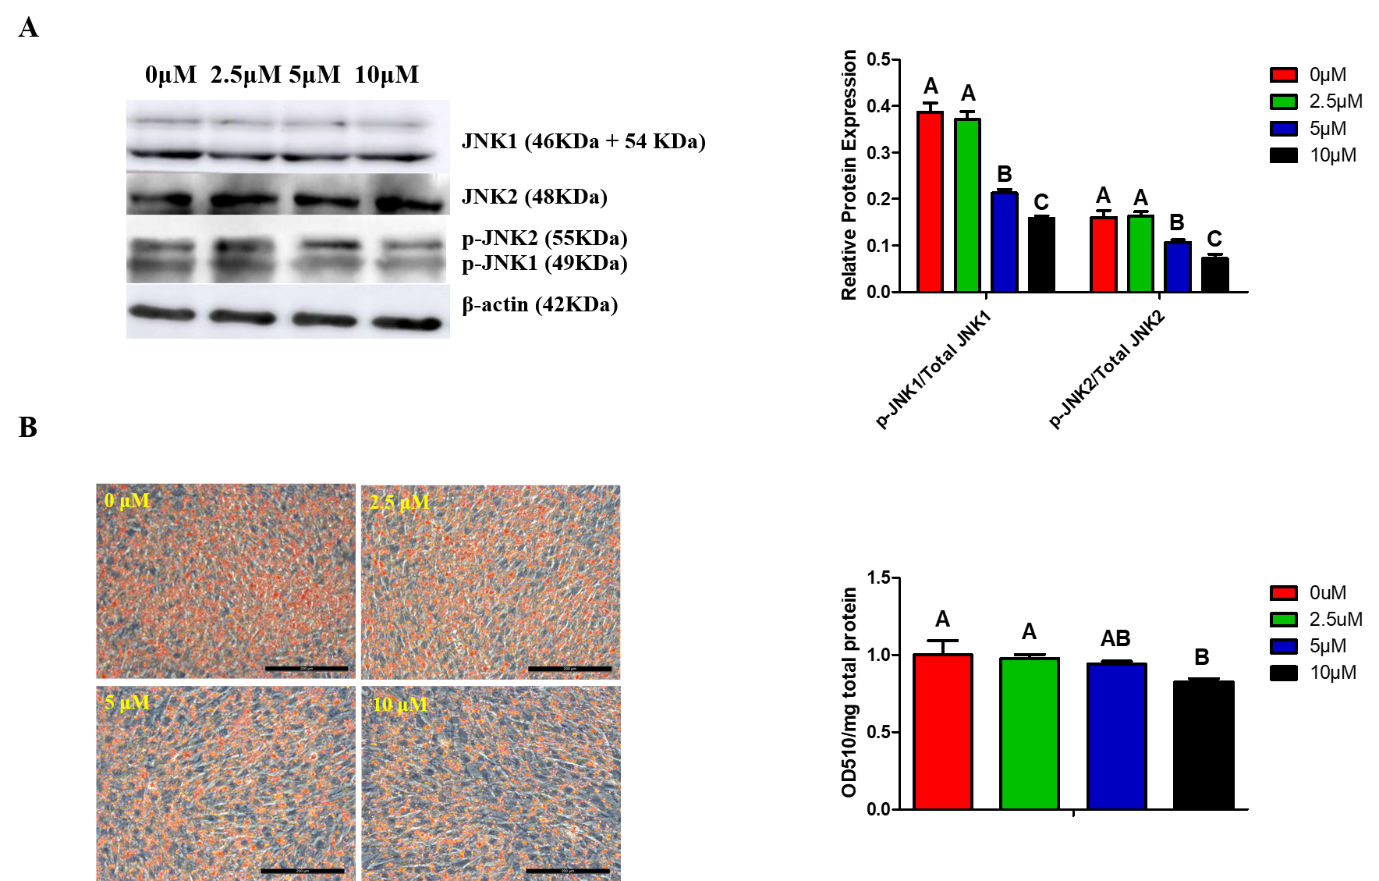
Figure 2. MAPK/JNK signaling and lipid droplets accumulation were inhibited by SP600125 in a dose-dependent manner. At 24 h post-induction of differentiation, ICP cells were then incubated for an additional 24 h in differentiation medium containing 0, 2.5, 5, or 10 μM SP600125. (A) Images for JNK1, JNK2, p-JNK1, p-JNK2, and β-actin expressions in cells treated with different concentrations of SP600126 by Western blotting (representative of three independent experiments). Then, the bands intensities were quantified by Image J software. Graphs are plotted as mean ± SE from three independent experiments. Different uppercase letters above columns denote significant differences; (B) images for oil-red O staining of lipid droplets in preadipocytes treated with different concentrations of SP600125 (representative of three independent experiments). Then, oil-red O dye was extracted from the cells treated with different concentrations of SP600125 in order to quantify staining intensity. Graphs are plotted as mean ± SE from three independent experiments. Different uppercase letters above columns denote significant differences.

5. Inhibition of MAPK/JNK Signaling Attenuates TCF21-Mediated Promotion of Preadipocyte Differentiation

Finally, we performed rescue experiment using LV-control and LV-TCF21 to explore whether MAPK/JNK signaling mediated the impact of TCF21 on preadipocyte differentiation. Although LV-control was derived from ICP, it was not the same as ICP due to lentivirus infection. Therefore, we examined whether SP600125 at the concentration of 10 μM was appropriate to treat LV-control cells in the rescue experiment. We found 10 μM SP600125 was also sufficient to suppress MAPK/JNK signaling and preadipocytes differentiation in LV-control cells (TCF21 (−) SP600125 (−) group vs. TCF21 (−) SP600125 (+) group in Figure 3). The results of TCF21 (+) SP600125 (−) group compared with TCF21 (−) SP600125 (−) group in Figure 3 showed that TCF21 promoted preadipocyte differentiation, as evidenced by increased lipid droplets accumulation and expressions of pro-adipogenic genes. The results of TCF21 (+) SP600125 (−) group compared with TCF21 (+) SP600125 (+) group in Figure 3 showed that inhibition of MAPK/JNK signaling attenuated the promoting effect of overexpression TCF21 on preadipocyte differentiation. The results of TCF21 (−) SP600125 (−) group compared with TCF21 (+) SP600125 (+) group in Figure 3 showed that the inhibition of MAPK/JNK signaling by SP600125 could not completely neutralize the promoting effect of overexpression TCF21 on preadipocyte differentiation.Inhibition of MAPK/JNK signaling attenuates TCF21-mediated enhancement of preadipocyte differentiation. At 24 h post-induction of differentiation, LV-TCF21 and LV-control preadipocytes were then incubated for an additional 24 h in differentiation medium containing either 0μM or 10μM SP600125. (A) Images for JNK1, JNK2, p-JNK1, p-JNK2, and β-actin expressions in LV-control or LV-TCF21 cells treated with 0μM or 10μM SP600126 by western blotting (representative of three independent experiments). Then the bands intensities were quantified by Image J software. Graphs are plotted as mean ± SE from three independent experiments. NS, no significance, * P < 0.05, ** P < 0.01; (B) Images for oil-red O staining of lipid droplets in differentiated LV-control or LV-TCF21 preadipocytes treated with 0μM or 10μM SP600125 (representative of three independent experiments). Then oil-red O dye was extracted from the cells in order to quantify staining intensity. Graphs are plotted as mean ± SE from three independent experiments relative to staining intensity of LV-control treated with 0μM SP600125. * P < 0.05, ** P < 0.01; (C) Expressions of pro-adipogenic genes in differentiated LV-control or LV-TCF21 preadipocytes treated with 0μM or 10μM SP600125 by real-time PCR. Graphs are plotted as mean ± SE from three independent experiments relative to the gene expression in LV-control treated with 0μM SP600125. NS, no significance, * P < 0.05, ** P < 0.01.

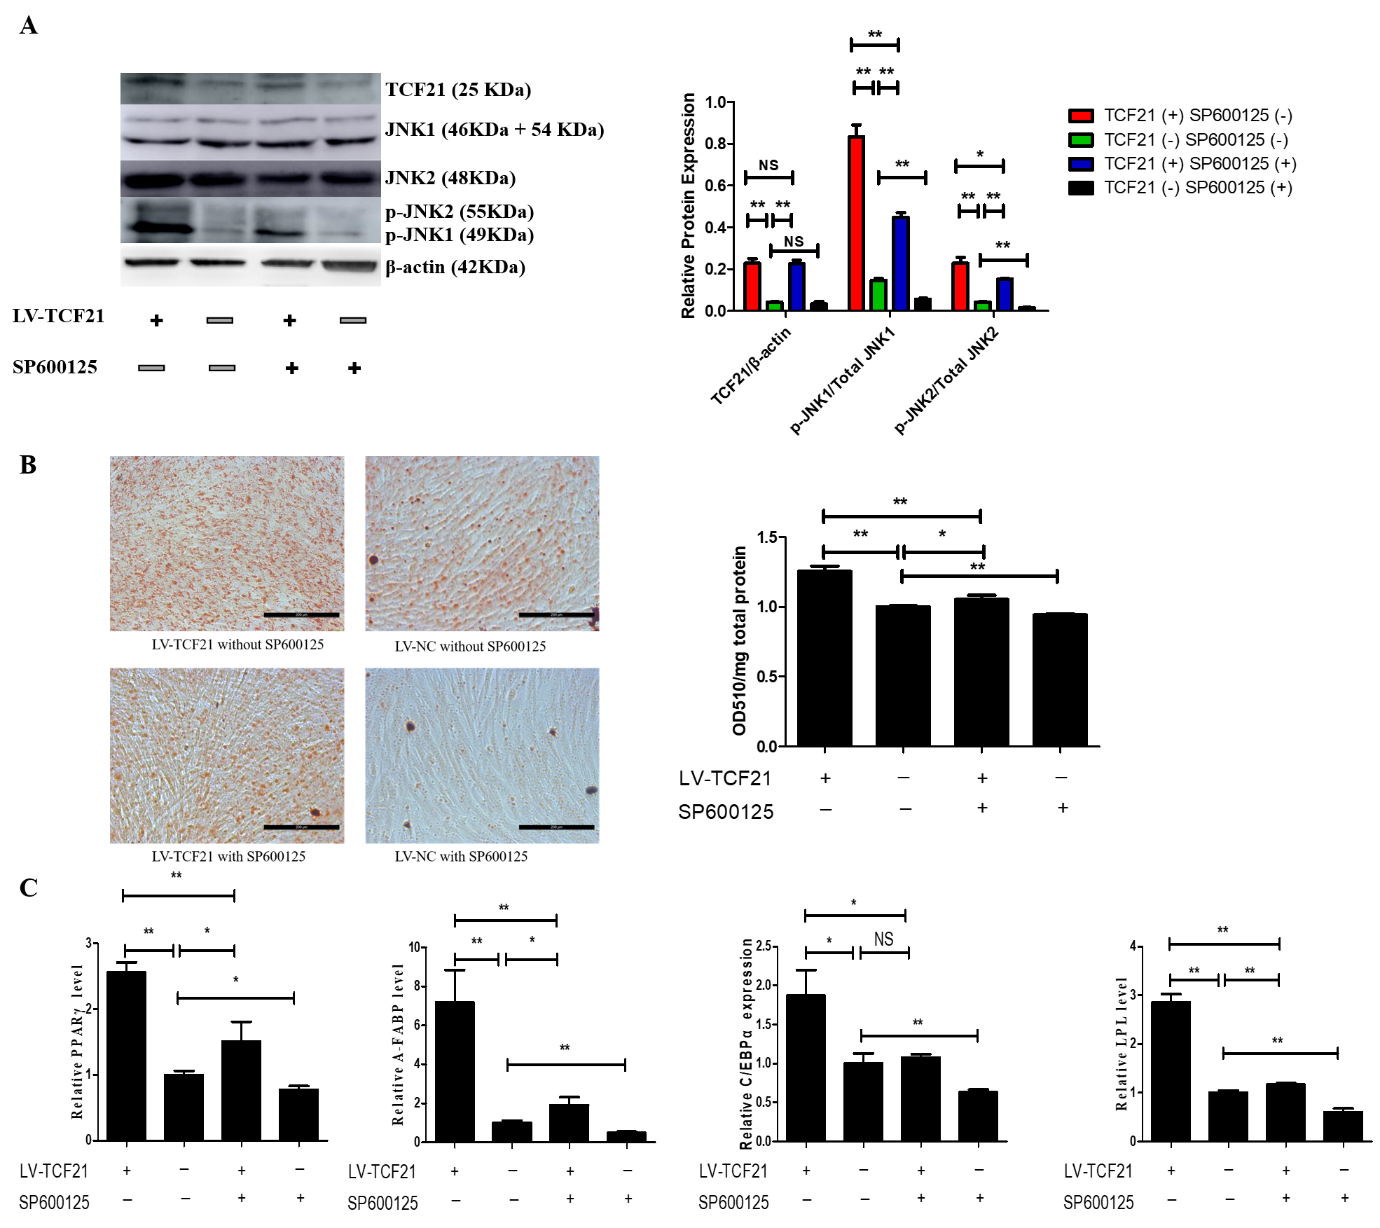
Figure 3. Inhibition of MAPK/JNK signaling attenuates TCF21-mediated enhancement of preadipocyte differentiation. At 24 h post-induction of differentiation, LV-TCF21 and LV-control preadipocytes were then incubated for an additional 24 h in differentiation medium containing either 0 or 10 μM SP600125. (A) Images for JNK1, JNK2, p-JNK1, p-JNK2, and β-actin expressions in LV-control or LV-TCF21 cells treated with 0 or 10 μM SP600126 by Western blotting (representative of three independent experiments). Then, the bands intensities were quantified by Image J software. Graphs are plotted as mean ± SE from three independent experiments. NS, no significance, * p < 0.05, ** p < 0.01; (B) images for oil-red O staining of lipid droplets in differentiated LV-control or LV-TCF21 preadipocytes treated with 0 or 10 μM SP600125 (representative of three independent experiments). Then, oil-red O dye was extracted from the cells in order to quantify staining intensity. Graphs are plotted as mean ± SE from three independent experiments relative to staining intensity of LV-control treated with 0 μM SP600125. * p < 0.05, ** p < 0.01; (C) expressions of pro-adipogenic genes in differentiated LV-control or LV-TCF21 preadipocytes treated with 0 or 10 μM SP600125 by real-time PCR. Graphs are plotted as mean ± SE from three independent experiments relative to the gene expression in LV-control treated with 0 μM SP600125. NS, no significance, * p < 0.05, ** p < 0.01.

References

  1. Mallard, J.; Douaire, M. Strategies of selection for leanness in meat production. In Leanness in Domestic Birds: Genetic, Metabolic and Hormonal Aspects; Leclerq, B., Whitehead, C.C., Eds.; Elsevier: Amsterdam, The Netherlands, 1988; pp. 3–23.
  2. Julibert, A.; Bibiloni, M.D.M.; Mateos, D.; Angullo, E.; Tur, J.A. Dietary fat intake and metabolic syndrome in older adults. Nutrients 2019, 11, 1901.
  3. Vincent, M.J.; Allen, B.; Palacios, O.M.; Haber, L.T.; Maki, K.C. Meta-regression analysis of the effects of dietary cholesterol intake on LDL and HDL cholesterol. Am. J. Clin. Nutr. 2019, 109, 7–16.
  4. Wu, G.Q.; Deng, X.M.; Li, J.Y.; Li, N.; Yang, N. A potential molecular marker for selection against abdominal fatness in chickens. Poult. Sci. 2006, 85, 1896–1899.
  5. Sahraei, M. Feed restriction in broiler chickens production: A review. Glob. Vet. 2012, 8, 449–458.
  6. Julian, R.J. Production and growth related disorders and other metabolic diseases of poultry—A review. Vet. J. 2015, 169, 350–369.
  7. Chen, C.Y.; Huang, Y.F.; Ko, Y.J.; Liu, Y.J.; Chen, Y.H.; Walzem, R.L.; Chen, S.E. Obesity-associated cardiac pathogenesis in broiler breeder hens: Development of metabolic cardiomyopathy. Poult. Sci. 2017, 96, 2438–2446.
  8. Chen, C.Y.; Lin, H.Y.; Chen, Y.W.; Ko, Y.J.; Liu, Y.J.; Chen, Y.H.; Walzem, R.L.; Chen, S.E. Obesity-associated cardiac pathogenesis in broiler breeder hens: Pathological adaption of cardiac hypertrophy. Poult. Sci. 2017, 96, 2428–2437.
  9. Zhang, X.Y.; Wu, M.Q.; Wang, S.Z.; Zhang, H.; Du, Z.Q.; Li, Y.M.; Cao, Z.P.; Luan, P.; Leng, L.; Li, H. Genetic selection on abdominal fat content alters the reproductive performance of broilers. Animal 2018, 12, 1232–1241.
  10. Tang, Q.Q.; Lane, M.D. Adipogenesis: From stem cell to adipocyte. Annu. Rev. Biochem. 2012, 81, 715–736.
  11. Schwalie, P.C.; Dong, H.; Zachara, M.; Russeil, J.; Alpern, D.; Akchiche, N.; Caprara, C.; Sun, W.; Schlaudraff, K.; Soldati, G.; et al. A stromal cell population that inhibits adipogenesis in mammalian fat depots. Nature 2018, 559, 103–108.
  12. Rosen, E.D.; Macdougald, O.A. Adipocyte differentiation from inside out. Nat. Rev. Mol. Cell Biol. 2006, 7, 885–896.
  13. Cristancho, A.G.; Lazar, M.A. Forming functional fat: A growing understanding of adipocyte differentiation. Nat. Rev. Mol. Cell Biol. 2011, 12, 722–734.
  14. Ali, A.T.; Hochfeld, W.E.; Myburgh, R.; Pepper, M.S. Adipocyte and adipogenesis. Eur. J. Cell Biol. 2013, 92, 229–236.
  15. Zhang, X.; Cheng, B.; Liu, C.; Du, Z.; Zhang, H.; Wang, N.; Wu, M.; Li, Y.; Cao, Z.; Li, H. A novel regulator of preadipocyte differentiation, transcription factor TCF21, functions partially through promoting LPL expression. Front. Physiol. 2019, 10, 458.
More
Information
Contributor MDPI registered users' name will be linked to their SciProfiles pages. To register with us, please refer to https://encyclopedia.pub/register :
View Times: 395
Revisions: 3 times (View History)
Update Date: 21 Dec 2021
1000/1000
Video Production Service