Your browser does not fully support modern features. Please upgrade for a smoother experience.
Submitted Successfully!
 +1 credit
Thank you for your contribution! You can also upload a video entry or images related to this topic.
For video creation, please contact our Academic Video Service.
| Version | Summary | Created by | Modification | Content Size | Created at | Operation |
|---|---|---|---|---|---|---|
| 1 | Seong-Tshool Hong | + 2492 word(s) | 2492 | 2021-12-17 04:38:33 | | | |
| 2 | Rita Xu | Meta information modification | 2492 | 2021-12-20 02:51:28 | | |
Video Upload Options
We provide professional Academic Video Service to translate complex research into visually appealing presentations. Would you like to try it?
Cite
If you have any further questions, please contact Encyclopedia Editorial Office.
Hong, S. Host Factors Affect the Gut Microbiome. Encyclopedia. Available online: https://encyclopedia.pub/entry/17283 (accessed on 25 June 2026).
Hong S. Host Factors Affect the Gut Microbiome. Encyclopedia. Available at: https://encyclopedia.pub/entry/17283. Accessed June 25, 2026.
Hong, Seong-Tshool. "Host Factors Affect the Gut Microbiome" Encyclopedia, https://encyclopedia.pub/entry/17283 (accessed June 25, 2026).
Hong, S. (2021, December 18). Host Factors Affect the Gut Microbiome. In Encyclopedia. https://encyclopedia.pub/entry/17283
Hong, Seong-Tshool. "Host Factors Affect the Gut Microbiome." Encyclopedia. Web. 18 December, 2021.
Copy Citation
Living organisms in nature exist as communities of various species, interacting closely with each other. Microbial organisms are also present as heterogeneous populations. Microbial organisms frequently appear as a dense mixture of various species to interact with each other in nature.
diet shift
exercise
gut microbiome
host factors
1. Introduction
Considering the heterogeneous presence of microbial organisms, it would be reasonable to ponder that the emergence of the first primitive multicellular organism could be accompanied by the gut microbiome at its beginning. Therefore, the fundamentals of host–gut microbiome interactions and their evolutionary consequences would open a new horizon for understanding animals [1][2].
The gut microbiome has been coevolving with humans throughout its evolutionary history [3][4][5][6]. Recent studies have shown that the gut microbiome plays significant determinant roles in almost all phenotypes of animals, including diseases, as much as the genomes of their hosts [5][6][7][8][9]. The stability and dynamics of the gut microbiome have not only local but also systemic effects that determine the phenotypes and diseases of the host [10]. As the genes of an animal are a result of eons of natural selection, the gut microbiome of an organism is also the result of long natural selection to modulate the phenotypes of its host. Recent works suggest that the gut microbiome is a surprising factor that determines the phenotypes of mammals, similar to their own genes [5][6][7][8][9].
Given the intimate and complex interactions between the gut microbiome and its host during evolutionary history, host factors could dictate the composition of the gut microbiome. However, despite a possible significant role of host factors in determining the composition of the gut microbiome, the contemporary prevailing opinion considers diet as the main determinant factor for the composition of the gut microbiome [5][6][11]. It has been well documented that dietary shifts affect the composition of the gut microbiome [11][12][13][14]. The opinion that the composition of the gut microbiome is mainly determined by diet was supported by research showing that the gut microbiomes of animals with similar dietary niches tend to contain similar intestinal microbes [15][16]. Although the effect of diet on the composition of the gut microbiome is clear, recent research has suggested that host factors may also play a role in determining the composition of the gut microbiome [17][18][19]. These results collectively propose that the composition of the gut microbiome is determined by both diet and host factors. However, it is unclear which factor plays a more important role.
Contrary to expectations, a recent study showed that the number of dietary transitions within an evolutionary lineage did not influence rates of microbiome divergence, but, instead, the most dramatic changes in the gut microbiome were associated with the physiological changes of the species during the evolutionary process [20]. This work strongly suggests that host factors could impact the composition of the gut microbiome as much as diet or even more. The effect of host factors on the composition of the gut microbiome was further validated by a recent report that the change in host physiology during evolutionary processes outweighs dietary change in structuring the gut microbiomes of primates [21]. Based on these two works suggesting that the change of host factors affects the composition of the gut microbiome more than dietary change during the emergence of a species during evolution, the significance of host factors in a human individual would be a very interesting question. However, the significance of host factors affecting the gut microbiome has not been investigated.
2. Exercise Modified the Composition of the Gut Microbiome More Significantly than Diet Shift
To investigate the role of host factors and diets in the composition of the gut microbiome, we first recruited 30~50-year-old volunteers depending on a meat-containing diet. The 75 volunteers were divided into three groups: one group shifting their diet from a meat diet to a vegetarian diet (the DS group), the second group adopting a 30 min physical exercise in the form of a guided aerobic exercise in a fitness center three times per week without changing their original diets (the EX group), and the control continuing their lifestyle (the Ctrl group). The fecal samples from each group were collected for metagenome analysis by the 16S rRNA sequencing method (DS group, n = 14; EX group, n = 13; Ctrl group n = 14). Sequencing of the V3-V4 sites of the 16Sr rRNA genes of each GI content and feces in each group generated 1137 OTUs by matching with the EzTaxon-e database (http://eztaxon-e.ezbiocloud.net/ Accessed on 10 July 2021) after removal of low-quality sequences or chimeras.
The taxonomically classified OTUs at the phylum level visualized grossly that the gut microbiome was modified by both exercise and diet shift. A maximum-likelihood phylogenetic tree comprising all of the taxa showed that DS increased the abundance of Actinobacteria and decreased the abundance of Bacteroidetes, while EX increased the abundance of Firmicutes and decreased Actinobacteria (Figure 1A,B).
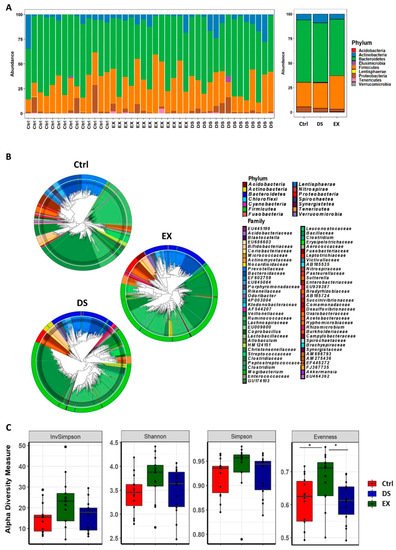
Figure 1. Changes in the composition of the gut microbiome at the phylum level after diet shift or exercise. (A) The relative compositional changes in the gut microbiome at the phylum level. (B) Maximum-likelihood phylogenetic tree comprising all of the taxa of the gut microbiome in the Ctrl, EX, and DS groups. The rings of the circular dendrogram represent the phylum level, and the corresponding family is depicted in the inner layer. (C) α-diversity indexes of the gut microbiome in the Ctrl, EX, and DS groups. α-Diversity values are indicated as the median ± standard deviation. * p value < 0.05 was considered as significant. Ctrl, EX, and DS represent the control, exercise, and diet shift groups, respectively.
The statistical analysis of the mean species diversity by using α-diversity measurements validated that both EX and DS affected the gut microbiome. The α-diversity measurements by the InvSimpson, Shannon, Simpson, and Evenness methods indicated that both EX and DS affected the microbiome, causing it to become more diverse, except for the Evenness index for DS (Figure 1C). Interestingly, all of the α-diversity indices showed that EX affected the gut microbiome more significantly than DS (Figure 1C), meaning that host factors affected the gut microbiome more significantly than diet in determining the composition of the gut microbiome.
3. Exercise and Diet Shift Modified the Gut Microbiome in Two Different Directions
Since both EX and DS affected the composition of the gut microbiome by increasing its diversity, as shown in Figure 1C, an important question would be the direction of modification by exercise and diet shift. The gross visualization of all of the normalized OTUs at the species level is shown as a heatmap based on the Bray–Curtis distance matrix in Figure 2A. As shown in Figure 2A, the compositions of both gut microbiomes of EX and DS were not only different from each other but also from the control, meaning that EX and DS modified the gut microbiome in two different directions. The hierarchical clustering analysis showed that the gut microbiome of DS was more closely related to the control than EX, although the gut microbiomes of both groups changed. This result is in good agreement with the finding that EX modified the composition of the gut microbiome more significantly than the diet shift, as shown in Figure 1.
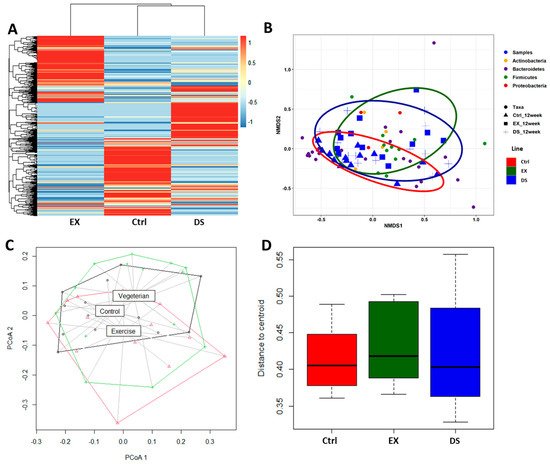
Figure 2. β-diversity comparison of the gut microbiome of the Ctrl, EX, and DS groups. (A) Heatmap of the microbial composition for the Ctrl, EX, and DS groups based on the Bray–Curtis distance matrix calculated from normalized OTU values at the species level. (B) Nonmetric multidimensional scaling (NMDS) plots showing the difference in the gut microbiome in the Ctrl, EX, and DS groups based on Bray–Curtis distances by using OTUs. (C) Principal coordinate analysis (PCoA) based on the unweighted UniFrac metric of the gut microbiome in the Ctrl, EX, and DS groups. (D) Distance of centroid for the Ctrl, EX, and DS groups. The Ctrl, EX, and DS represent the control, exercise, and diet shift groups, respectively.
A nonmetric multidimensional scaling (NMDS) ordination plot further validated that the gut microbiome compositions of the three groups were quite different from each other (Figure 2B). In accordance with the hierarchical clustering analysis result (Figure 2A), the NMDS ordination plot showed that the gut microbiome of DS was more closely related to the control than EX. Principal coordinate analysis (PCoA) based on the unweighted UniFrac metric also generated similar results (Figure 2C,D). The PCoA plot of Figure 2C shows that the gut microbiomes of the three groups were different from each other, although the gut microbiome of DS was more closely related to the control than EX (ADONIS p value 0.013). Measurement of the distance of the centroid on the PCoA plot further validated that the composition of the gut microbiome was modified more significantly by EX than DS (Figure 2D).
4. Co-Occurrence Network Analysis Showed That Exercise Gave Stronger Selective Pressure to the Gut Microbiome than Diet Shift
To explore the direction and degree of the change in the intestinal microbes constituting gut microbiomes, a bacterial community network analysis was performed for each group (Figure 3). All five p values for each method (Spearman and Pearson correlation coefficients, the Mutual Information Score, and the Bray–Curtis and Kullback–Leibler Dissimilarity) were calculated and corrected separately. If at least two of the five metrics’ adjusted p value suggested significant (p.adj < 0.05) co-abundance between two OTUs relationship, then co-abundance was considered a strong connection. Only strong connections between OTUs appearing in more than three samples were investigated. The number of nodes and edges increased by both EX and DS (Figure 3). The indices of the community networks between each group were quite similar, except indices related to the grouping of the OTUs constituting the gut microbiome, such as nodes, edges, and modules.
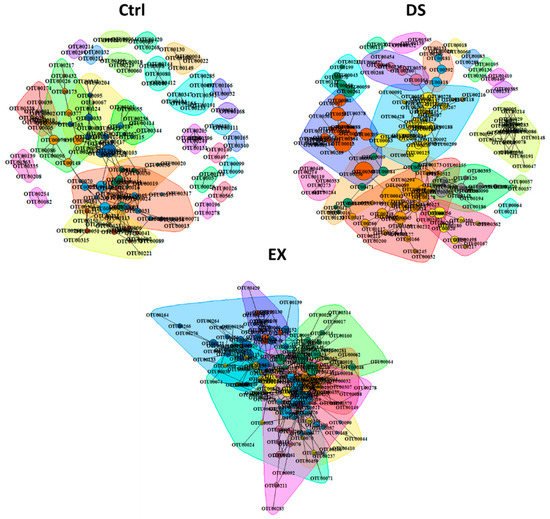
Figure 3. Co-occurrence network analysis by the ReBoot algorithm for the Ctrl, EX, and DS groups. Color-coded network graphs represent the co-occurrence and mutual exclusion interactions among OTUs. White numbers within nodes correspond to numbering in the legend. Transparent shapes represent network communities determined by the Louvain modularity algorithm. Black numbering corresponds to the numbering given to distinguish communities within each network. The Ctrl, EX, and DS represent the control, exercise, and diet shift groups, respectively.
The total numbers of OTUs present in the gut microbiome of each experimental group were n = 793, n = 705, and n = 847 in Ctrl, EX, and DS, respectively. Although the total numbers of OTUs in each group were similar, the numbers of OTUs connected with other OTUs by a relationship (nodes) were increased in both the gut microbiomes of EX and DS. Because nodes were connected more with each other in DS and EX, the modules in DS and EX were decreased: 28 in control, 8 in EX, and 20 in DS (Figure 3). This result suggests that similar kinds of intestinal microbes were increased and unrelated kinds were diminished at the same time in EX and DS, which means that there were selective pressures in both EX and DS to lead the composition of the gut microbiome in a certain direction.
5. The Abundance of Dialister Succinatiphilus Was Upregulated by Exercise, and the Abundances of Bacteroides Fragilis, Phascolarctobacterium Faecium, and Megasphaera Elsdenii Were Downregulated by Both Exercise and Diet Shift
Since all of the OTUs in this work were classified into nine phyla, we explored the change in the relative abundance of the phyla by DESeq2 [22]. Unsupervised hierarchical clustering of the nine phyla by using DESeq2 showed that EX upregulated the abundances of Tenericutes and Verrucomicrobia and decreased the abundances of Proteobacteria and Lentishaerae (Figure 4). DS did not affect the composition of the gut microbiome as much as EX and was only moderately affected, so the decrease in Proteobacteria was not meaningful (Figure 4). The dramatic change in the gut microbiome by EX became more evident when comparing EX to DS. It was obvious that EX upregulated the abundances of Tenericutes, Verrucomicrobia, and Acidobacteria, while the abundance of Lentishaerae was decreased (Figure 4).
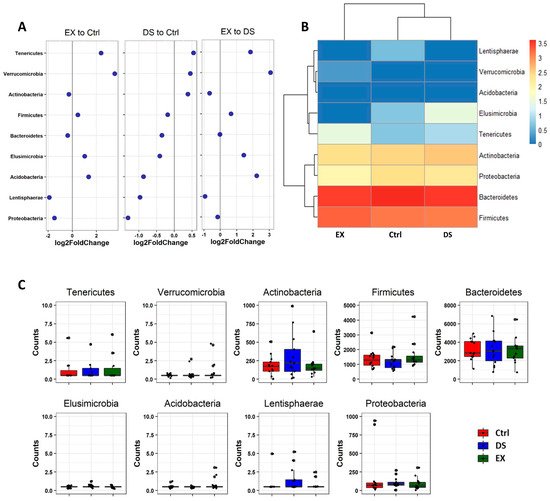
Figure 4. Differential abundance analysis of phylum changes between EX and Ctrl, DS and Ctrl, and EX and DS. (A) Log2-fold change in abundance of the phyla constituting the gut microbiome of three experimental groups analyzed by DESeq2 differential abundance analysis. (B) Heatmap of nine phyla constituting the gut microbiome of three experimental groups. (C) The normalized abundances of nine phyla identified by differential abundance analyses. Boxplots represent normalized count abundances of individual phyla in each group. Ctrl, EX, and DS represent the control, exercise, and diet shift groups, respectively.
Although more serious disturbance of the gut microbiome by EX than DS could be distinguished at the family level, the difference was more evident at the species level (Figure 5, Figure 6 and Figure 7). Most of the species were unknown species in the figures. However, downregulation of the abundances of Bacteroides fragilis, Phascolarctobacterium faecium, and Megasphaera elsdenii and upregulation of Dialister succinatiphilus were noticed by EX (Figure 5). Interestingly, the abundances of Bacteroides fragilis, Phascolarctobacterium faecium, and Megasphaera elsdenii were also downregulated by DS, as in the case of EX (Figure 6). All of the upregulated bacteria were not taxonomically classified and were unknown bacteria in the DS group. The comparison of EX to DS showed that downregulation of Veillonella dispar and upregulation of Dialister succinatiphilus were the most noticeable (Figure 7).
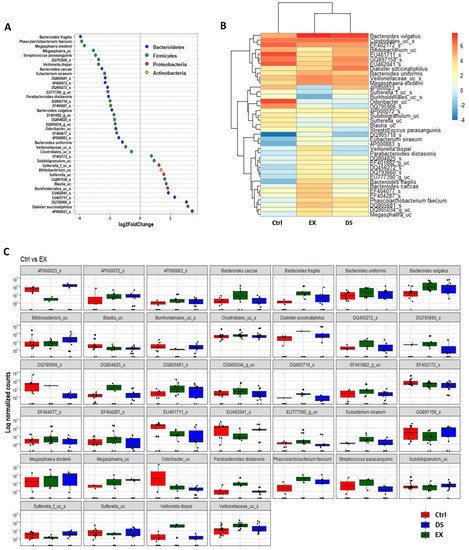
Figure 5. The key taxa changes between Ctrl and EX by differential abundance analysis. (A) Log2-fold change in abundance of most abundantly present species in the gut microbiome of the Ctrl and EX groups analyzed by DESeq2 differential abundance analysis. Each point represents a species comparison between two experimental groups. (B) Heatmap of most abundantly present species in the Ctrl and EX groups. (C) Normalized abundances of 39 significantly different bacterial species of interest that were identified from differential abundance analyses. Boxplots represent normalized count abundances of individual species in each group. p value < 0.05 was considered as significant. Ctrl and EX represent the control and exercise groups, respectively.
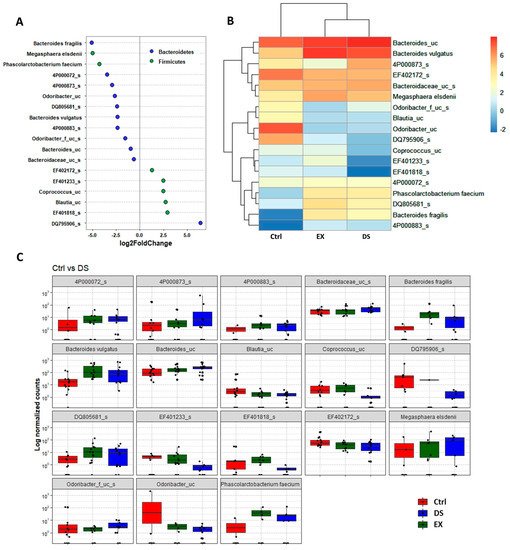
Figure 6. The key taxa changes between Ctrl and DS by differential abundance analysis. (A) Log2-fold change in abundance of most abundantly present species in the gut microbiome of the Ctrl and DS groups analyzed by DESeq2 differential abundance analysis. Each point represents a species comparison between two experimental groups. (B) Heatmap of most abundantly present species in the Ctrl and DS groups. (C) Normalized abundances of 18 significantly different bacterial species of interest that were identified from differential abundance analyses. Boxplots represent normalized count abundances of individual species in each group. p value < 0.05 was considered as significant. Ctrl and DS represent the control and exercise groups, respectively.
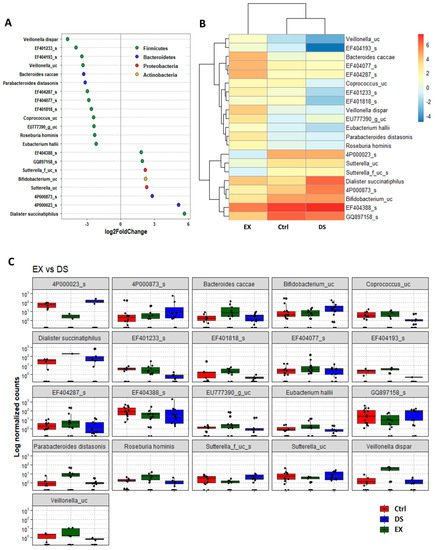
Figure 7. The key taxa changes between EX and DS by differential abundance analysis. (A) Log2-fold change in abundance of most abundantly present species in the gut microbiome of the EX and DS groups analyzed by DESeq2 differential abundance analysis. Each point represents a species comparison between two experimental groups. (B) Heatmap of most abundantly present species in the EX and DS groups. (C) Normalized abundances of 18 significantly different bacterial species of interest that were identified from differential abundance analyses. Boxplots represent normalized count abundances of individual species in each group. p value < 0.05 was considered significant. The EX and DS represent the control and exercise groups, respectively.
References
- Davenport, E.R.; Sanders, J.G.; Song, S.J.; Amato, K.R.; Clark, A.G.; Knight, R. The human microbiome in evolution. BMC Biol. 2017, 15, 127.
- Groussin, M.; Mazel, F.; Alm, E.J. Co-evolution and Co-speciation of Host-Gut Bacteria Systems. Cell Host Microbe 2020, 28, 12–22.
- Chen, X.; D’Souza, R.; Hong, S.T. The role of gut microbiota in the gut-brain axis: Current challenges and perspectives. Protein Cell 2013, 4, 403–414.
- Chung, H.J.; Nguyen, T.T.B.; Kim, H.J.; Hong, S.T. Gut Microbiota as a Missing Link Between Nutrients and Traits of Human. Front. Microbiol. 2018, 9, 1510.
- Nguyen, T.T.B.; Chung, H.J.; Kim, H.J.; Hong, S.T. Establishment of an ideal gut microbiota to boost healthy growth of neonates. Crit. Rev. Microbiol. 2019, 45, 118–129.
- Nguyen, T.T.B.; Jin, Y.Y.; Chung, H.J.; Hong, S.T. Pharmabiotics as an Emerging Medication for Metabolic Syndrome and Its Related Diseases. Molecules 2017, 22, 1795.
- Clemente, J.C.; Ursell, L.K.; Parfrey, L.W.; Knight, R. The impact of the gut microbiota on human health: An integrative view. Cell 2012, 148, 1258–1270.
- Rinninella, E.; Raoul, P.; Cintoni, M.; Franceschi, F.; Miggiano, G.A.D.; Gasbarrini, A.; Mele, M.C. What is the Healthy Gut Microbiota Composition? A Changing Ecosystem across Age, Environment, Diet, and Diseases. Microorganisms 2019, 7, 14.
- Shreiner, A.B.; Kao, J.Y.; Young, V.B. The gut microbiome in health and in disease. Curr. Opin. Gastroenterol. 2015, 31, 69–75.
- Ortega-Santos, C.; Tucker, W.; Brown, C.; Laubitz, D.; Barberan, A.; Gaesser, G.; Angadi, S.; Whisner, C. The Impact of Exercise on Gut Microbiota Diversity during a Period of Increased Caloric Intake Characteristic of the Winter Holiday Period (P21-029-19). Curr. Dev. Nutr. 2019, 3 (Suppl. 1), nzz041.P21-029-19.
- Jackson, M.; Jewell, D. Fiber Type Determines Feline Gut Microbiome Metabolism and Bioactive Lipid Profiles in Feces (P20-034-19). Curr. Dev. Nutr. 2019, 3, nzz040.P020-034-019.
- Kolodziejczyk, A.A.; Zheng, D.; Elinav, E. Diet–microbiota interactions and personalized nutrition. Nat. Rev. Microbiol. 2019, 17, 742–753.
- Singh, R.K.; Chang, H.-W.; Yan, D.; Lee, K.M.; Ucmak, D.; Wong, K.; Abrouk, M.; Farahnik, B.; Nakamura, M.; Zhu, T.H. Influence of diet on the gut microbiome and implications for human health. J. Transl. Med. 2017, 15, 73.
- Rajoka, M.S.R.; Shi, J.; Mehwish, H.M.; Zhu, J.; Li, Q.; Shao, D.; Huang, Q.; Yang, H. Interaction between diet composition and gut microbiota and its impact on gastrointestinal tract health. Food Sci. Hum. Wellness 2017, 6, 121–130.
- De Angelis, M.; Ferrocino, I.; Calabrese, F.M.; De Filippis, F.; Cavallo, N.; Siragusa, S.; Rampelli, S.; Di Cagno, R.; Rantsiou, K.; Vannini, L. Diet influences the functions of the human intestinal microbiome. Sci. Rep. 2020, 10, 4247.
- Leeming, E.R.; Johnson, A.J.; Spector, T.D.; Le Roy, C.I. Effect of diet on the gut microbiota: Rethinking intervention duration. Nutrients 2019, 11, 2862.
- Hasan, N.; Yang, H. Factors affecting the composition of the gut microbiota, and its modulation. PeerJ 2019, 7, e7502.
- Johnson, K.V.-A. Gut microbiome composition and diversity are related to human personality traits. Hum. Microbiome J. 2020, 15, 100069.
- Dorelli, B.; Gallè, F.; De Vito, C.; Duranti, G.; Iachini, M.; Zaccarin, M.; Preziosi Standoli, J.; Ceci, R.; Romano, F.; Liguori, G. Can Physical Activity Influence Human Gut Microbiota Composition Independently of Diet? A Systematic Review. Nutrients 2021, 13, 1890.
- Nishida, A.H.; Ochman, H. Rates of gut microbiome divergence in mammals. Mol. Ecol. 2018, 27, 1884–1897.
- Amato, K.R.; Sanders, J.G.; Song, S.J.; Nute, M.; Metcalf, J.L.; Thompson, L.R.; Morton, J.T.; Amir, A.; McKenzie, V.J.; Humphrey, G. Evolutionary trends in host physiology outweigh dietary niche in structuring primate gut microbiomes. ISME J. 2019, 13, 576–587.
- Anders, S.; Huber, W. Differential expression analysis for sequence count data. Nat. Preced. 2010.
More
Information
Subjects:
Microbiology; Medicine, Research & Experimental; Biology
Contributor
MDPI registered users' name will be linked to their SciProfiles pages. To register with us, please refer to https://encyclopedia.pub/register
:
View Times:
681
Revisions:
2 times
(View History)
Update Date:
29 Mar 2022
Table of Contents


Notice
You are not a member of the advisory board for this topic. If you want to update advisory board member profile, please contact office@encyclopedia.pub.
OK
Confirm
Only members of the Encyclopedia advisory board for this topic are allowed to note entries. Would you like to become an advisory board member of the Encyclopedia?
Yes
No
${ textCharacter }/${ maxCharacter }
Submit
Cancel
Back
Comments
${ item }
|
${ item.createdUser.fullName }
${ item.createdAt }
${ item.vote }
${ item.reply }
Delete
${ reply.createdUser.fullName }
${ reply.createdAt }
${ reply.vote }
Delete
There is no reply to this comment~
${ item.replyTextCharacter }/${ item.replyMaxCharacter }
Submit
Cancel
More
No more~
There is no comment~
${ textCharacter }/${ maxCharacter }
Submit
Cancel
${ selectedItem.replyTextCharacter }/${ selectedItem.replyMaxCharacter }
Submit
Cancel
Confirm
Are you sure to Delete?
Yes
No