
| Version | Summary | Created by | Modification | Content Size | Created at | Operation |
|---|---|---|---|---|---|---|
| 1 | Harald Mischak | + 4632 word(s) | 4632 | 2021-12-08 03:06:27 |
Video Upload Options
In recent years, capillary electrophoresis coupled to mass spectrometry (CE-MS) has been increasingly applied in clinical research especially in the context of chronic and age-associated diseases, such as chronic kidney disease, heart failure and cancer. Biomarkers identified using this technique are already used for diagnosis, prognosis and monitoring of these complex diseases, as well as patient stratification in clinical trials. CE-MS allows for a comprehensive assessment of small molecular weight proteins and peptides (<20 kDa) through the combination of the high resolution and reproducibility of CE and the distinct sensitivity of MS, in a high-throughput system. In this study we assessed CE-MS analytical performance with regards to its inter- and intra-day reproducibility, variability and efficiency in peptide detection, along with a characterization of the urinary peptidome content. To this end, CE-MS performance was evaluated based on 72 measurements of a standard urine sample (60 for inter- and 12 for intra-day assessment) analyzed during the second quarter of 2021. Analysis was performed per run, per peptide, as well as at the level of biomarker panels. The obtained datasets showed high correlation between the different runs, low variation of the ten highest average individual log2 signal intensities (coefficient of variation, CV < 10%) and very low variation of biomarker panels applied (CV close to 1%). The findings of the study support the analytical performance of CE-MS, underlining its value for clinical application.
1. Introduction
2. Results
2.1. Detection of Naturally Occurring Peptides in the Standard Urine Sample
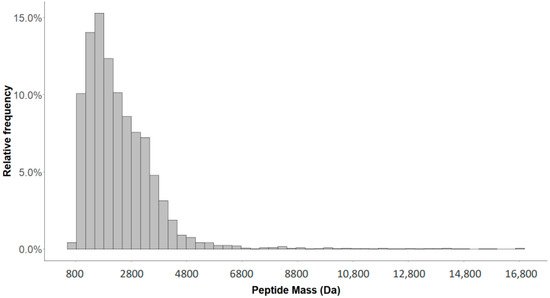
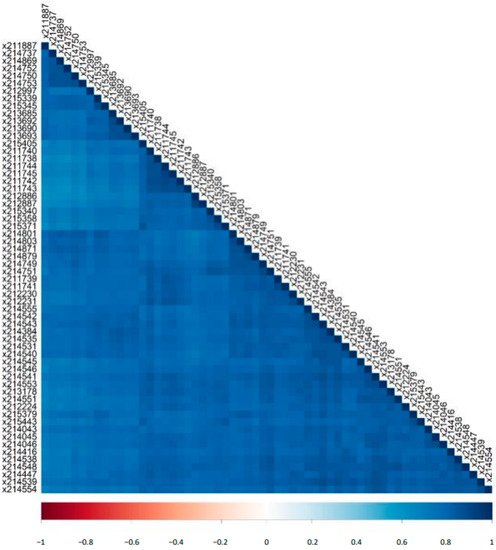
2.2. Variability of Signal Intensities of Individual Peptides
| Inter-Day | Intra-Day | ||||||||
|---|---|---|---|---|---|---|---|---|---|
| Mass [Da] |
CE Time [Min] | Sequence | Gene Symbol | Mean log2 Int | SD | CV [%] |
Mean log2 Int | SD | CV [%] |
| 1754.92 | 31.39 | SGSVIDQSRVLNLGPIT | UMOD | 15.56 | 0.33 | 2.12 | 15.48 | 0.17 | 1.07 |
| 3457.61 | 31.46 | NTGAPGSpGVSGpKGDAGQpGEKGSpGAQGppGAPGPLG | COL3A1 | 15.05 | 0.42 | 2.76 | 15.29 | 0.18 | 1.18 |
| 2248.99 | 26.16 | GGpGSDGKPGppGSQGESGRPGPpG | COL3A1 | 14.94 | 0.20 | 1.33 | 14.83 | 0.14 | 0.98 |
| 1882.80 | 20.24 | DEAGSEADHEGTHSTKRG | FGA | 14.87 | 0.37 | 2.49 | 14.64 | 0.13 | 0.91 |
| 2825.28 | 24.45 | ERGEAGIpGVpGAKGEDGKDGSpGEpGANG | COL3A1 | 14.76 | 0.28 | 1.92 | 14.72 | 0.13 | 0.88 |
| 1250.56 | 28.00 | ApGDRGEpGPPGp | COL1A1 | 14.65 | 0.18 | 1.26 | 14.34 | 0.11 | 0.75 |
| 2169.97 | 26.10 | NSGEpGApGSKGDTGAKGEPGpVG | COL1A1 | 14.61 | 0.21 | 1.46 | 14.45 | 0.16 | 1.10 |
| 2047.92 | 21.93 | NGDDGEAGKpGRpGERGPPGP | COL1A1 | 14.37 | 0.62 | 4.32 | 14.33 | 0.23 | 1.62 |
| 1911.05 | 25.23 | SGSVIDQSRVLNLGPITR | UMOD | 14.34 | 0.82 | 5.75 | 11.29 | 0.18 | 1.61 |
| 3441.61 | 31.36 | DGAPGQKGEMGPAGPTGPRGFpGppGPDGLPGSMGPP | COL4A1 | 14.04 | 0.33 | 2.36 | 14.49 | 0.23 | 1.57 |
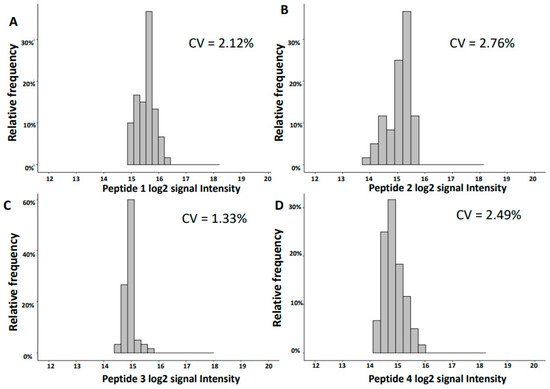
2.3. Variability of Biomarker Panels
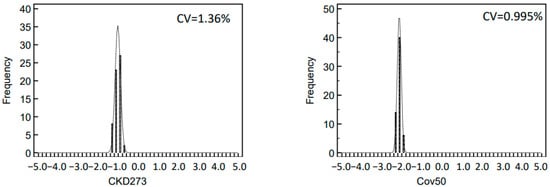
2.4. Characterization of the Urinary Peptidome Representative of a Healthy Individual
3. Discussion
An increasing number of reports underlines the clinical value of urinary peptidomic analysis using CE-MS. A focus of the application has been kidney disease, which, among others, has resulted in a letter of support from the US FDA [32] (https://www.fda.gov/media/98846/download, accessed on 27 November 2021) for this approach. Also a major step forward was the successful completion of PRIORITY [21], the first multicenter randomized controlled trial to apply CE-MS for patient stratification. CE is a simple separation method that allows high resolution separation of analytes. The direct comparison of CE with LC showed much lower variability of CE-MS based data [26]. Reproducibility of CE-MS has been assessed previously [4]. However, the reproducibility depends not only on the CE-MS analysis itself, but also on sample preparation, data calibration, and data handling. Thus, SOPs need to be rigorously followed and any changes in any of the mentioned steps may impact the reproducibility. A major update in our current work-flow includes the deconvolution of MS data: the former de novo approach of defining peptides separately for every sample was replaced by a strategy that relies on a well-defined dataspace of peptides. The aim of this study was to investigate the reproducibility of CE-MS based on data obtained using our current methods for sample analysis and data evaluation [1]. Towards this direction, we used randomly selected 60 and additional 12 measurements of one standard human urine sample to analyze the inter- and intra-day reproducibility, respectively. Good reproducibility between the different runs in the number and total abundance of the detected peptides was observed. The peptide log2 signal intensities correlated well between the different runs. We also detect very good overlap with previous reports, either from our or other groups. Almost all of the most abundant urinary peptides detected in the analyzed standard human urine sample were also found in previously published studies.
The observed variation of the log2 signal intensities between the different runs was low with CV for inter-day reproducibility in the range of 1.3–5.7% and for the intra-day of 0.7–1.6% for the ten most abundant peptides. This low variability is of major benefit in statistical analysis when defining disease-specific biomarkers. The variation of the data is further reduced when combining individual biomarkers into a panel, as exemplified by the investigation of CKD273 and the recently developed Cov50 biomarker panels. The CV of both investigated biomarker panels was lower than the CV of individual peptides, even those of high abundance.
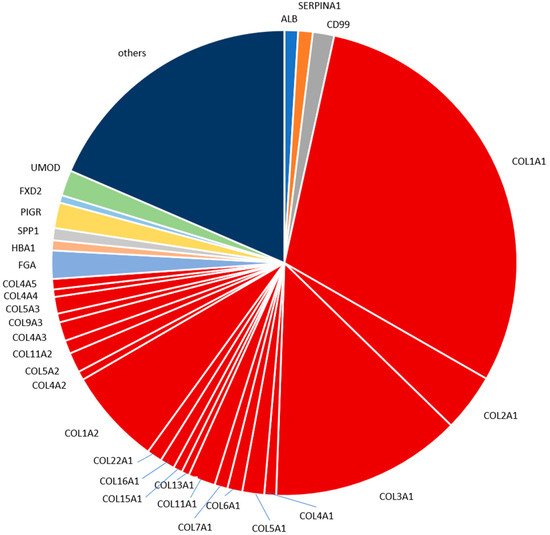
The most abundant peptides detected in the human standard urine sample in our analysis are derived from proteins well expected and already reported to be present in urine, namely different collagen types, fibrinogen alpha chain, uromodulin, polymeric immunoglobulin receptor, CD99 antigen and alpha-1-antitrypsin. For example, in a study focused on colorectal liver metastasis that employed LC-MS/MS [28], 27% of the identified naturally occurring peptides originated from different collagens; while the top three proteins with the highest number of identified fragments were collagen alpha-1(I), collagen alpha-1(III) and uromodulin. Our study also indicated a high contribution of collagen fragments in the standard urine sample proteome. Peptides from collagen alpha-1(I) and collagen alpha-1(III) were the two most frequent (and abundant), with peptides from uromodulin ranking as the 12th most frequent and 7th most abundant. The aforementioned differences may reflect the LC and CE relation, which has been reported as complementary [9]. In another LC-MS/MS based study investigating early type 1 diabetes [29], eight of the ten proteins that gave rise to the most frequently observed peptides namely, albumin, collagen alpha-1(I) chain, hemoglobin subunit alpha, hemoglobin subunit beta, apolipoprotein A-I, protein S100-A9, collagen alpha-2(I) chain, uromodulin, were also included in the seventeen most frequent proteins in our study. As for the ten most abundant peptides based on mean intensities presented in our study, a high overlap was observed with the respective reports by Mischak et al., Kononikhin et al., van Huizen et al. and Van et al. [26][27][28][29]. In all these reports, naturally occurring peptides were analyzed without prior digestion. Many of these peptides contain post-translational modifications. These modifications hinder the identification of the amino acid sequence. This may explain our observation that mainly larger collagen fragments containing multiple proline hydroxylations were not consistently observed in the different studies. The two uromodulin fragments of the top ten most abundant peptides detected here in the standard human urine sample were found in each of the four other reports as well. This is expected, since uromodulin is a highly abundant kidney protein excreted in urine. The two fragments originate from the C-terminus of uromodulin. The peptides from this region are typically detected by analysis of native peptides [26][29].
4. Conclusions
The CE-MS presents a robust and reproducible platform for peptide analysis to be applied in clinical proteomics. The development in the methods for sample preparation, sample analysis and data evaluation resulted in the generation of well comparable datasets (based on both inter-day and intra-day results) that can be now fully exploited for the definition of robust disease-specific biomarkers, specifically biomarker panels. At the same time, given the performance of the platform and available biomarker panels based on CE-MS analysis of urinary peptides, full advantage should be taken to fulfill the main goal of clinical proteomics, which is clinical implementation.
5. Methods
5.1. Urine Sample
The standard human urine sample used in this study was described in detail before [26]. It consists of a pooled midstream morning urine of 8 female healthy anonymous volunteers from multiple collections. Urine collections were performed without any requirements relevant to the diet or the menstrual cycle (only absence of menstruation) of the participants. The approach of pooled urine was followed since it is considered more practical and less technically demanding than individual urine. This urine collection protocol is in agreement to a “standard protocol for urine collection” developed by the Human Urine and Kidney Proteome Project and European Kidney and Urine Proteomics COST Action (EuroKUP) networks [26]. There was no addition of protease or phosphatase inhibitors or pH adjustment. The 40–100 mL collected samples were frozen immediately at −20 °C. Upon completion of collection, all frozen samples were thawed on ice, sonicated, combined, divided into several 1, 10, and 50 mL aliquots, and frozen again at −80 °C The urinary proteome is not affected significantly by up to three freeze/thaw cycles following initial freezing [33]. Measurements selected were of the second quarter of 2021 and included 60 for inter-day and 12 for intra-day investigation of the stability of the CE-MS analysis.
5.2. Capillary Electrophoresis Mass Spectrometry
Sample preparation and CE-MS analysis was performed according to SOP allowing for the recovery of over 80% [4][34]. In detail, urine samples were initially thawed and then diluted by mixing 700 μL with an aqueous solution of 700 μL of 2 M urea, 10 mM NH4OH containing 0.02% sodium dodecyl sulfate (SDS) to inhibit interactions between proteins. Afterwards, a Centristat 20 kDa cut-off centrifugal filter device (Sartorius, Göttingen, Germany) was utilized for the ultrafiltration of the samples to eliminate high molecular weight proteins. Subsequently, urea, salts and electrolytes were removed from the obtained filtrate by desalting using a PD 10 gel filtration column (GE Healthcare Bio Sciences, Uppsala, Sweden) equilibrated with 0.01% NH4OH in HPLC-grade water. Then, lyophilization and storage at 4 °C occurred, until the measurement of the samples using CE-MS.
Shortly before CE-MS analysis, the samples were resuspended in 10 μL HPLC-grade H2O. The analysis was performed using a P/ACE MDQ capillary electrophoresis system (Beckman Coulter, Fullerton, CA, USA) coupled to a micro-TOF-MS (Bruker Daltonic, Bremen, Germany). Before running each sample, the capillary was conditioned with NaOH (1 M in demineralized water) at pressure of 50 psi for 10 min was applied, followed by a final wash of the capillary with NH4OH solution (3.76 mL of ammonium solution (25%) made up to 50 mL with the addition of HPLC-grade water) at 50 psi for 10 min and 20 min with running buffer (a solution of 20% acetonitrile (Sigma-Aldrich, Taufkirchen, Germany) in HPLC-grade water supplemented with 0.94% formic acid (Sigma-Aldrich)). After this conditioning, the capillary (90 cm, 50 μm ID) was connected to the MS. The Beckmann CE parameters of the analysis software were set on ‘reverse’, when connected to the MS system using the external detector adapter (EDA), as the separation of the peptides was achieved by reverse polarity to match the polarity of the CE with that of the MS ionization voltage. Initially, the running buffer was rinsed into the capillary for 2 min at 50 psi, before the injection of each sample. Samples were then injected into CE-MS at 2 psi for 99 sec, resulting in injection volumes of ~290 nL. At the injection side of the capillary +25 kV were applied for 30 min, enabling separation of the analytes at a capillary set temperature of 35 °C. Then, along with the +25 kV separation voltage, pressure was applied (0.1 psi for 1 min, 0.2 psi for 1 min, 0.3 psi for 1 min, 0.4 psi for 1 min and 0.5 psi for 30 min). Coaxially, sheath liquid (15 mL of 2-propanol, 200 µl of formic acid with addition of HPLC-grade water until 50 mL) was applied with flow rates in the range of 0.02 mL/h (without nebulizer gas). For the CE-MS analysis, the electrospray ionization interface (Agilent Technologies, Palo Alto, CA, USA) was set to a potential of −4.0 to −5 kV and the ESI sprayer was grounded to achieve electric potential zero. Spectra were recorded over a m/z range of 400–3000 and accumulated every 3 sec for about 60 min. A resolution in the range of 10,000 characterized monoisotopic mass signals resolved for z ≤ 6.
5.3. MS Data Evaluation
The raw data of the CE-MS analysis are saved in the database to the corresponding clinical information based on the unique identification sample number. The evaluation of raw MS data was performed with MosaFinder software that is based on a probabilistic clustering algorithm and utilizing isotopic distributions and conjugated masses for charge state determination [1]. Twenty-nine collagen fragments, on which the disease, in general, has no impact, were used as internal standards for the normalization of the obtained signal intensities [13]. An in silico assignment of the identified fragments to sequenced peptides from the Human Urinary Proteome database was performed [1].
5.4. Statistics
The signal intensities of the detected peptides were log2 transformed after entries with zeros were converted into missing values. The results and findings of the current paper were based on R programming (R version 4.1.0, R Foundation Statistical Computing, Vienna, Austria). The descriptive statistics per run and per peptide were calculated with the function stat.desc of the R package pastecs. The Pearson correlation matrix was calculated with the rcorr function of Hmisc R package and generated as a plot with the R package corrplot. The plot for the mass distribution of the identified analytes as well as the plots of the distributions of the log2 intensities of the four most abundant peptides were created based on the package ggplot2 [35] and the latter plots were arranged in the same figure using ggpubr R package. The plots of the distributions of classification scores were generated using MedCalc software (version 12.1.0.0; MedCalc Sofware, Mariakerke, Belgium). The latter software was also used to perform the parametric t-test for the comparison of inter- and intra-day results with respect to their mean log2 signal intensities.
References
- Latosinska, A.; Siwy, J.; Mischak, H.; Frantzi, M. Peptidomics and proteomics based on CE-MS as a robust tool in clinical application: The past, the present, and the future. Electrophoresis 2019, 40, 2294–2308.
- Stalmach, A.; Albalat, A.; Mullen, W.; Mischak, H. Recent advances in capillary electrophoresis coupled to mass spectrometry for clinical proteomic applications. Electrophoresis 2013, 34, 1452–1464.
- Latosinska, A.; Frantzi, M.; Vlahou, A.; Mischak, H. Clinical applications of capillary electrophoresis coupled to mass spectrometry in biomarker discovery: Focus on bladder cancer. Proteom. Clin. Appl. 2013, 7, 779–793.
- Mischak, H.; Vlahou, A.; Ioannidis, J.P. Technical aspects and inter-laboratory variability in native peptide profiling: The CE–MS experience. Clin. Biochem. 2012, 46, 432–443.
- Mischak, H.; Schanstra, J.P. CE-MS in biomarker discovery, validation, and clinical application. Proteom. Clin. Appl. 2010, 5, 9–23.
- Huhn, C.; Ramautar, R.; Wuhrer, M.; Somsen, G.W. Relevance and use of capillary coatings in capillary electrophoresis–mass spectrometry. Anal. Bioanal. Chem. 2009, 396, 297–314.
- Pontillo, C.; Filip, S.; Borràs, D.M.; Mullen, W.; Vlahou, A.; Mischak, H. CE-MS-based proteomics in biomarker discovery and clinical application. Proteom. Clin. Appl. 2015, 9, 322–334.
- Kolch, W.; Neusüß, C.; Pelzing, M.; Mischak, H. Capillary electrophoresis-mass spectrometry as a powerful tool in clinical diagnosis and biomarker discovery. Mass Spectrom. Rev. 2005, 24, 959–977.
- Klein, J.; Papadopoulos, T.; Mischak, H.; Mullen, W. Comparison of CE-MS/MS and LC-MS/MS sequencing demonstrates significant complementarity in natural peptide identification in human urine. Electrophoresis 2014, 35, 1060–1064.
- Mischak, H.; Coon, J.J.; Novak, J.; Weissinger, E.M.; Schanstra, J.P.; Dominiczak, A. Capillary electrophoresis-mass spectrometry as a powerful tool in biomarker discovery and clinical diagnosis: An update of recent developments. Mass Spectrom. Rev. 2008, 28, 703–724.
- Dakna, M.; Harris, K.; Kalousis, A.; Carpentier, S.; Kolch, W.; Schanstra, J.P.; Haubitz, M.; Vlahou, A.; Mischak, H.; Girolami, M. Addressing the Challenge of Defining Valid Proteomic Biomarkers and Classifiers. BMC Bioinform. 2010, 11, 594.
- Stanley, E.; Delatola, E.I.; Nkuipou-Kenfack, E.; Spooner, W.; Kolch, W.; Schanstra, J.P.; Mischak, H.; Koeck, T. Comparison of different statistical approaches for urinary peptide biomarker detection in the context of coronary artery disease. BMC Bioinform. 2016, 17, 496.
- Siwy, J.; Schiffer, E.; Brand, K.; Schumann, G.; Rossing, K.; Delles, C.; Mischak, H.; Metzger, J. Quantitative Urinary Proteome Analysis for Biomarker Evaluation in Chronic Kidney Disease. J. Proteome Res. 2008, 8, 268–281.
- Rodríguez-Suárez, E.; Whetton, A.D. The application of quantification techniques in proteomics for biomedical research. Mass Spectrom. Rev. 2012, 32, 1–26.
- Mavrogeorgis, E.; Mischak, H.; Beige, J.; Latosinska, A.; Siwy, J. Understanding glomerular diseases through proteomics. Expert Rev. Proteom. 2021, 18, 137–157.
- Brown, C.E.; McCarthy, N.; Hughes, A.; Sever, P.; Stalmach, A.; Mullen, W.; Dominiczak, A.; Sattar, N.; Mischak, H.; Thom, S.; et al. Urinary proteomic biomarkers to predict cardiovascular events. Proteom. Clin. Appl. 2015, 9, 610–617.
- He, T.; Mischak, M.; Clark, A.L.; Campbell, R.T.; Delles, C.; Díez, J.; Filippatos, G.; Mebazaa, A.; McMurray, J.J.; González, A.; et al. Urinary peptides in heart failure: A link to molecular pathophysiology. Eur. J. Heart Fail. 2021.
- Wendt, R.; Thijs, L.; Kalbitz, S.; Mischak, H.; Siwy, J.; Raad, J.; Metzger, J.; Neuhaus, B.; von der Leyen, H.; Dudoignon, E.; et al. A urinary peptidomic profile predicts outcome in SARS-CoV-2-infected patients. EClinicalMedicine 2021, 36, 100883.
- Wendt, R.; Kalbitz, S.; Lübbert, C.; Kellner, N.; Macholz, M.; Schroth, S.; Ermisch, J.; Latosisnka, A.; Arnold, B.; Mischak, H.; et al. Urinary Peptides Significantly Associate with COVID-19 Severity: Pilot Proof-of-Principle Data and Design of a Multicentric Diagnostic Study. Proteomics 2020, 20, 2000202.
- Siwy, J.; Wendt, R.; Albalat, A.; He, T.; Mischak, H.; Mullen, W.; Latosinska, A.; Lübbert, C.; Kalbitz, S.; Mebazaa, A.; et al. CD99 and polymeric immunoglobulin receptor peptides deregulation in critical COVID-19: A potential link to molecular pathophysiology? Proteomics 2021, 21, 2100133.
- Tofte, N.; Lindhardt, M.; Adamova, K.; Bakker, S.J.L.; Beige, J.; Beulens, J.W.J.; Birkenfeld, A.L.; Currie, G.; Delles, C.; Dimos, I.; et al. Early detection of diabetic kidney disease by urinary proteomics and subsequent intervention with spironolactone to delay progression (PRIORITY): A prospective observational study and embedded randomised placebo-controlled trial. Lancet Diabetes Endocrinol. 2020, 8, 301–312.
- Pontillo, C.; Zhang, Z.-Y.; Schanstra, J.P.; Jacobs, L.; Zürbig, P.; Thijs, L.; Ramírez-Torres, A.; Heerspink, H.J.; Lindhardt, M.; Klein, R.; et al. Prediction of Chronic Kidney Disease Stage 3 by CKD273, a Urinary Proteomic Biomarker. Kidney Int. Rep. 2017, 2, 1066–1075.
- Pontillo, C.; Jacobs, L.; Staessen, J.A.; Schanstra, J.P.; Rossing, P.; Heerspink, H.J.; Siwy, J.; Mullen, W.; Vlahou, A.; Mischak, H.; et al. A urinary proteome-based classifier for the early detection of decline in glomerular filtration. Nephrol. Dial. Transplant. 2016, 32, 1510–1516.
- Lindhardt, M.; Persson, F.; Oxlund, C.; Jacobsen, I.A.; Zürbig, P.; Mischak, H.; Rossing, P.; Heerspink, H.J. Predicting albuminuria response to spironolactone treatment with urinary proteomics in patients with type 2 diabetes and hypertension. Nephrol. Dial. Transplant. 2017, 33, 296–303.
- Latosinska, A.; Siwy, J.; Cherney, D.Z.; Perkins, B.A.; Mischak, H.; Beige, J. SGLT2-Inhibition reverts urinary peptide changes associated with severe COVID-19: An in-silico proof-of-principle of proteomics-based drug repurposing. Proteomics 2021, 21, 2100160.
- Mischak, H.; Kolch, W.; Aivaliotis, M.; Bouyssié, D.; Court, M.; Dihazi, H.; Dihazi, G.H.; Franke, J.; Garin, J.; de Peredo, A.G.; et al. Comprehensive human urine standards for comparability and standardization in clinical proteome analysis. Proteom. Clin. Appl. 2010, 4, 464–478.
- Kononikhin, A.S.; Zakharova, N.V.; Sergeeva, V.A.; Indeykina, M.I.; Starodubtseva, N.L.; Bugrova, A.E.; Muminova, K.T.; Khodzhaeva, Z.S.; Popov, I.A.; Shao, W.; et al. Differential Diagnosis of Preeclampsia Based on Urine Peptidome Features Revealed by High Resolution Mass Spectrometry. Diagnostics 2020, 10, 1039.
- Van Huizen, N.A.; Van Rosmalen, J.; Dekker, L.J.M.; Braak, R.R.J.C.V.D.; Verhoef, C.; Ijzermans, J.N.M.; Luider, T.M. Identification of a Collagen Marker in Urine Improves the Detection of Colorectal Liver Metastases. J. Proteome Res. 2019, 19, 153–160.
- Van, J.A.D.; Clotet-Freixas, S.; Zhou, J.; Batruch, I.; Sun, C.; Glogauer, M.; Rampoldi, L.; Elia, Y.; Mahmud, F.H.; Sochett, E.; et al. Peptidomic Analysis of Urine from Youths with Early Type 1 Diabetes Reveals Novel Bioactivity of Uromodulin Peptides In Vitro. Mol. Cell. Proteom. 2020, 19, 501–517.
- Good, D.M.; Zürbig, P.; Argilés, A.; Bauer, H.W.; Behrens, G.; Coon, J.J.; Dakna, M.; Decramer, S.; Delles, C.; Dominiczak, A.; et al. Naturally Occurring Human Urinary Peptides for Use in Diagnosis of Chronic Kidney Disease. Mol. Cell. Proteom. 2010, 9, 2424–2437.
- He, T.; Pejchinovski, M.; Mullen, W.; Beige, J.; Mischak, H.; Jankowski, V. Peptides in Plasma, Urine, and Dialysate: Toward Unravelling Renal Peptide Handling. Proteom. Clin. Appl. 2020, 15, e2000029.
- Claudia Pontillo; Harald Mischak; Urinary peptide-based classifier CKD273: towards clinical application in chronic kidney disease. Clinical Kidney Journal 2017, 10, 192-201, 10.1093/ckj/sfx002.
- Visith Thongboonkerd; Siriwan Mungdee; Wararat Chiangjong; Should Urine pH Be Adjusted Prior to Gel-Based Proteome Analysis?. Journal of Proteome Research 2009, 8, 3206-3211, 10.1021/pr900127x.
- Dan Theodorescu; Danilo Fliser; Stefan Wittke; Harald Mischak; Ronald Krebs; Michael Walden; Mark Ross; Elke Eltze; Olaf Bettendorf; Christian Wülfing; et al.Axel Semjonow Pilot study of capillary electrophoresis coupled to mass spectrometry as a tool to define potential prostate cancer biomarkers in urine. ELECTROPHORESIS 2005, 26, 2797-2808, 10.1002/elps.200400208.
- Wickham H. Ggplot2: Elegant Graphics for Data Analysis; Springer: New York, NY, USA, 2016; pp. 1-260.


