 +1 credit
| Version | Summary | Created by | Modification | Content Size | Created at | Operation |
|---|---|---|---|---|---|---|
| 1 | Alessandra Marti | + 3033 word(s) | 3033 | 2021-12-06 09:15:13 |
Video Upload Options
Empiric rheology is considered a useful tool for assessing the technological quality of wheat. Over the decades, several tests have been adapted from common to durum wheat, and new approaches have been proposed to meet the needs of the players of the durum wheat value chain. It is here provided an overview of the strengths and weaknesses of the rheological tests currently used to evaluate the quality of durum wheat semolina.
1. Introduction
2. Defining Gluten Quality
|
Gluten Property |
General Definition |
Applied to Durum Wheat Dough and Pasta |
|---|---|---|
|
Viscoelasticity |
Ability of solids to have simultaneous viscous and elastic properties |
The determinantal characteristic of gluten, necessary for pasta-making process |
|
Viscosity |
Resistance of a liquid to flow |
It determines in which way the dough flows through the press and the dye |
|
Elasticity |
Ability of solids to recover their initial shape after deformation |
It allows the mass to withstand strong compression (about 10 MPa) during the extrusion phase and to assure regular shrinkage during drying (shape maintenance) |
|
Extensibility |
Maximum degree of deformation reached by solids before breakage |
Excessive extensibility doesn’t counteract the mechanical stresses during processing |
|
Tenacity |
Resistance of dough to deformation |
It allows the mass to resist, without breaking, the high/intense mechanical stresses (shear and stretching) occurring during the extrusion phase |
|
Strength |
Ability of solids to resist mechanical stress |
It allows proteins to form a regular and continuous network that promotes good cooking quality |
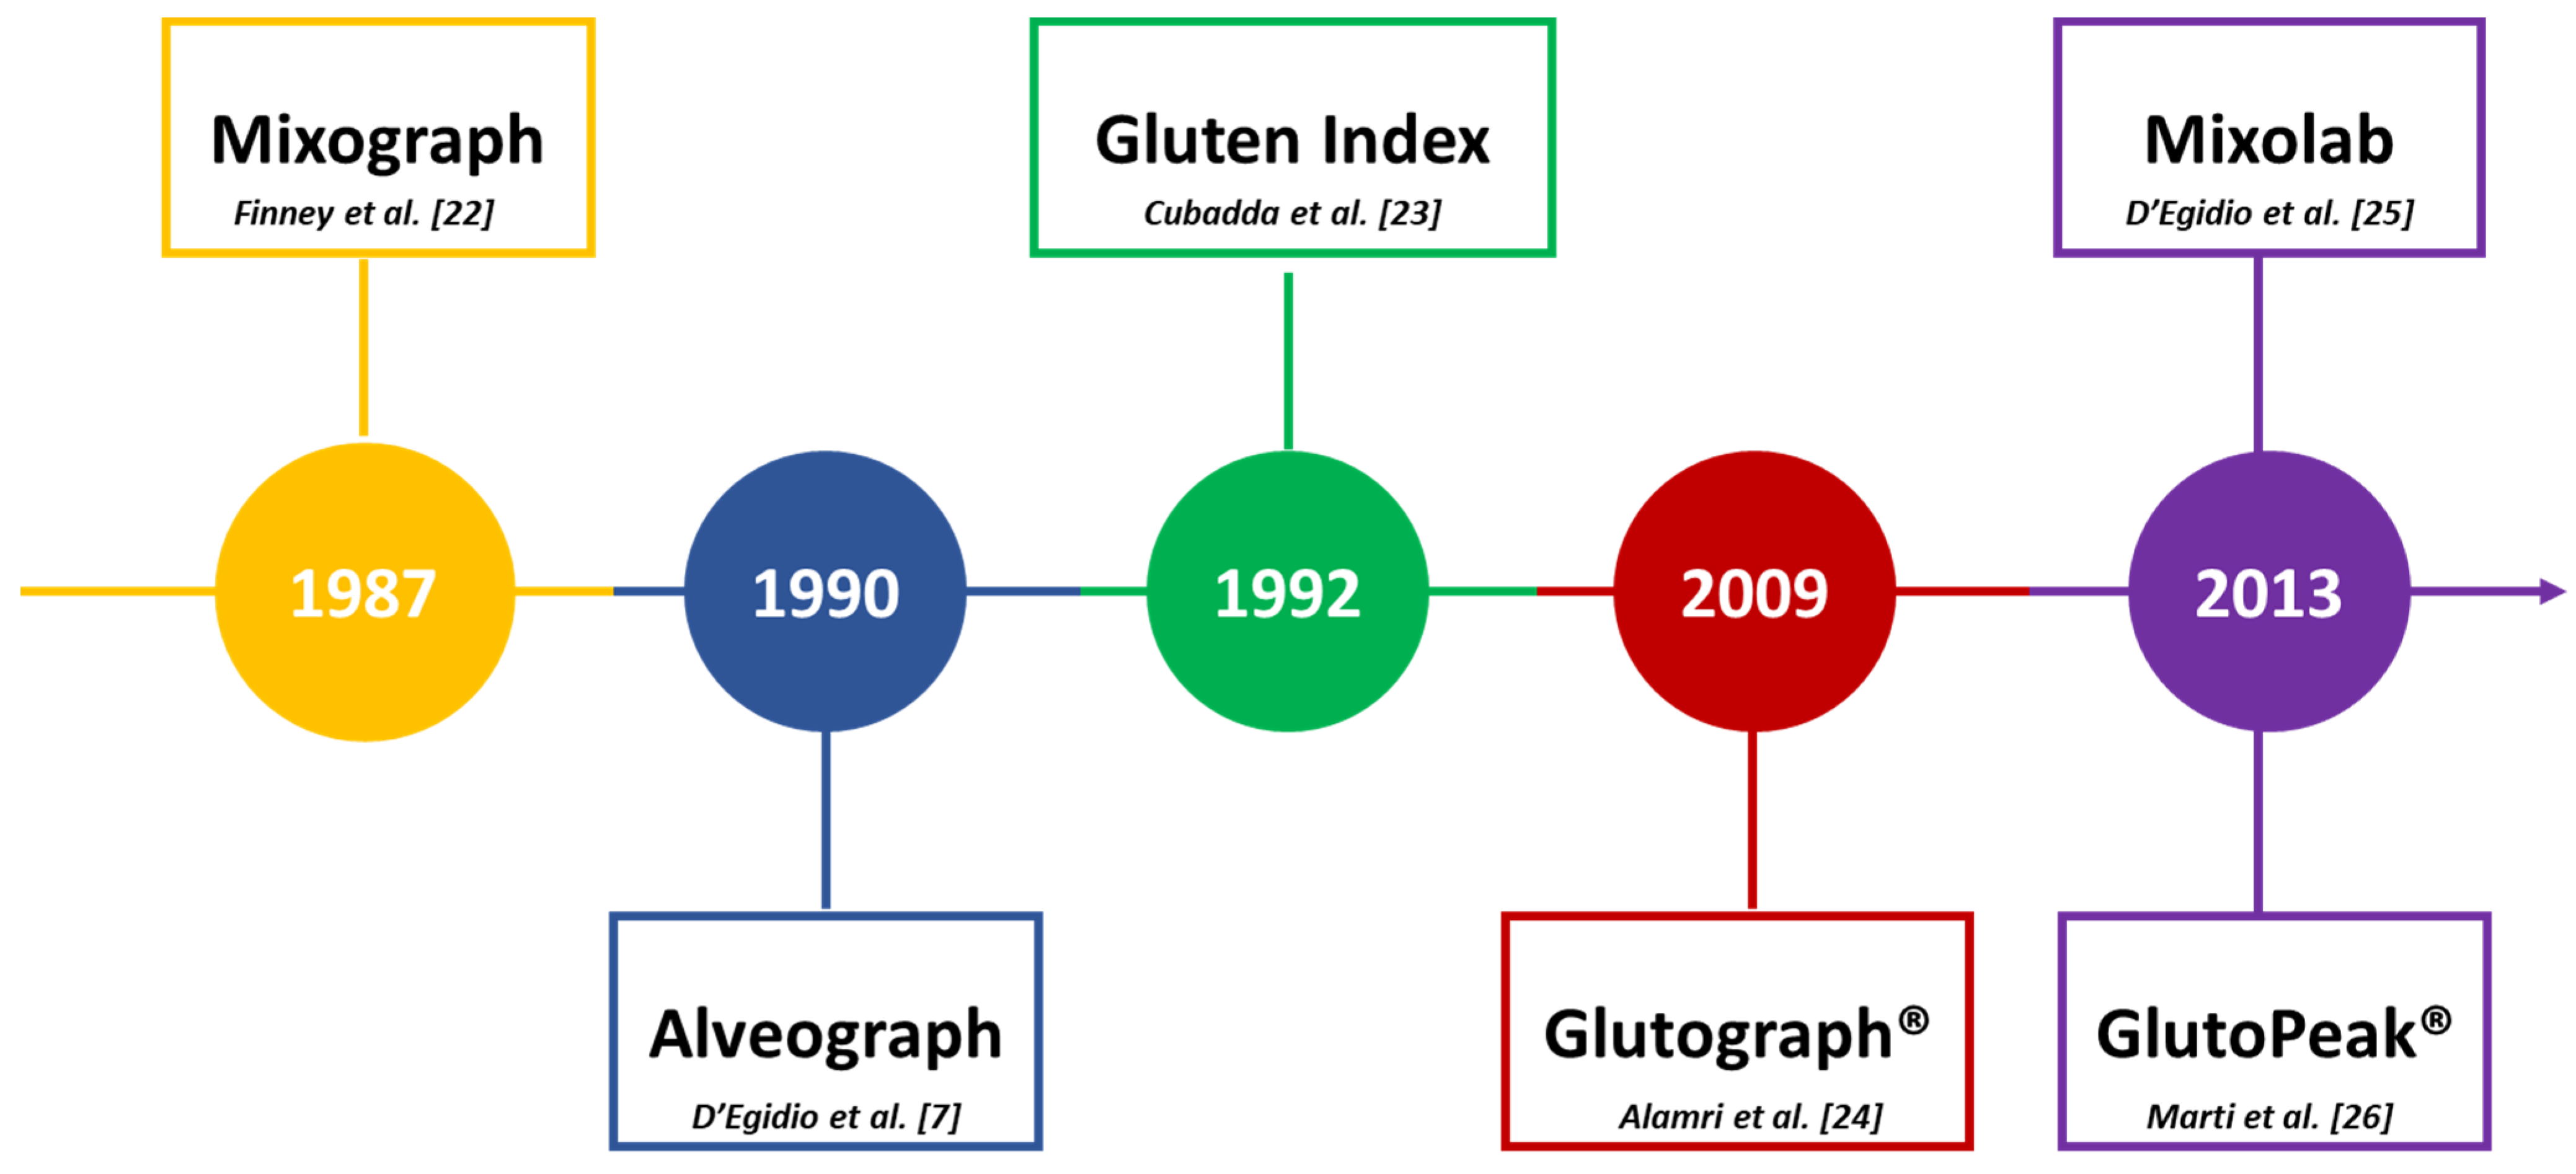
3. Assessing Gluten Quality
|
Test |
Principle |
Hydration Level |
Features |
Standard Method for Durum Wheat Semolina |
|---|---|---|---|---|
|
Gluten Index |
Gluten ability to pass through a sieve after centrifugation |
not required |
- Short time for analysis (10 min) - Small amount of sample (10 g) - Need to extract gluten - Overestimation of the value in case of low protein content samples - Low capacity of discriminating semolina of medium quality |
|
|
Glutograph® |
Gluten resistance to stretching |
not required |
- Short time for analysis (20 min, including extraction and resting time) - Small amount of sample (10 g) - Need to extract gluten - High variability |
No |
|
Alveograph |
Dough resistance to tridimensional extension |
≈52 g water/100 g semolina (14% moisture basis) |
- Long time for analysis (50 min) - Large amount of sample (250 g) - High influence of the analyst - Widely used in the field, especially in Europe |
Yes [45] |
|
GlutoPeak® |
Aggregation kinetics of gluten proteins |
≈100 g water/100 g semolina (14% moisture basis) |
- Short time for analysis (5-10 min) - Small amount of sample (9 or 10 g) - Low influence of the analyst - Few available studies |
No |
|
Mixolab |
Dough resistance to both mechanical and thermal stress |
≈60 g water/100 g semolina (14% moisture basis) |
- Long time for analysis (45 min) - Large amount of sample (50 g) - Low influence of the analyst - Difficulty in following the set temperature profile |
No |
|
Test |
Index |
Description |
Type of Information |
|---|---|---|---|
|
Gluten Index |
Value from 0 to 100 |
Percentage of wet gluten retained in the sieve |
Gluten strength |
|
Glutograph® |
Stretching time |
Time to reach deflection or value after time threshold (shear/stretch angle) |
Gluten extensibility |
|
Relaxation |
Recovery angle after 10 s of stress removal |
Gluten elasticity |
|
|
Alveograph |
P |
Maximum pressure (mmH2O) needed to deform the dough till breakage |
Dough tenacity |
|
L |
Length of the curve (mm) |
Dough extensibility |
|
|
P/L |
Ratio between P and L |
Balance between dough tenacity and extensibility |
|
|
W |
Energy (in 10−4 J) required for dough deformation till breakage; area under the curve |
Dough strength |
|
|
Ie |
Ratio between P200 (i.e., the pressure 4 cm from the beginning of the curve) and the value of P |
Dough elasticity |
|
|
GlutoPeak® |
Maximum consistency (BEM) |
Maximum height of the peak |
Consistency of gluten upon aggregation |
|
Peak maximum time (PMT) |
Time required to reach the maximum height |
Time for gluten aggregation |
|
|
Aggregation energy |
Area from 15 s before to 15 s after the maximum peak |
Gluten strength |
|
|
Total energy |
Area from 0 s before to 15 s after the maximum peak |
Gluten strength |
|
|
Mixolab |
Water absorption |
Amount of water to add to semolina to reach an optimal consistency of 1.10 Nm (C1) |
The higher the value, the higher protein quantity/quality |
|
Development time |
Time needed to reach C1 |
The higher the value, the higher protein quantity/quality |
|
|
Stability |
Time around C1 where the torque is higher or equal to the real value of C1–C1*11% |
Dough resistance to mixing |
|
|
Torque C2 |
The lowest point of the curve when the device starts heating the dough |
Weakening of protein |
|
|
C1–C2 |
Difference between Torque C1 and C2 |
Gluten strength |
|
|
Torque C3 |
The maximum torque obtained after C2 during the heating phase. |
Starch gelatinization |
|
|
Torque C4 |
The minimum torque after the holding period at 90°C |
Stability during heating and mixing |
|
|
Torque C5 |
Torque at the end of the test |
Starch retrogradation tendency |
P, maximum pressure; L, maximum length; P/L, pressure:length ratio; W, area under the curve; Ie, P200/P (P200: pressure at 4 cm from the beginning of the curve).
4. Relation among the Main Rheological Approaches and Relevance for Cooking Quality
Although numerous efforts have been made to propose rapid and reliable tests for semolina characterization, the ideal test has yet to be proposed, indicating that researchers and pasta companies need to focus on perfecting the way to assess the quality of durum wheat and pasta.
References
- Liu, C.Y.; Shepherd, K.W.; Rathjen, A.J. Improvement of durum wheat pasta making and breadmaking qualities. Cereal Chem. 1996, 73, 155–166.
- Resmini, P.; Pagani, M.A. Ultrastructure Studies of Pasta. A Review. Food Struct. 1983, 2, 2.
- Cunin, C.; Handschin, S.; Walther, P.; Escher, F. Structural changes of starch during cooking of durum wheat pasta. LWT Food Sci. Technol. 1995, 28, 323–328.
- Bruneel, C.; Pareyt, B.; Brijs, K.; Delcour, J.A. The impact of the protein network on the pasting and cooking properties of dry pasta products. Food Chem. 2010, 120, 371–378.
- De Noni, I.; Pagani, M.A. Cooking properties and heat damage of dried pasta as influenced by raw material characteristics and processing conditions. Crit. Rev. Food Sci. Nutr. 2010, 50, 465–472.
- Dalbon, G.; Pagani, M.A.; Resmini, P.; Lucisano, M. Einflüsse einer hitzebehandlung der weizenstärke wärhrend des trocknungsprozesses. Getreide Mehl. Brot. 1985, 39, 183–189.
- D’Egidio, M.G.; Mariani, B.M.; Nardi, S.; Novaro, P.; Cubadda, R. Chemical and technological variables and their relationships: A predictive equation for pasta cooking quality. Cereal Chem. 1990, 67, 275–281.
- Novaro, P.; D’Egidio, M.G.; Mariani, B.M.; Nardi, S. Combined effect of protein-content and high-temperature drying systems on pasta cooking quality. Cereal Chem. 1993, 70, 716–719.
- Zweifel, C.; Handschin, S.; Escher, F.; Conde-Petit, B. Influence of high-temperature drying on structural and textural properties of durum wheat pasta. Cereal Chem. 2003, 80, 159–167.
- Cubadda, R.; Carcea, M.; Marconi, E.; Trivisonno, M.C. Influence of gluten proteins and drying temperature on the cooking quality of durum wheat pasta. Cereal Chem. 2007, 84, 48–55.
- Petitot, M.; Brossard, C.; Barron, C.; Larré, C.; Morel, M.H.; Micard, V. Modification of pasta structure induced by high drying temperatures. Effects on the in vitro digestibility of protein and starch fractions and the potential allergenicity of protein hydrolysates. Food Chem. 2009, 116, 401–412.
- UNI 10940:2001. Prodotti Derivati dal Grano duro Destinati alla Pastificazione—Definizione, Caratteristiche e Classi di Qualità. Available online: http://store.uni.com/catalogo/uni-10940-2001?josso_back_to=http://store.uni.com/josso-security-check.php&josso_cmd=login_optional&josso_partnerapp_host=store.uni.com (accessed on 27 October 2021).
- Fuad, T.; Prabhasankar, P. Role of Ingredients in Pasta Product Quality: A Review on Recent Developments. Crit. Rev. Food Sci. Nutr. 2010, 50, 787–798.
- Mastrangelo, A.M.; Cattivelli, L. What makes bread and durum wheat different? Trends Plant Sci. 2021, 26, 677–684.
- Payne, P.I.; Nightingale, M.A.; Krattiger, A.F.; Holt, L.M. The relationship between HMW glutenin subunit composition and the bread-making quality of british-grown wheat varieties. J. Sci. Food Agric. 1987, 40, 51–65.
- Edwards, N.M.; Mulvaney, S.J.; Scanlon, M.G.; Dexter, J.E. Role of gluten and its components in determining durum semolina dough viscoelastic properties. Cereal Chem. 2003, 80, 755–763.
- Shewry, P.R.; Halford, N.G.; Belton, P.S.; Tatham, A.S. The structure and properties of gluten: An elastic protein from wheat grain. Phil. Trans. R. Soc. Lond. B 2002, 357, 133–142.
- Sissons, M.J. Role of durum wheat composition on the quality of pasta and bread. Foods 2008, 2, 75–90.
- Bonomi, F.; Ferranti, P.; Mamone, G. Wheat Flour: Chemistry and Biochemistry. In Bakery Products Science and Technology; Zhou, W., Ed.; Wiley Blackwell: Hoboken, NJ, USA, 2014; pp. 55–74.
- Dobraszczyk, B.J. Wheat and Flour. In Cereals and Cereal Products Chemistry and Technology; Aspen Publisher Inc.: Gaithersburg, MD, USA, 2001; pp. 100–113.
- Bushuk, W. Rheology: Theory and application to wheat flour doughs. In Rheology of Wheat Products; Faridi, H., Ed.; AACC: St. Paul, MN, USA, 1985; pp. 1–26.
- Finney, K.F.; Yamazaki, W.T.; Youngs, V.L.; Rubenthaler, G.L. Quality of hard, soft and durum wheats. In Wheat and Wheat Improvement, 2nd ed.; Heyne, E.G., Ed.; Agronomy Monograph 13; ASA; CSSA; SSSA: Madison, WI, USA, 1987; pp. 677–748.
- Cubadda, R.; Carcea, M.; Pasqui, L.A. Suitability of the gluten index method for assessing gluten strength in durum wheat and semolina. Cereal Foods World 1992, 37, 866–869.
- Alamri, M.S.; Manthey, F.; Mergoum, M.; Elias, E.; Khan, K. Use of the Glutograph Instrument in durum wheat quality evaluation. Cereal Food World 2009, 54, 124–131.
- D’Egidio, M.G.; Moscaritolo, S.; Marti, A.; Pagani, M.A. Adaptation of the Mixolab for durum wheat testing. In Mixolab a New Approach to Rheology; Dubat, A., Rosell, C.M., Gallagher, E., Eds.; AACC: St. Paul, MN, USA, 2013; Chapter 13; pp. 89–98.
- Marti, A.; Seetharaman, K.; Pagani, M.A. Rheological approaches suitable for investigating starch and protein properties related to cooking quality of durum wheat pasta. J. Food Quality 2013, 36, 133–138.
- Marchylo, B.A.; Dexter, J.E.; Clarke, F.R.; Clarke, J.M.; Preston, K.R. Relationships among bread-making quality, gluten strength, physical dough properties, and pasta cooking quality for some Canadian durum wheat genotypes. Can. J. Plant Sci. 2001, 81, 611–620.
- Dick, J.W.; Youngs, V.L. Evaluation of durum wheat semolina and pasta in the United States. In Durum Wheat: Chemistry and Technology; Fabriani, G., Lintas, C., Eds.; AACC: St. Paul, MN, USA, 1988; pp. 237–248.
- Rath, C.R.; Gras, P.W.; Wrigley, C.W.; Walker, C.E. Evaluation of dough properties from 2 g flour using the Mixograph principle. Cereal Foods World 1990, 35, 572–574.
- Finney, K.F. A five-gram Mixograph to determine and predict functional properties of wheat flours. Cereal Chem. 1989, 66, 527–530.
- Khatkar, B.S.; Bell, A.E.; Schofield, J.D. A comparative study of the inter-relationships between mixograph parameters and bread making qualities of wheat flours and glutens. J. Sci. Food Agric. 1996, 72, 71–85.
- Kovacs, M.I.P.; Poste, L.M.; Butler, G.; Woods, S.M.; Leisle, D.; Noll, J.S.; Dahlk, G. Durum wheat quality: Comparison of chemical and rheological screening tests with sensory analysis. J. Cereal Sci. 1997, 25, 65–75.
- AbuHammad, W.A.; Elias, E.M.; Manthey, F.A.; Alamri, M.S.; Mergoum, M. A comparison of methods for assessing dough and gluten strength of durum wheat and their relationship to pasta cooking quality. Int. J. Food Sci. Tech. 2012, 47, 2561–2573.
- Peña, R.J. Durum wheat for pasta and bread-making. Comparison of methods used in breeding to determine gluten quality-related parameters. In Durum Wheat Improvement in the Mediterranean Region: New Challenges; Royo, C., Nachit, M., Di Fonzo, N., Araus, J.L., Eds.; Options Méditerranéennes: Serie A Séminaires Méditerranéennes; CIHEAM: Zaragoza, Spain, 2000; pp. 423–430.
- EN 15948:2015. Cereals—Determination of Moisture and Protein—Method Using Near-Infrared-Spectroscopy in Whole Kernels. Available online: https://standards.iteh.ai/catalog/standards/cen/f9d75e71-8643-4bb3-8dc4-c34b5b51d890/en-15948-2015 (accessed on 27 October 2021).
- Sinelli, N.; Pagani, M.A.; Lucisano, M.; D’Egidio, M.G.; Mariotti, M. Prediction of semolina technological quality by FT-NIR spectroscopy. J. Cereal Sci. 2011, 54, 218–223.
- Cecchini, C.; Antonucci, F.; Costa, C.; Marti, A.; Menesatti, P. Application of near-infrared handheld spectrometers to predict semolina quality. J. Sci. Food Agric. 2021, 101, 151–157.
- Porep, J.U.; Kammerer, D.R.; Carle, R. On-line application of near infrared (NIR) spectroscopy in food production. Trends Food Sci. Technol. 2015, 46, 211–230.
- Autran, J.C.; Abecassis, J.; Feillet, P. Statistical evaluation of different technological and biochemical tests for quality assessment in durum wheats. Cereal Chem. 1986, 63, 390–394.
- Feillet, P.; Dexter, J.E. Quality requirements of durum wheat for semolina milling and pasta production. In Pasta and Noodle Technology; Kruger, J.E., Matsuo, R.B., Dick, J.W., Eds.; AACC: St Paul, MN, USA, 1996; pp. 95–131.
- Ames, N.P.; Clarke, J.M.; Marchylo, B.A.; Dexter, J.E.; Schlichting, L.M.; Woods, S.M. The effect of extra-strong gluten on quality parameters in durum wheat. Can. J. Plant Sci. 2003, 83, 525–532.
- Marti, A.; Cecchini, C.; D’Egidio, M.G.; Dreisoerner, J.; Pagani, M.A. Characterization of durum wheat semolina by means of a rapid shear-based method. Cereal Chem. 2014, 91, 542–547.
- ICC Standard No. 158:1995. Gluten Index Method for Assessing Gluten Strength in Durum Wheat (Triticum durum). Available online: https://icc.or.at/store/158-gluten-index-method-for-assessing-gluten-strength-in-durum-wheat-triticum-durum-pdf (accessed on 26 October 2021).
- ISO. EN ISO 21415-2:2015. Wheat and Wheat Flour—Gluten Content—Part 2: Determination of Wet Gluten and Gluten Index by Mechanical Means; ISO: Geneva, Switzerland, 2015.
- UNI 10453:1995. Grano Duro e Semole. Determinazione Delle Caratteristiche Reologiche Mediante Alveografia. Available online: http://store.uni.com/catalogo/uni-10453-1995 (accessed on 27 October 2021).
- Clarke, F.R.; Clarke, J.M.; Ames, N.P.; Knox, R.E.; Ross, R.J. Gluten index compared with SDS-sedimentation volume for early generation selection for gluten strength in durum wheat. Can. J. Plant Sci. 2010, 90, 1–11.
- Ohm, J.B.; Manthey, F.; Elias, E.M. Variation and correlation of protein molecular weight distribution and semolina quality parameters for durum genotypes grown in North Dakota. Cereal Chem. 2017, 94, 780–788.
- Dexter, J.E.; Preston, K.R.; Martin, D.G.; Gander, E.J. The effect of protein content and starch damage on the physical dough properties and bread-making quality of Canadian durum wheat. J. Cereal Sci. 1994, 20, 139–151.
- Peressini, D. Valutazione della qualità tecnologica del frumento mediante indici reologici di tipo fondamentale. Boll. Panta Rei 2017, 17, 5–13.
- Alamri, M.S.; Manthey, F.; Mergoum, M.; Elias, E.; Khan, K. The effects of reconstituted semolina fractions on pasta processing and quality parameters and relationship to Glutograph parameters. J. Food Technol. 2010, 8, 159–168.
- Sissons, M. GlutoPeak: A breeding tool for screening dough properties of durum wheat semolina. Cereal Chem. 2016, 93, 550–556.


