 +1 credit
| Version | Summary | Created by | Modification | Content Size | Created at | Operation |
|---|---|---|---|---|---|---|
| 1 | Honghong Yu | + 4135 word(s) | 4135 | 2021-11-11 03:47:09 | | | |
| 2 | Rita Xu | Meta information modification | 4135 | 2021-12-15 03:14:48 | | |
Video Upload Options
Under the background of China’s proposal to achieve “carbon neutralization and carbon peak”, it is an important task for each province to clarify their forest ecological security (FES) status. However, there is little understanding of the temporal and spatial evolution of forest ecological security and its influencing factors.Based on the Pressure-State-Response (PSR) model, this paper constructed a comprehensive evaluation index system for forest ecological security and used the CRITIC method and panel data to estimate the dynamic changes in FES for 31 provinces in China (excluding Hong Kong, Macao, and Taiwan) between 2009 and 2018. Furthermore, the obstacle degree model was used to determine the important obstacle factors affecting FES. The results showed that: (1) The comprehensive indices of FES of most provinces in mainland China were increasing, showing a good development trend during the study period; (2) subject to the limitations of resources and economic conditions, the FES at the provincial level showed significant spatial heterogeneity, which generally presents a distribution characteristic of “low in the western region and high in the central and eastern regions”; and (3) the primary obstacles restricting the improvement of FES level in most provinces of China were forest state indicators or input response indicators, followed by pressure indicators. Therefore, it is recommended to take targeted measures to reduce the intensity of forest cutting and the incidence of forest disasters, improve the utilization efficiency of forest resources, the productivity of forestland and the input-output level of forestry industry, and strengthen the training of professional talents and technical input according to the resource endowment condition of each province so as to improve the level of forest ecological security.
1. Introduction
The main goal of this paper is to construct an FES evaluation index system based on the traditional definition of FES and the PSR framework that also takes into account the impact of the forestry industry and the support responses from talents and technology development on the FES. Using the constructed index, we compared and analyzed the FES status of 31 provinces in China (excluding Hong Kong, Macao, and Taiwan) from 2009 to 2018, and explored the changes and spatial distribution of FES in different provinces. Furthermore, the obstacle degree model was used to analyze the key factors affecting FES in China’s provinces. We believe that the results herein provide an important reference for the formulation of forest ecological strategic planning in related areas.
2. Time-Series Change Characteristics of Regional FES Levels
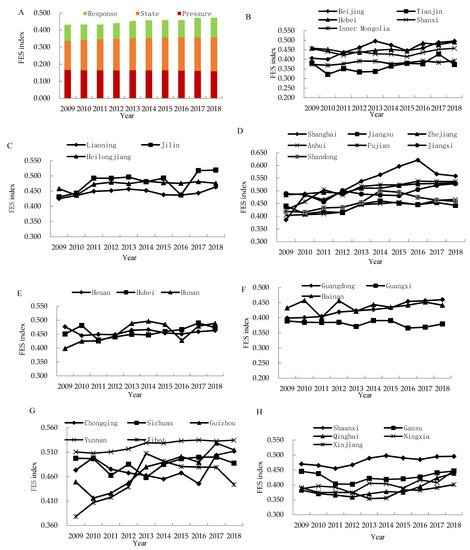
| Area | Province | 2009 | 2010 | 2011 | 2012 | 2013 | 2014 | 2015 | 2016 | 2017 | 2018 |
|---|---|---|---|---|---|---|---|---|---|---|---|
| North area | Beijing | 0.406 | 0.401 | 0.437 | 0.462 | 0.495 | 0.474 | 0.446 | 0.459 | 0.489 | 0.495 |
| Tianjin | 0.381 | 0.322 | 0.351 | 0.334 | 0.337 | 0.365 | 0.379 | 0.377 | 0.428 | 0.373 | |
| Hebei | 0.459 | 0.453 | 0.438 | 0.437 | 0.448 | 0.453 | 0.445 | 0.485 | 0.477 | 0.491 | |
| Shanxi | 0.456 | 0.440 | 0.421 | 0.440 | 0.429 | 0.427 | 0.414 | 0.436 | 0.452 | 0.458 | |
| Inner Mongolia | 0.374 | 0.369 | 0.377 | 0.391 | 0.391 | 0.377 | 0.382 | 0.392 | 0.384 | 0.392 | |
| Northeast area | Liaoning | 0.425 | 0.435 | 0.449 | 0.452 | 0.456 | 0.452 | 0.438 | 0.437 | 0.443 | 0.463 |
| Jilin | 0.431 | 0.443 | 0.493 | 0.492 | 0.496 | 0.481 | 0.493 | 0.437 | 0.517 | 0.519 | |
| Heilongjiang | 0.458 | 0.436 | 0.473 | 0.479 | 0.474 | 0.483 | 0.478 | 0.475 | 0.481 | 0.476 | |
| East area | Shanghai | 0.386 | 0.484 | 0.465 | 0.499 | 0.537 | 0.563 | 0.596 | 0.621 | 0.566 | 0.558 |
| Jiangsu | 0.440 | 0.410 | 0.418 | 0.415 | 0.448 | 0.460 | 0.451 | 0.446 | 0.454 | 0.443 | |
| Zhejiang | 0.485 | 0.488 | 0.494 | 0.491 | 0.511 | 0.510 | 0.521 | 0.528 | 0.529 | 0.531 | |
| Anhui | 0.403 | 0.406 | 0.409 | 0.416 | 0.446 | 0.449 | 0.455 | 0.445 | 0.463 | 0.466 | |
| Fujian | 0.426 | 0.457 | 0.504 | 0.483 | 0.517 | 0.523 | 0.523 | 0.538 | 0.537 | 0.537 | |
| Jiangxi | 0.489 | 0.485 | 0.457 | 0.501 | 0.487 | 0.483 | 0.481 | 0.505 | 0.522 | 0.528 | |
| Shandong | 0.419 | 0.416 | 0.433 | 0.435 | 0.455 | 0.500 | 0.495 | 0.475 | 0.463 | 0.459 | |
| Central area | Henan | 0.476 | 0.445 | 0.449 | 0.448 | 0.464 | 0.466 | 0.454 | 0.451 | 0.459 | 0.463 |
| Hubei | 0.450 | 0.481 | 0.429 | 0.440 | 0.449 | 0.447 | 0.459 | 0.466 | 0.490 | 0.473 | |
| Hunan | 0.398 | 0.425 | 0.426 | 0.443 | 0.489 | 0.496 | 0.485 | 0.427 | 0.479 | 0.489 | |
| South area | Guangdong | 0.399 | 0.401 | 0.404 | 0.419 | 0.423 | 0.427 | 0.433 | 0.454 | 0.456 | 0.460 |
| Guangxi | 0.389 | 0.385 | 0.384 | 0.385 | 0.371 | 0.391 | 0.391 | 0.366 | 0.369 | 0.379 | |
| Hainan | 0.433 | 0.457 | 0.401 | 0.457 | 0.422 | 0.444 | 0.435 | 0.442 | 0.452 | 0.442 | |
| Southwest area | Chongqing | 0.473 | 0.499 | 0.475 | 0.468 | 0.462 | 0.455 | 0.468 | 0.445 | 0.504 | 0.512 |
| Sichuan | 0.498 | 0.497 | 0.463 | 0.485 | 0.458 | 0.485 | 0.497 | 0.500 | 0.500 | 0.488 | |
| Guizhou | 0.449 | 0.416 | 0.426 | 0.448 | 0.480 | 0.489 | 0.501 | 0.490 | 0.529 | 0.515 | |
| Yunnan | 0.511 | 0.508 | 0.511 | 0.517 | 0.529 | 0.529 | 0.533 | 0.535 | 0.533 | 0.535 | |
| Tibet | 0.378 | 0.407 | 0.418 | 0.439 | 0.507 | 0.492 | 0.481 | 0.480 | 0.479 | 0.444 | |
| Northwest area | Shaanxi | 0.470 | 0.465 | 0.455 | 0.467 | 0.489 | 0.498 | 0.490 | 0.485 | 0.495 | 0.496 |
| Gansu | 0.445 | 0.438 | 0.404 | 0.402 | 0.422 | 0.419 | 0.421 | 0.427 | 0.441 | 0.446 | |
| Qinghai | 0.383 | 0.371 | 0.366 | 0.359 | 0.370 | 0.378 | 0.375 | 0.394 | 0.424 | 0.439 | |
| Ningxia | 0.387 | 0.396 | 0.392 | 0.373 | 0.405 | 0.404 | 0.389 | 0.416 | 0.408 | 0.448 | |
| Xinjiang | 0.391 | 0.374 | 0.375 | 0.374 | 0.354 | 0.356 | 0.383 | 0.382 | 0.391 | 0.401 | |
| China | China | 0.431 | 0.433 | 0.432 | 0.440 | 0.452 | 0.457 | 0.458 | 0.459 | 0.471 | 0.472 |
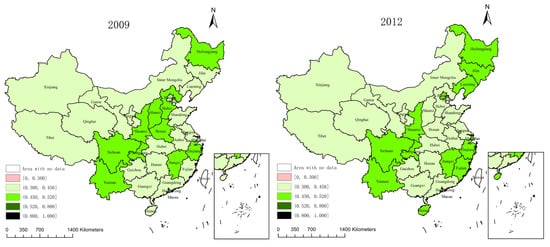
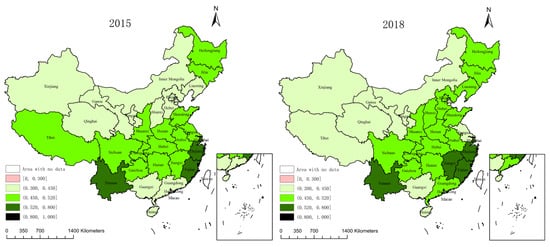
3. Spatial Differences of FES in Provinces
4. Diagnosis of Barrier Factor
| Province | Index Ranking (Obstacle Factor/Obstacle Degree) | Province | Index Ranking (Obstacle Factor/Obstacle Degree) | ||||||||
|---|---|---|---|---|---|---|---|---|---|---|---|
| 1 | 2 | 3 | 4 | 5 | 1 | 2 | 3 | 4 | 5 | ||
| Beijing | X1 | X5 | X14 | X10 | X8 | Hubei | X14 | X5 | X13 | X1 | X4 |
| 18.88 | 14.93 | 13.32 | 12.41 | 11.23 | 12.46 | 12.44 | 11.11 | 10.67 | 10.52 | ||
| Tianjin | X4 | X1 | X5 | X8 | X14 | Hunan | X5 | X14 | X13 | X10 | X8 |
| 17.80 | 14.41 | 12.05 | 9.10 | 8.99 | 14.17 | 11.81 | 11.29 | 10.88 | 10.74 | ||
| Hebei | X4 | X5 | X13 | X8 | X10 | Guang-dong | X14 | X1 | X5 | X13 | X10 |
| 16.03 | 15.63 | 11.42 | 11.11 | 10.27 | 13.67 | 13.29 | 12.16 | 11.52 | 9.99 | ||
| Shanxi | X4 | X5 | X13 | X10 | X8 | Guangxi | X14 | X12 | X2 | X5 | X10 |
| 17.42 | 13.18 | 11.19 | 10.75 | 10.70 | 12.80 | 11.91 | 11.03 | 10.78 | 9.93 | ||
| Inner Mongolia | X4 | X14 | X10 | X13 | X5 | Hainan | X14 | X12 | X13 | X10 | X8 |
| 14.99 | 12.61 | 10.46 | 10.42 | 9.87 | 15.32 | 11.23 | 11.21 | 10.97 | 10.06 | ||
| Liaoning | X14 | X1 | X5 | X13 | X8 | Chong-qing | X1 | X5 | X13 | X10 | X8 |
| 13.68 | 12.64 | 11.92 | 11.69 | 10.73 | 13.11 | 12.31 | 12.15 | 11.58 | 11.44 | ||
| Jilin | X14 | X10 | X13 | X8 | X1 | Sichuan | X14 | X13 | X4 | X8 | X10 |
| 16.71 | 13.31 | 12.84 | 12.01 | 10.83 | 14.90 | 11.98 | 11.46 | 11.23 | 11.21 | ||
| Heilongjiang | X14 | X10 | X13 | X8 | X1 | Guizhou | X14 | X5 | X10 | X13 | X8 |
| 16.37 | 12.37 | 11.98 | 11.24 | 10.67 | 13.53 | 13.36 | 12.48 | 11.81 | 11.43 | ||
| Shanghai | X4 | X1 | X14 | X5 | X9 | Yunnan | X14 | X13 | X10 | X8 | X11 |
| 24.34 | 22.12 | 15.89 | 14.70 | 5.91 | 17.05 | 13.52 | 13.01 | 12.59 | 10.20 | ||
| Jiangsu | X4 | X14 | X1 | X5 | X10 | Tibet | X4 | X14 | X12 | X13 | X10 |
| 18.89 | 13.33 | 12.59 | 12.27 | 10.35 | 20.04 | 15.41 | 12.82 | 11.47 | 11.39 | ||
| Zhejiang | X14 | X1 | X5 | X13 | X8 | Shaanxi | X14 | X5 | X13 | X8 | X1 |
| 17.68 | 14.73 | 14.39 | 13.04 | 10.84 | 13.56 | 12.43 | 12.16 | 11.50 | 10.49 | ||
| Anhui | X4 | X14 | X5 | X13 | X10 | Gansu | X4 | X5 | X13 | X8 | X10 |
| 14.57 | 13.23 | 11.51 | 10.95 | 9.38 | 20.41 | 11.85 | 10.99 | 10.59 | 9.35 | ||
| Fujian | X14 | X1 | X10 | X13 | X8 | Qinghai | X4 | X5 | X14 | X13 | X8 |
| 16.43 | 13.89 | 13.43 | 12.93 | 11.15 | 22.16 | 15.95 | 11.33 | 11.21 | 10.61 | ||
| Jiangxi | X14 | X5 | X13 | X10 | X8 | Ningxia | X4 | X5 | X13 | X8 | X1 |
| 15.48 | 13.88 | 13.04 | 12.66 | 11.63 | 20.01 | 16.08 | 11.12 | 10.33 | 9.80 | ||
| Shandong | X4 | X5 | X14 | X1 | X11 | Xinjiang | X4 | X14 | X5 | X13 | X8 |
| 18.54 | 13.86 | 11.15 | 10.62 | 8.69 | 21.08 | 12.18 | 11.02 | 10.39 | 9.75 | ||
| Henan | X4 | X14 | X5 | X13 | X8 | ||||||
| 16.20 | 12.40 | 12.00 | 11.28 | 10.05 | |||||||
In the central area, the main obstacle factors affecting FES in Henan are the forest coverage rate, the proportion of new afforestation and the volume of forest per unit area. Henan, as a large food production province with a long history, has few forest resources, so insufficient investment in forest resources could easily have an adverse impact on its FES. The low level of the proportion of new afforestation, forest stock per unit area and forestry investment intensity are the main factors that hinder the improvement of FES in Hubei and Hunan, indicating that the maintenance and improvement of FES response indexes in Hubei and Hunan has not been in place.
The proportion of newly increased afforestation is the primary obstacle factor in South area, showing that the overall afforestation area in the South area needs to be further strengthened. Guangdong’s economy has developed rapidly over years, with urbanization being an important factor that hinders the improvement of its FES. The important obstacle factors of FES in Guangxi and Hainan include the rate of pest control in forestry and the proportion of the number of scientific and technological exchange personnel to the total number of forestry units. Those two provinces have abundant forest resources, but their economic development speeds are slightly backward compared with other provinces, resulting in insufficient technology and talent responses in these two provinces.
In the southwest area, the primary obstacle factor of FES in Chongqing is the ratio of urbanization, indicating that the acceleration of the urbanization process is not conducive to the maintenance of FES. In addition, the decline of forest stock per unit area and forestry investment intensity also restricts the improvement of FES level in Chongqing.
The primary obstacle factor of FES in Sichuan, Guizhou, and Yunnan is the proportion of new afforestation, showing that the reduction of afforestation restricts the improvement of their FES levels. The decline of the intensity of forestry investment, the value of forestry output per unit of forest area, and the proportion of forestry science and technological exchange personnel to the total number of forestry units are also important factors hindering the improvement of FES levels in these provinces. The above-mentioned areas are rich in forest resources, but it is necessary to maintain forest resources and develop forestry industries. The low forest coverage rate is the most important factor restricting the FES in Tibet, the largest forest area in China, indicating that the quality of Tibet’s forests needs to be further improved. At the same time, the reduction of the proportion of new afforestation and the intensity of forestry investment are also the main factors affecting Tibet’s FES, indicating that the response level of FES in Tibet still needs to be further strengthened.
The indicators including forest coverage rate, new afforestation proportion, forest stock per unit area, forestry investment intensity, and forestry output value per unit area are the main factors affecting the FES level in northwest area. The forest resources in the Northwest area are relatively small and the ecology there is relatively fragile. The obstacle factors all involve forest ecological state and response indicators, indicating that it is necessary for northwest area to expand the area of artificial forests, improve the level of forest management and protection, and further enhance the forest quality, so as to alleviate the conflict between forest ecology and economic development in the region.
References
- Chen, S.; Shahi, C.; Chen, H.Y.H. Economic and ecological trade-off analysis of forest ecosystems: Options for boreal forests. Environ. Rev. 2016, 24, 348–361.
- Tidwell, T.L. Nexus between food, energy, water, and forest ecosystems in the USA. J. Environ. Stud. Sci. 2016, 6, 214–224.
- Magalhães, J.L.L.; Lopes, M.A.; de Queiroz, H.L. Development of a Flooded Forest Anthropization Index (FFAI) applied to Amazonian areas under pressure from different human activities. Ecol. Indic. 2015, 48, 440–447.
- Chen, H.; Zhang, S.M.; Shi, G.H.; Gao, Y.W.; Wang, Q.F.; Zhang, F.C. Mechanism of increased N content in controlling the M-A constituent of low-carbon Mo-V-N steel. Mater. Lett. 2017, 189, 136–139.
- Wang, H.; He, M.Y.; Ran, N.; Xie, D.; Wang, Q.; Teng, M.; Wang, P. China’s Key Forestry Ecological Development Programs: Implementation, Environmental Impact and Challenges. Forests 2021, 12, 101.
- Solomon, D.; Lehmann, J.; Zech, W. Land use effects on soil organic matter properties of chromic luvisols in semi-arid northern Tanzania: Carbon, nitrogen, lignin and carbohydrates. Agric. Ecosyst. Environ. 2000, 78, 203–213.
- Yang, Y.J.; Song, G.; Lu, S. Assessment of land ecosystem health with Monte Carlo simulation: A case study in Qiqihaer, China. J. Clean. Prod. 2020, 250.
- Wen, J.; Hou, K. Research on the progress of regional ecological security evaluation and optimization of its common limitations. Ecol. Indic. 2021, 127, 107797.
- Wang, D.C.; Chen, J.H.; Zhang, L.H.; Sun, Z.C.; Wang, X.; Zhang, X.; Zhang, W. Establishing an ecological security pattern for urban agglomeration, taking ecosystem services and human interference factors into consideration. PeerJ 2019, 7.
- Liu, T.; Wang, H.Z.; Wang, H.Z.; Xu, H. The spatiotemporal evolution of ecological security in China based on the ecological footprint model with localization of parameters. Ecol. Indic. 2021, 126.
- Lu, S.S.; Qin, F.; Chen, N.; Yu, Z.Y.; Xiao, Y.M.; Cheng, X.Q.; Guan, X.L. Spatiotemporal differences in forest ecological security warning values in Beijing: Using an integrated evaluation index system and system dynamics model. Ecol. Indic. 2019, 104, 549–558.
- Sun, J.; Li, Y.P.; Gao, P.P.; Xia, B.C. A Mamdani fuzzy inference approach for assessing ecological security in the Pearl River Delta urban agglomeration, China. Ecol. Indic. 2018, 94, 386–396.
- Hu, M.M.; Li, Z.T.; Yuan, M.J.; Fan, C.; Xia, B.C. Spatial differentiation of ecological security and differentiated management of ecological conservation in the Pearl River Delta, China. Ecol. Indic. 2019, 104, 439–448.
- Xie, H.L.; He, Y.F.; Xie, X. Exploring the factors influencing ecological land change for China’s Beijing-Tianjin-Hebei Region using big data. J. Clean. Prod. 2017, 142, 677–687.
- Xu, L.Y.; Yin, H.; Li, Z.; Li, S. Land Ecological Security Evaluation of Guangzhou, China. Int. J. Environ. Res. Public Health 2014, 11, 10537–10558.
- Wu, L.; Xie, B.G. The variation differences of cultivated land ecological security between flatland and mountainous areas based on LUCC. PLoS ONE 2019, 14, e0220747.
- Zhang, Q.; Wang, G.Y.; Mi, F.; Zhang, X.C.; Xu, L.Z.; Zhang, Y.F.; Jiang, X.L. Evaluation and scenario simulation for forest ecological security in China. J. For. Res. 2019, 30, 1651–1666.
- Zhang, Z.G. Measuring model and criterion of forestry ecological security by symbiotic coupling method. China Popul. Resour. Environ. 2014, 24, 90–99. (In Chinese)
- Li, Q.J.; Chen, S.Z.; Zhao, R. Study on Evaluation of Timber Security in China Based on the PSR Conceptual Model. Forests 2020, 11, 517.
- Guan, X.L.; Wei, H.K.; Lu, S.S.; Dai, Q.; Su, H.J. Assessment on the urbanization strategy in China: Achievements, challenges and reflections. Habitat Int. 2018, 71, 97–109.
- Huang, J.; Hu, Y.; Zheng, F. Research on recognition and protection of ecological security patterns based on circuit theory: A case study of Jinan City. Environ. Sci. Pollut. Res. 2020, 27, 12414–12427.
- Peng, J.; Yang, Y.; Liu, Y.X.; Hu, Y.N.; Du, Y.Y.; Meersmans, J.; Qiu, S.J. Linking ecosystem services and circuit theory to identify ecological security pattern. Sci. Total Environ. 2018, 644, 781–790.
- Cai, X.T.; Zhang, B.; Lyu, J.H. Endogenous Transmission Mechanism and Spatial Effect of Forest Ecological Security in China. Forests 2021, 12, 508.
- Chen, N.; Qin, F.; Zhai, Y.X.; Cao, H.P.; Zhang, R.; Cao, H.P. Evaluation of coordinated development of forestry management efficiency and forest ecological security: A spatiotemporal empirical study based on China’s provinces. J. Clean. Prod. 2020, 260.
- Chu, X.; Deng, X.Z.; Jin, G.; Wang, Z.; Li, Z.H. Ecological security assessment based on ecological footprint approach in Beijing-Tianjin-Hebei region, China. Phys. Chem. Earth 2017, 101, 43–51.
- Li, F.Z.; Lu, S.S.; Sun, Y.N.; Li, X.; Xi, B.Y.; Liu, W.Q. Integrated Evaluation and Scenario Simulation for Forest Ecological Security of Beijing Based on System Dynamics Model. Sustainability 2015, 7, 13631–13659.
- Lu, S.S.; Tang, X.; Guan, X.L.; Qin, F.; Liu, X.; Zhang, D.H. The assessment of forest ecological security and its determining indicators: A case study of the Yangtze River Economic Belt in China. J. Environ. Manag. 2020, 258, 110048.
- Tang, X.; Guan, X.L.; Lu, S.S.; Qin, F.; Liu, X.; Zhang, D.H. Examining the spatiotemporal change of forest resource carrying capacity of the Yangtze River Economic Belt in China. Environ. Sci. Pollut. Res. 2020, 27, 21213–21230.
- Wang, Y.R.; Zhang, D.H.; Wang, Y.H. Evaluation Analysis of Forest Ecological Security in 11 Provinces (Cities) of the Yangtze River Economic Belt. Sustainability 2021, 13, 4845.
- Cai, X.T.; Jiang, Y. Evolution of space-time pattern of Chinese forest ecological security and its obstacle factor diagnosis. Stat. Decis. 2019, 35, 96–100. (In Chinese)
- Chen, D.J.; Qu, W.L.; Li, Y.C.; Wu, X.Z.; Gou, S.P. Study on forest ecological dynamic security in Gansu province. Acta Prataculturae Sin. 2016, 25, 188–193. (In Chinese)
- Wang, L.; Bian, Z.F.; Chen, H.Q. Land ecological security assessment for Yancheng city based on catastrophe theory. Earth Sci. Res. J. 2014, 18, 181–187.
- Li, Z.T.; Li, M.; Xia, B.C. Spatio-temporal dynamics of ecological security pattern of the Pearl River Delta urban agglomeration based on LUCC simulation. Ecol. Indic. 2020, 114, 106319.
- Lu, S.S.; Li, J.P.; Guan, X.L.; Gao, X.J.; Gu, Y.H.; Zhang, D.H.; Mi, F.; Li, D.D. The evaluation of forestry ecological security in China: Developing a decision support system. Ecol. Indic. 2018, 91, 664–678.

