1. Zero-waste city (ZWC) Policies and Pilot City Conditions
1.1. ZWC Policy Framework of China
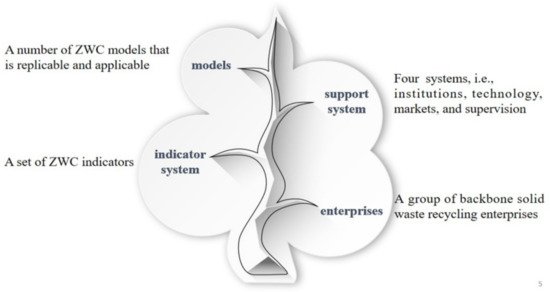
According to Chinese government documents, a “1-1-4-1” action plan, shown in
Figure 1, was proposed to realize the objective of building a ZWC. The name of the plan refers to a set of ZWC indicators, a group of backbone solid waste recycling enterprises, four systems, i.e., institutions, technology, markets, and supervision, and several ZWC models, which are replicable and applicable
[1]. The index system of ZWC construction (trial) was issued by MEE, including 5 first-level indicators, 18 second-level indicators and 59 third-level indicators.
Figure 1. The main objective content of ZWC action plan.
Four principles should be strictly complied with in the implementation of the ZWC plan. (1) Solve prominent problems, such as large production, poor utilization, illegal transfer and dumping, and difficulties in disposal of solid waste. (2) Identify the weak points and key links in the production, collection, transfer, utilization, and disposal of major solid waste. (3) Integrate empirical approaches and techniques to manage solid waste in a pilot demonstration. (4) Promote simple, moderate, green, low-carbon, civilized, and healthy lifestyles and consumption patterns. The concept of ZWC does not imply that the city generates no waste at all, nor does it mean that solid waste can be fully utilized. Instead, it is a long-term exploration and practice aimed at minimizing the generation, maximizing recycling, and disposing of solid waste in the administrative region of a city.
1.2. Conditions of Pilot Cities
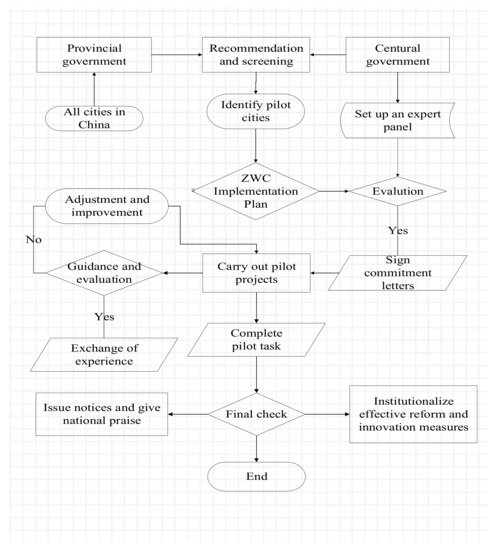
The pilot cities were recommended by the relevant provincial departments and determined by MEE in conjunction with the relevant national departments. The procedures and steps to build ZWC are illustrated in Figure 2. The selected pilot cities were required to compile the implementation plan for the construction of ZWCs, determine pilot objectives and task lists, divide tasks and allocate them to various departments, and define the detailed work to be accomplished within each time period. MEE set up an expert committee on ZWC to review the implementation plan of each pilot city, and the approved plans were printed and implemented. MEE selected 11 pilot cities. In addition, the Xiongan New Area Hebei, Beijing Economic and Technological Development Zone, Sino-Singapore Eco-City, Guangze county in Fujian province, and Ruijin city in Jiangxi province were selected as special regions to be promoted in the context of ZWC construction. Pilot cities and regions proceeded with construction tasks in accordance with the approved implementation plans.
Figure 2. Procedures for planning, implementing and evaluating ZWC.
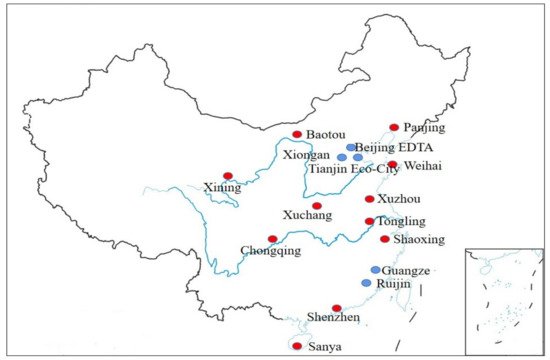
The distribution of the 11 + 5 pilot cities and regions selected is shown in Figure 3. Two factors were considered in the selection of pilot cities. First, representative cities playing a dominant role in national strategic initiatives, such as Beijing–Tianjin–Hebei integration, Yangtze Economic Belt, and Guangdong–Hong Kong–Macao Greater Bay Area, were selected. Second, considering the industrial characteristics of different areas in the eastern and western regions, as well as the enthusiasm of the local governments, cities which had implemented or were implementing various types of solid waste recycling pilot projects and had achieved positive results were selected preferentially. The selection of pilot regions is to explore the construction modes of zero waste in different regions, such as economic development zone, new development zone and county-level city, so as to promote the implementation of a national solid waste management strategy and better serve the national major development strategy.
Figure 3. Location of the 11 pilot cities and 5 special areas.
In fact, the pilot cities have different spatial and objective representativeness. First, they are distributed in different regions. Among the 11 cities, 4 are in the east, which is the highest number of pilot cities in any given region. The main reason is that they are located in the economically developed area of the Yangtze Economic Delta, which possesses a good solid waste management foundation. Other cities are more evenly distributed across different regions: two each in the south, west, and north, and one city in the middle. Of the five pilot areas, the Xiongan New Area Hebei, Beijing Economic and Technological Development Zone, and Sino-Singapore Eco-City are located in the Beijing–Tianjin–Hebei integration strategic region.
Household income, population density, and degree of urbanization have often been found to be correlated with the amount and type of solid waste production
[1][2][3][4]. Sanya has the smallest population of 615,000, while Chongqing and Shenzhen are two very big cities with a population of more than 10 million each. Most of the other cities have a population of 1~5 million. There are significant differences among the cities in terms of their levels of economic development. Xining has the lowest per capita income of CNY 52,200, which is lower than China’s per capita income of CNY 64,600. Shenzhen has the highest per capita income of CNY 189,500, which is comparable with that of developed countries. The urbanization rates of the permanent population of the pilot cities also varies significantly, from 99.7% in Shenzhen to 52.6% in Xuchang.
Furthermore, the solid waste management capacities of the pilot cities are evidently different. According to the goal of near-zero landfill in ZWCs, MSW treatment in some cities is far from the target, such as 100% landfill treatment in Xining and Baotou. However, in Chongqing, all MSW is incinerated and the landfill volume is zero. A combination of landfill and incineration was adopted in most pilot cities, with landfill rates in the range 31~64%.
2. Critical Path to ZWC and Case Study of Xuzhou City
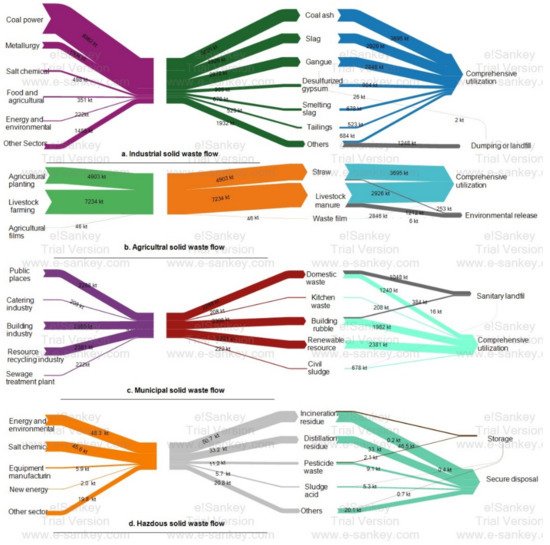
With a population of 8.76 million and an urbanization rate of 65.1%, Xuzhou has a GDP of CNY 675.5 billion and a per capita income of CNY 76,915, both of which are the median values of the 11 pilot cities. Entrusted by the Xuzhou municipal government, researchers participated in the formulation of “Implementation plan of ZWC construction in Xuzhou”. The plan has been issued by Xuzhou municipal government after being reviewed and approved by MEE experts. A thorough field investigation in several districts of Xuzhou was conducted to assess solid waste flows of life cycle process, shown in
Figure 4, and index value of solid waste
[5]. The spatial boundary is the geographical area corresponding to Xuzhou City and its ten municipal districts, and the temporal boundary is the year 2018, when the local authority provided the first substantial dataset on the city’s solid waste system. These data are assumed to be sufficiently accurate and typical to ensure acceptable and indicative material flow analysis results. The target material is all solid waste, including industrial solid waste, MSW, agricultural solid waste, and hazardous waste. The three main subsystems/processes are solid waste generation, solid waste collection, and solid waste treatment as well as final disposal. The data were collected from the municipal authority of Xuzhou and from relevant studies and reports on Xuzhou City.
Figure 4. Solid waste streams in Xuzhou.
Based on the national policy objectives and solid waste flow of Xuzhou, as well as the actual recovery and utilization rate of solid waste and the amount of landfill, five key paths of developing ZWCs are deduced and proposed creatively: solid waste reduction throughout the entire industrial chain, classification and collaborative treatment of MSW, full multiway utilization of agricultural waste, comprehensive safety control of hazardous waste flow, and optimization of institutional and market mechanisms. After the implementation of the five major paths in Xuzhou, the indicator values of solid waste management performance in 2018 and 2020, changed significantly. Moreover, a comparison of solid waste management efficiency between Kunming city and Xuzhou city, which have a similar population and economic scale, have been introduced. In 2020, the populations of Xuzhou and Kunming were 9.08 million and 8.46 million, respectively, and the Gross Domestic Products were CNY 731.9 billion and CNY 673.3 billion, respectively. Kunming has not carried out zero-waste city construction, nor implemented the corresponding paths proposed in this paper. The solid waste management index values of Kunming city are introduced in each path.
2.1. Solid Waste Reduction throughout Entire Industrial Chain
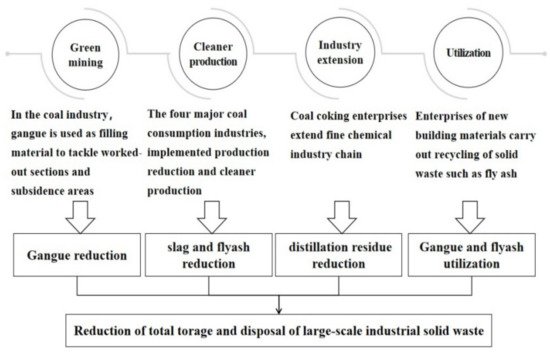
Waste reduction along the industrial chain is aimed at promoting zero growth in the total storage and disposal of large-scale industrial solid waste (ISW) through the incorporation of waste-reduction technology in all the links of the industrial chain. To achieve this goal, filling technologies will be adopted in mineral industries, and solid waste will be promoted in the mining industry to produce construction materials or address subsidence areas. Second, green design and green supply-chain management will be vigorously promoted to improve product detachability and recyclability. Third, categories of technical standards will be formulated for industrial byproducts and comprehensive utilization products, with a focus on tailings, coal gangue, fly ash, smelting slag, industrial byproduct gypsum, etc., to promote the utilization of large-scale ISW as resources.
The material flow of industrial solid waste is shown in Figure 4. The dominating industries in Xuzhou were power plants and coal mining. Correspondingly, fly ash, slag and coal gangue accounted for 27.2%, 21.6% and 21.2% of the total solid wastes, respectively. Therefore, it is necessary to implement waste reduction in the whole-process industrial chain in power plants and coal mining, so as to better reduce the generation of solid waste.
Waste reduction of the industrial chain in coal mining is shown
Figure 5. The closure of technologically backward coal mining enterprises has reduced the number of mines from more than 300 to 7. Green mine management has been implemented in all these seven mines to reduce the production of coal gangue and tailings. The steel, cement, coking coal, and thermal power industries have eliminated backward production capacities; steel and coking coal outputs have decreased by 30% and 50%, respectively. By 2018, 71% of the enterprises had implemented cleaner production, and six industrial parks had completed industrial park recycling transformation similar to ecoindustrial park construction
[6], shown in
Figure 5. A material flow analysis of core enterprises and industries such as iron and steel, coking, and the cement industry, which consume the most resources and produce the most waste, should be conducted in order to find production chain extension and industrial symbiosis opportunities, for example, waste heat recovery and utilization in the coking industry, cooperative disposal of solid waste in the cement industry, high-end building materials for solid waste utilization, and central heating in the thermoelectric industry. The relevant projects have been implemented to ultimately reduce coal consumption and improve energy and mineral resource efficiency; ISW was reduced by approximately 4.7 million tons from 2017 to 2020. Solid waste multichannel resource utilization is encouraged, such as the use of coal gangue to produce mortar ceramic granules and other building materials, as is collaborative disposal of industrial sludge. The comprehensive utilization rate of general industrial solid waste of Xuzhou city reached 98% in 2020, an increase of 8% over 2018, far exceeding China’s average of 41.7% and Kunming city’s average of 27.9%, which indicated a reduction in environmental pollution from landfills and better living conditions for urban citizens.
Figure 5. Solid waste reduction of the whole industrial chain in Xuzhou.
2.2. Source Classification and Collaborative Utilization of MSW
Improper management of MSW through open burning, open dumping, and unsanitary landfilling contributes to many environmental problems, such as global warming, ozone depletion, human health hazards, ecosystem damages, and abiotic resource depletion
[7][8][9]. As the world’s largest MSW generator, China generated around 242.062 million tons of MSW in 2019, up 6.16% year on year. China is deeply troubled by the “garbage Siege”, lacking in inadequate collection, classification, and disposal systems for MSW. The generated waste is not fully collected in some urban and rural joint areas, due to the limited collecting ability of the related government department. Therefore, source classification and collaborative utilization of MSW has been proposed to ensure that MSW is strictly classified and all kinds of waste are utilized in a coordinated manner to improve the utilization rate of waste resources and reduce environmental pollution. In addition, water separation relied on the buoyant and the sink force of water, and mechanical separation relied on size sorting and mechanical rules are adopted to supplement mixed MSW classification.
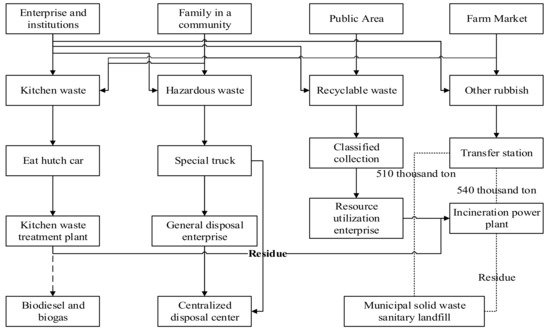
The material flow in Figure 4 are taken to evaluate the performance of MSW management. It can be seen that construction waste, renewable waste and household waste account for more than 94% of MSW in Xuzhou. The total amount of renewable waste was 2.381 million tons, all of which were recycled. Construction waste totaled 2.36 million tons, 83.8% of which was reused as building materials. More than 1.048 million tons of domestic garbage was disposed of by landfills, and the rest was incinerated, accounting for 52.8% of the total. Xuzhou is constantly exploring MSW source classification and collaborative utilization in practice, as shown in Figure 6.
Figure 6. Classification and collaborative utilization of municipal solid waste in Xuzhou.
About 21% of the communities built a classification system in which MSW is divided into kitchen waste, hazardous waste, reclaimable waste, and other garbage (Figure 6). The recycling of reclaimable waste and kitchen waste is growing rapidly. The daily volume of MSW generated was 8400 tons in 2018, including 1700 tons of recyclables and 400 tons of kitchen waste. Hence, the recycling rate of MSW is 25%. The MSW collaborative utilization project has been established. Recyclable wastes, such as plastic bottles and paper, are transformed into new products by resource utilization enterprises, while material waste and sewage sludge are transported to incineration plants to generate electricity. Kitchen waste is fermented to produce biomass fuel and natural gas, and biogas residue is transported to incineration plants to generate electricity. Other domestic waste is transported to incineration power plants and landfills. The slag generated by power plants is used to produce building materials, and the fly ash finally enters the landfill. The landfill site was equipped with a biogas power-generation project. The biogas generated by the landfill is collected by the gas well, purified and dedusted, and sent to the internal combustion generator to generate electricity. Therefore, the incineration rate of MSW in Xuzhou increased from less than 45% in 2018 to 100% by the end of 2020, realizing zero landfill of domestic waste. Kunming city, by contrast, only started classified collection in 2020, and its incineration rate is only 35%, much lower than Xuzhou’s.
3.3. Multichannel Resource Utilization of Agricultural Waste
The improper disposal of agricultural waste leads to the generation of large quantities of N
2O, SO
2, CH
4, and smoke, and the deterioration of soil and water at the regional scale
[10][11][12][13][14]. Therefore, the importance of establishing an alternative method to improve the environmental conditions cannot be neglected. The concept of multichannel resource utilization of agricultural waste entails the adoption of various green agricultural technologies, such as cyclic development mechanisms for planting and breeding, and energy utilization, to realize the full utilization of agricultural waste.
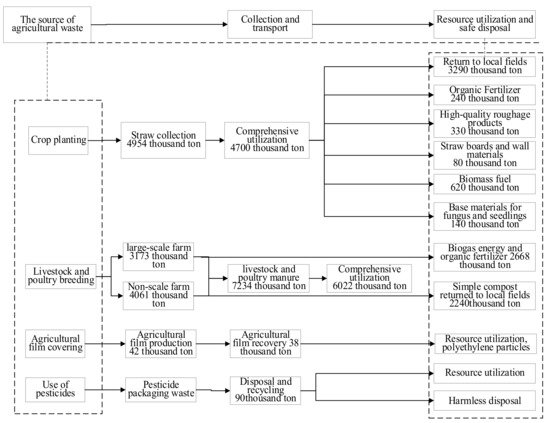
Agricultural waste flow in
Figure 4 are used to assess agricultural waste management. Xuzhou city had initially established an agricultural waste utilization model, shown in
Figure 7. In 2018, approximately 2.24 million tons of manure from non-large-scale farmers were composted in nearby fields for fertilizer production. A total of 2.688 million tons of biomass energy and organic fertilizers were produced from large-scale livestock and poultry manure, with a comprehensive utilization rate of 83.25%. Most of the straw, approximately 3.29 million tons, was returned to the fields onsite. The remainder was used to produce 620,000 tons of fuel, 330,000 tons of fodder, 240,000 tons of fertilizer, 140,000 tons of base material, and 80,000 tons of raw materials. The comprehensive utilization rate of straw reached 94.86%, far exceeding China’s 2020 target of 85% as determined by the action plan to address agricultural and rural pollution control
[15]. Agricultural film was recycled to produce plastic particles, and the recovery rate reached 75.8%. The coverage ratio of agricultural waste collection, storage and transportation systems and the comprehensive utilization rate of livestock and poultry manure in 2020 reached 98% and 95.6%, respectively, 15% and 12.3% higher than 2018. The government of Yunnan Province and Kunming city started the resource utilization of poultry breeding waste in December 2017, adopting a similar path proposed in this paper, i.e., multichannel resource utilization, which achieved remarkable results similarly to Xuzhou, with the resource utilization rate reaching 94%.
Figure 7. Multichannel utilization of agricultural waste in Xuzhou.
3.4. Comprehensive Safety Control of Hazardous Waste Flow
A comprehensive safety control of hazardous waste flow is proposed, i.e., the entire process of generation, storage, transfer, utilization, and disposal of hazardous waste is strictly managed to ensure safe disposal of waste. First, new construction projects entailing hazardous waste generation should strictly implement management requirements, such as environmental impact assessment guidelines for hazardous waste in construction projects, clarify management targets and pollution sources, prevent secondary pollution, and control environmental risks. Second, assessment requirements for the standardized management of hazardous waste should be strictly implemented to strengthen ongoing- and post-supervision, and control of the generation, recycling, transfer, storage, and disposal of hazardous waste. Third, the requirements for controlling secondary pollution in the process of hazardous waste disposal and protecting the environment during resource utilization should be clarified, and the limits of toxic and hazardous substances in resource utilization products should be specified to promote the safe use of hazardous waste.
It can be seen from Figure 4 that the hazardous wastes in Xuzhou mainly come from the energy environment and the salt chemical industry, and the incineration residue and rectification residue generated account for 77.2% of the total amount of hazardous wastes. The total amount of hazardous waste produced in 2018 was about 121,700 tons, and the incineration and landfill disposal capacity of hazardous waste is about 459,500 tons, far exceeding the amount of hazardous waste produced. Therefore, the focus of hazardous waste management is to ensure that hazardous waste is collected and disposed of.
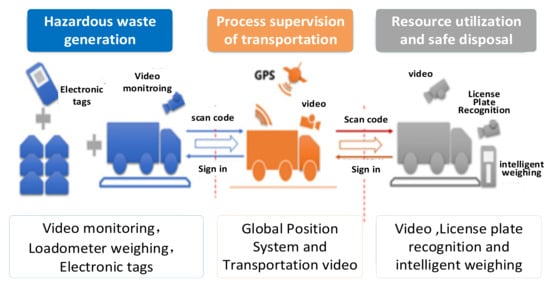
Xuzhou has established a supervision system for the generation, storage, transfer, utilization, and disposal of hazardous waste, which is shown in Figure 8. The enterprises concerned use loadometers to regularly weigh the hazardous waste produced and attach a distinguishing mark and electronic labels to the packaging containers to identify the type and production volume. The combined hazardous waste transfer form and electronic tag scanning code are supplied to the transportation vehicles, which are equipped with global positioning systems and on-board videos for positioning and monitoring. The hazardous waste disposal enterprise, which obtains its license only after its disposal technology meets the standards as verified by the environmental protection department, checks the waste information of the transportation vehicles through electronic tag scanning, video monitoring, and license plate recognition systems to ensure that the hazardous waste indeed originated from the enterprise specified and is finally disposed of safely. In 2020, the safe disposal ratio of hazardous waste and coverage ratio of medical waste collection and disposal system was 100%, and the pass rate for standardized management of hazardous waste was 97.3%, which indicates little illegal diversion or dumping of hazardous waste. Similarly, Kunming has adopted a strict hazardous waste management strategy since December 2019, that is, control of the whole process of hazardous waste generation, transfer and disposal has been implemented, and the utilization rate of industrial hazardous waste disposal reached 94.4%.
Figure 8. Comprehensive safety control of hazardous waste flows in Xuzhou.
3.5. Optimization of Institutional and Market Mechanisms
Optimization of institutional and market mechanisms refers to the solving of the problems of decentralization of solid waste management functions and lack of market vitality based on regulations or policies. A list of responsibilities for the relevant departments should be established to clarify further their responsibilities and boundaries pertaining to the generation, collection, transfer, recycling, and disposal of solid waste, to enhance their regulatory capacities. The solid waste generation, recycling, and disposal enterprises should be included in the scope of corporate environmental credit evaluation, and cross-department joint punishment should be implemented according to the evaluation results.
Measures for the collection and management of fees for the treatment of MSW have been introduced. Stipulating that units and individuals must pay a fee for the treatment of MSW reduces government subsidy funds and is beneficial to sustainable MSW treatment. Approximately 59% of the enterprises producing, utilizing, and disposing solid waste in 2018 and 71% in 2020 have been included in the scope of enterprise environmental credit evaluation. The environmental behavior of these enterprises in the previous year are evaluated and the results are divided into five grades: green, blue, yellow, red, and black. The different grades merit different treatments in terms of financial support, such as tax incentives and different water and electricity prices. For instance, enterprises in the red and black grades incur additional electricity charges of USD 0.05/kWh and USD 0.1/kWh, respectively. Therefore, this will render costs prohibitive for these companies and indirectly affect the economic behavior of local businesses.
 +1 credit