Your browser does not fully support modern features. Please upgrade for a smoother experience.
Submitted Successfully!
 +1 credit
Thank you for your contribution! You can also upload a video entry or images related to this topic.
For video creation, please contact our Academic Video Service.
| Version | Summary | Created by | Modification | Content Size | Created at | Operation |
|---|---|---|---|---|---|---|
| 1 | Zhen Zhu | + 5088 word(s) | 5088 | 2021-12-02 07:21:40 | | | |
| 2 | Catherine Yang | Meta information modification | 5088 | 2021-12-10 10:03:10 | | |
Video Upload Options
We provide professional Academic Video Service to translate complex research into visually appealing presentations. Would you like to try it?
Cite
If you have any further questions, please contact Encyclopedia Editorial Office.
Zhu, Z. Single-Cell Impedance Sensing Technology. Encyclopedia. Available online: https://encyclopedia.pub/entry/16975 (accessed on 25 July 2026).
Zhu Z. Single-Cell Impedance Sensing Technology. Encyclopedia. Available at: https://encyclopedia.pub/entry/16975. Accessed July 25, 2026.
Zhu, Zhen. "Single-Cell Impedance Sensing Technology" Encyclopedia, https://encyclopedia.pub/entry/16975 (accessed July 25, 2026).
Zhu, Z. (2021, December 10). Single-Cell Impedance Sensing Technology. In Encyclopedia. https://encyclopedia.pub/entry/16975
Zhu, Zhen. "Single-Cell Impedance Sensing Technology." Encyclopedia. Web. 10 December, 2021.
Copy Citation
Electrical impedance sensing technology has become a powerful tool, allowing for rapid, non-invasive, and label-free acquisition of electrical parameters of single cells. These electrical parameters, i.e., equivalent cell resistance, membrane capacitance and cytoplasm conductivity, are closely related to cellular biophysical properties and dynamic activities, such as size, morphology, membrane intactness, growth state, and proliferation.
electrical impedance spectroscopy
1. IFC to Detect Flowing Single Cells
Recent IFC devices applied in single-cell analysis are summarized in Table 1. These applications, discussed in this subsection, are simply classified according to cell species, including blood cells [1][2][3][4][5], tumor cells [6][7][8][9][10][11][12][13][14][15], stem cells [16][17][18][19][20], plant cells [21][22][23][24][25][26] and microbes [27][28][29][30][31][32][33][34][35][36][37]. In terms of blood cells, researchers focused on the identification and counting of normal or diseased blood cells. Studies showed the capability of IFC devices in recognition of different types of dissociated tumor cells (DTCs) [6][11][13][14] or circulating tumor cells (CTCs) [7][8][12][15]. As for stem cells, the main focus is the impedance measurement of their long-term differentiation process. Studies of plant cells include the detection of pollen viability [22][23][24][25][26] and cell screening [21]. Besides, impedance measurements of microbes are further classified and discussed.
Table 1. Applications of IFC for single-cell analysis.
| Category | First Author (Year) |
Electrode and Fluidic Layouts | Frequency | Target Cells | Application | Ref. |
|---|---|---|---|---|---|---|
| Blood cells |
Holmes (2010) | 2 coplanar electrode pairs | 503 kHz and 10 MHz | CD4 T-cells | Cell counting | [3] |
| Du (2013) | 1 coplanar electrode pair | 2 MHz | Red blood cells | Detection of malaria-infected cells | [4] | |
| Hassan (2016) | 2 coplanar electrode pairs | 303 kHz and 1.7 MHz |
CD4 and CD8 T-cells | Cell counting | [2] | |
| Liu (2018) | 2 coplanar electrode pairs | 156 kHz, 500 kHz and 3 MHz | Red blood cells | Detection of sickle cells | [1] | |
| Honrdo (2018) | 2 facing electrode pairs, fluorescence detection |
2–8 MHz | Red blood cells | Detection of malaria-infected cells | [5] | |
| Tumor cells |
Choi (2013) | Two polyelectrolyte gel electrodes |
DC | OVCAR-3 cells | Cell recognition | [8] |
| Spencer (2014) | 2 facing electrode pairs | 0.5 MHz and 2 MHz | MCF-7 cells | Cell recognition | [7] | |
| Han (2015) | 2 facing electrode pairs | 500 kHz and 10 MHz | DLD-1 cells | Cell recognition | [9] | |
| Zhao (2016) | μCPC with constriction channel | 1 kHz and 100 kHz | A549 and H1299 cells | Cell screening | [10] | |
| Desai (2019) | 2 coplanar electrode pairs, sheath flow focusing |
250 kHz | Thyroid, breast, lung, and ovarian cancer cells |
Cell recognition | [11] | |
| Ren (2019) | 1 coplanar electrode pair, 2 constriction channels |
1 kHz, 10 kHz, 100 kHz, and 1 MHz |
MDA-MB-231 cells | Cell recognition | [12] | |
| McGrath (2020) | 5 facing electrode pairs | 500 kHz–50 MHz | Six types of pancreatic ductal adenocarcinoma cell |
Cell screening | [13] | |
| Ostermann (2020) | 2 facing electrode pairs | 6 MHz | U937 cells | Viability assay | [14] | |
| Zhang (2020) | 1 coplanar electrode pair, asymmetrical constriction channel |
100 kHz and 250 kHz | A549 and Hep G2 cells | Cell screening | [6] | |
| Stem cells |
Song (2016) | C-shaped arranged coplanar electrodes |
500 kHz and 3 MHz | Mesenchymal stem cells | Monitoring differentiation process |
[18] |
| Xavier (2017) | 2 facing electrode pairs, fluorescence detection |
500 Hz and 2MHz | Skeletal stem cells | Monitoring differentiation process |
[20] | |
| Plant cells |
Heidmann (2016) | 2 facing electrode pairs | 500 Hz and 12 MHz | Tobacco pollen | Viability assay | [22] |
| Heidmann (2017) | 2 facing electrode pairs | 500 kHz, 3 MHz and 12 MHz |
Tomato, pepper, potato and wind pollinators pollen |
Viability assay | [23] | |
| Impe (2019) | 2 facing electrode pairs | 1 MHz | Wheat pollen | Viability assay | [24] | |
| Ascari (2020) | 2 facing electrode pairs | 2 MHz and 8 MHz | Hazelnut pollen | Viability assay | [25] | |
| Canonge (2020) | 2 facing electrode pairs | 500 kHz and 12 MHz | Wheat microspore | Monitoring androgenesis process |
[26] | |
| Han (2020) | 2 coplanar electrode pairs, constriction channel |
500 kHz and 5 MHz | Herbaceous Arabidopsis thaliana and woody Populus trichocarpa |
Cell screening | [21] | |
| Microbes | Choi (2014) | 2 polyelectrolytic gel electrodes, sheath focusing |
DC | F. tularensis and E. coli | Cell recognition | [28] |
| Mcgrath (2017) | 2 facing electrode pairs | 250 kHz, 18.3 MHz and 50 MHz |
C. parvum | Viability assay | [32] | |
| Guler (2018) | 1 coplanar electrode pairs | 2 MHz | E. coli | Cell recognition | [31] | |
| Clausen (2018) | 2 coplanar electrode pairs 2 facing electrode pairs |
200 kHz and 7 MHz | E. coli | Cell recognition | [27] | |
| Chawla (2018) | 1 coplanar electrode pairs | 1.12 MHz and 1.5 MHz | S. cerevisiae cells | Monitoring cell growth rate | [33] | |
| Xie (2019) | 1 coplanar electrode pairs | 1 MHz | S. cerevisiae cells | Reproductive performance assessment |
[35] | |
| Opitz (2019) | 2 facing electrode pairs | 0.5 MHz, 10 MHz and 12 MHz |
S. cerevisiae cells | Viability assay | [34] | |
| Bertelsen (2020) | 2 facing electrode pairs | 366 kHz and 6.9 MHz | E. coli | Determination of the viability of E. coli | [36] | |
| Spencer (2020) | 4 facing electrode pairs | 5 MHz and 40 MHz | K. pneumoniae | Antimicrobial susceptibility tests | [37] |
1.1. Blood Cells
Sickle cell disease (SCD), which causes sclerosis and membrane distortion in red blood cells (RBCs), brings about variation in cellular electrical properties [38]. Liu et al. combined on-chip oxygen control onto a single IFC chip for sickle cell disease diagnosis and monitoring [1]. They measured the electrical impedance of normal cells and sick cells at three different frequencies under normoxic and hypoxic conditions, respectively. As shown in Figure 1A, normal RBCs and sickle cells were separated clearly according to the measured impedance amplitude and phase value at 156 kHz under the normoxic condition. The results suggested that electrical impedance could serve as a new parameter to diagnose sickle cell disease. Parasite invasion can alter the dielectric properties of RBCs [4][39]. Du et al. demonstrated the discrimination of normal RBCs and P. falciparum-infected RBCs through analyzing the changes in the impedance signal amplitude and phase [4]. Honrado et al. developed an IFC device integrated with fluorescence interrogation to detect the dielectric properties of RBCs infected by malaria (Figure 1(Bi)) [5]. As a result, for early-stage infection (6 h), infected cells and normal cells were not distinguishable according to their impedance signals. However, as parasite growth progressed, the membrane capacitance and cytoplasmic conductivity of infected RBCs increased and thus the discrimination between two cell populations gradually became detectable (Figure 1(Bii)).
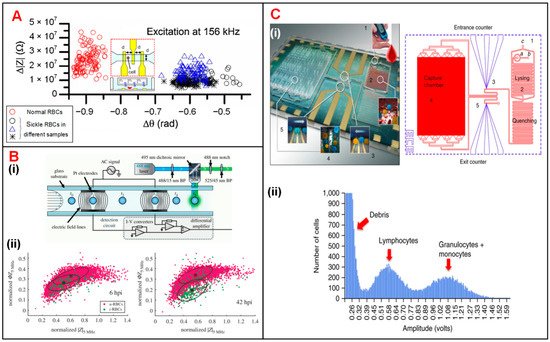
Figure 1. Blood cell analysis using IFC devices. (A) Measurement of Δ|Z| vs. Δθ for normal and sickle RBCs at 156 kHz. Reproduced from [1] with the permission from Elsevier. (B) (i) Schematics of a IFC device integrated fluorescence detection. (ii) Measurement of normalized phase (ΦZ5MHz) vs. amplitude (|Z5MHz|) at 6 h and 42 h after RBC infection. u-RBCs and i-RBCs stand for uninfected and infected RBCs. Reproduced from [5] with the permission from Royal Society. (C) (i) Photograph and layout of the differential immunocapture biochip. (ii) Pulse amplitudes of recorded impedance signals showing the size distribution of cells. Lymphocytes and granulocytes + monocytes are two groups of distinct populations of leukocytes. Reproduced from [2] with the permission from Springer Nature.
Holmes et al. discriminated and enumerated CD4 T-cells based on impedance cytometry and immune capture [3][40]. In their study, CD4 T-cells were labeled with small antibody conjugated beads, which changed the electrical properties of target T-cells. Hence, CD4 T-cells could be identified from their corresponding subpopulations based on impedance opacity (|Z10MHz|/|Z503kHz|). Recently, Hassan et al. reported an impedance biosensor based on differential immunocapture technology to perform cell counting on CD4 and CD8 T-cells with high accuracy (Figure 1(Ci)) [2][41][42]. In this device, antibodies specific to CD4 T-cells were initially adsorbed on a chamber between two conventional IFC modules. As the leukocytes flowed into the chamber, CD4 T-cells were captured and immobilized on the antibodies (Figure 1(Cii)). The cell number of each population can be calculated according to the impedance pulses caused by the passage of cells through the chamber. This protocol can be used to enumerate specific cell types with their corresponding antibodies immobilized in the capture chamber.
1.2. Tumor Cells
Tumor diagnosis is underpinned by determining which cells are malignant in acquired biopsy, leading to the need to accurately distinguish DTCs from normal cells in tissue [43]. Zhao et al. classified two tumor cell lines (A549 and H1299) based on different cellular membrane capacitance (Cm) and cytoplasm conductivity (σp) [10]. Desai et al. separated lung cancer DTCs (LC-DTCs) from RBCs, peripheral blood mononucleated cells (PBMCs) and normal lung cells based on impedance amplitude [11]. When LC-DTCs pass through the coplanar electrodes, impedance amplitude signal generates more significant pulse compared to that of normal cells. They also determined five major cancer types (lung, thyroid, breast, ovarian, and kidney cancers) from their corresponding counterpart target cells. Pancreatic ductal adenocarcinoma (PDAC) is an aggressive cancer lacking specific biomarkers. Aimed at this situation, McGrath et al. reported an IFC device to separate single PDAC tumor cells against xenografts [13]. They found that the phase of impedance signal of six PDAC cell types showed some correlations to specific gene expression, especially the KRAS mutations that led to higher phase variation. T188 and T738 are primary stage tumors with unknown KRAS mutations showing lower impedance phase contrast than other PDAC samples. Zhang et al. developed a microfluidic IFC platform with asymmetrical constriction channel to better detect the dielectric properties and diameters of different types of single tumor cells [6]. The classification accuracy between two tumor cell lines, A459 and HEP G2 cells, could be significantly improved with the combination of the individual intrinsic bioelectrical markers of membrane capacitance, cytoplasm conductivity and cell diameter. Besides, Ostermann et al. reported that necrotic and viable U937 human lymphoma cells could be clearly discriminated based on the phase of impedance signals by using a commercial IFC device [14]. Dead and viable cells can be discriminated by impedance signals at high frequency as the imaginary component of cell impedance depends on the membrane integrity of the cell (Figure 2A).
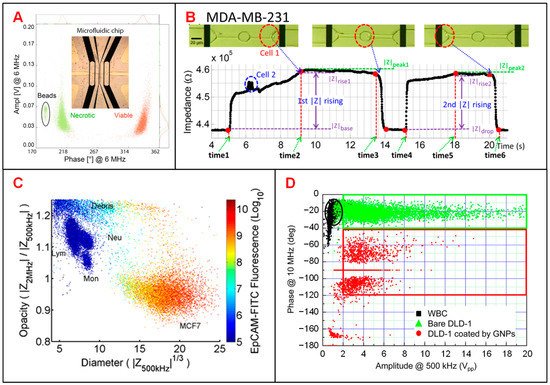
Figure 2. Tumor cell analysis using IFC devices. (A) Scatter plot of amplitude and phase values at 6 MHz for necrotic and viable U937 human lymphoma cells and 10-μm beads. Reproduced from [14] with the permission from Springer Nature. (B) Recording of the impedance variation when a breast cancer cell (MDA-MB-231) passing through the constriction channel. Reproduced from [12] with the permission from American Institute of Physics. (C) Scatter plot of opacity (|Z2MHz|/|Z500kHz|) and electric diameter (|Z500kHz|1/3) for MCF-7 cells and other blood cells. Reproduced from [7] with the permission from AIP Publishing. (D) Scatter plot of impedance amplitude (|Z10MHz|) and phase (ΦZ500kHz) to classify white blood cells, bare DLD-1 cells and DLD-1 cells coated by GNPs. Reproduced from [9] with the permission from American Chemical Society.
Identification and characterization of CTCs in blood stream is key to monitor the progression of cancer metastasis [15]. Choi et al. proposed a simple DC impedance microcytometer for identifying CTCs according to the cell volume [8]. Ren et al. reported an IFC device featuring parallel cyclic deformability channels and coplanar electrodes, to collect both biomechanical and bioelectrical properties for tumor cell analysis [12]. The deformation and transition time of tumor cells could be obtained from the time points when impedance amplitude changes abruptly (Figure 2B). In clinical application, due to the very small amount of CTCs in a blood sample, it is necessary to pre-enrich CTCs before measurement [7][9]. According to the different membrane capacitance between tumor cells and normal PBMCs, Spencer et al. measured the dielectric properties of MCF-7 cells (a representative of CTCs) at 500 kHz and 2 MHz and distinguished them from leukocytes when mixed in the whole blood [7]. Compared with optical approaches, electrical impedance measurement shows better performance in separating MCF-7 cells from other blood cells (Figure 2C). Besides, Han et al. reported a microfluidic system integrated with both enrichment and impedance detection units to discriminate CTCs [9]. In this study, immunomagnetic nanobeads (MNBs) and highly-conductive graphene nanoplates (GNPs) were bonded to the surface of DLD-1 cells (a representative colorectal cancer cell line). Compared with normal blood cells, the impedance signal of DLD-1 cells coated with GNPs shows a phase shift of 100 degrees for identification (Figure 2D), successfully.
1.3. Stem Cells
Hildebrandt et al. demonstrated that the osteogenic differentiation process of human mesenchymal stem cells (hMSCs) could be monitored by tracking their impedance variation [16]. Song et al. was the first to propose a dual-micropore microfluidic IFC device to monitor the same differentiation process (Figure 3(Ai)) [17][18]. In this device, when MSCs or osteoblasts passed through micropores, a pulse in impedance amplitude was recorded to determine the proportion of differentiated cells at each stage [18]. Moreover, a support vector machine (SVM) algorithm was employed in data analysis to reach a classification accuracy of 87%. It is notable that the training data set of SVM included a total number of 1028 impedance signals combining both relative phase at 3 MHz and impedance opacity (|Z2MHz|/|Z500kHz|). The optimal SVM-based model was also used to characterize the differentiation process (from MSCs into osteoblasts), in which the proportion of osteoblasts was increasing while that of MSCs was decreasing (Figure 3(Aii)). Zhao et al. reported that the intercellular electrical markers, such as specific membrane capacitance (Cspecific membrane) and cytoplasm conductivity (σcytoplasm) of neural stem cells could be used to evaluate their differentiation processes [19]. During different stages of differentiation, the distribution difference of Cspecific membrane differs a lot from that of σcytoplasm (Figure 3B). Besides, Xavier et al. developed an IFC device equipped with two pairs of facing electrodes combined with confocal microscopic monitoring of the osteogenic differentiation of skeletal stem cells (SSCs) (Figure 3(Ci)) [20]. The sample of human bone marrow mononuclear cells (hBMMNCs) extracted from human bone marrow (BM) were cultured in vitro and was injected into a microfluidic chip for impedance detection every two weeks. Changes in the opacity (|Z2MHz|/|Z500kHz|) of impedance data could characterize the osteoblast differentiation process of SSCs. (Figure 3(Cii)). In the first two weeks (from BM to P0), the decreased opacity corresponded to the increased cell size and membrane capacitance during SSCs osteogenic differentiation. After P0, there was no significant change of opacity indicating the completion of osteogenic differentiation.
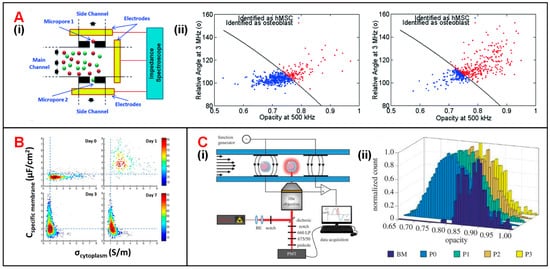
Figure 3. Stem cell analysis using IFC devices. (A) (i) Schematics of a dual-micropore based IFC device consisting of a main channel and two deputy channels through micropores. (ii) Scatter plot of signal phase at 3 MHz vs. opacity (|Z3MHz|/|Z500kHz|) for hMSCs and osteoblasts at 7 days (on the left) and 14 days (on the right) after post-induction. Reproduced from [18] with the permission from Royal Society of Chemistry. (B) Cspecific membrane and σcytoplasm variations of rat neural stem cells within the differentiation process of 7 days. Reproduced from [19] with the permission from Public Library of Science. (C) (i) Schematics of an IFC device integrated fluorescence detection. (ii) Changes of impedance signal opacity (|Z2MHz|/|Z500kHz|) within 56 days SSCs differentiation process. Reproduced from [20] with the permission from Royal Society.
1.4. Plant Cells
Qualifying pollen or spores, especially their viability and germination capacity, is important for industrial production and plant breeding [22]. Heidmann et al. measured the viability of pollen samples by using a commercial impedance device [22][23]. In one of these studies, pollen samples were measured before and after heat treatment [22]. As a result, larger phase of the impedance signal corresponding to viable samples was no longer presented after heat-inactivation, which suggested that heat treatment inactivated the pollen samples and destroyed the integrity of cell membrane. Furthermore, Heidmann et al. predicted the germination rate of tomato pollen population by measuring the amount of viable and dead pollens [23]. Impe et al. [24] and Ascari et al. [25] assessed pollen viability of hazelnut and wheat, and further identified various factors (sugar, H3BO3, CaCl2·2H2O/Ca(NO3)2·2H2O concentration and pH) affecting pollen viability with the same commercial device. Canonge et al. utilized the IFC device to track and characterize the developmental process of wheat (Triticum aestivum L.) genotype Pavon microspores in gametogenesis and anrogenesis [26]. According to this study, throughout all sporophytic developmental stages, some of the viable microspores showed a continuous increase in both impedance amplitude and phase. As a result, electrical impedance could serve as a fast and reliable reactivity marker for tracking wheat microspores in androgenesis.
The biological and physiological properties of cell wall unique to plant cells offer the potential to increase phenotyping resolution and identify nonanatomic markers [44]. Han et al. developed an IFC device to characterize the biophysical properties of two model plant species, herbaceous Arabidopsis thaliana and woody Populus trichocarpa [21]. In the regeneration process of primary cell wall (PCW), plant cells are gradually covered by the fibrillary network, which becomes thick and interlaced, resulting in the decrease of capacitance of cell membrane and PCW [45]. Thus, the researchers found that the Arabidopsis cells with regenerated PCW were less deformable and electrically conductive than that without PCW.
1.5. Microbes
IFC devices have been utilized extensively in detection, separation and viability analysis of unicellular microbes, including bacteria [27][28][29][30][31][36][37], protozoa [32][46] and fungi [33][34][35].
Bernabini et al. demonstrated the feasibility to detect bacteria according to cell size in an IFC device [29]. This device features small cross-sectional area of the flow channel and narrow width of electrodes, since the size of bacteria is usually smaller than that of mammalian cells. Without the measurement of signal phase, E. coli could be identified by volume rather than membrane capacitance, and thus E. coli was indistinguishable from particles in similar size [29]. To solve this problem, phase metric was introduced and thus the viability and species of bacteria could be determined [30]. In order to precisely measure the diameter of different bacterium, Choi reported an IFC device with position-adjustable virtual wall [28]. The movement of virtual wall is modulated by adjusting the flow rate of sample suspension focused by low conductive sheath flow. The cross-sectional area of sample flow could be adjusted to approximate that of bacteria, making the impedance changes caused by the bacteria passage more significant (Figure 4A). Recently, Guler et al. merged the amplitude and phase information of impedance signals to achieve higher size sensitivity and detection throughput of bacteria (Figure 4B) [31]. Besides, Clausen et al. used two simple IFC devices with coplanar and facing electrodes, respectively, to detect different types of bacteria [27]. These IFC devices could be used to accurately measure any change in bacteria concentration and distinguish methicillin-sensitive Staphylococcus aureus (MSSA) from E. coli according to the impedance phase signal at 8 MHz (Figure 4C). Moreover, Bertelsen et al. detected and characterized E. coli inactivated by ethanol, heat and autoclaving, respectively [36]. The population of ethanol-treated bacteria showed a similar amplitude to 1.5-μm polystyrene beads, which was consistent with the hypothesis of membrane disruption. Supported by the experimental data, ethanol treatment caused membrane disruption while heat process did no obvious harm to cell membrane. In detail, the loss of membrane integrity corresponded to changes in impedance signal amplitude and phase (Figure 4D). Notably, Spencer et al. developed a method to optimize the prescription of antibiotic by an impedance-based fast antimicrobial susceptibility test (iFAST) [37]. By applying microfluidic impedance cytometry with differential electrode configuration, the phenotype response (electrical opacity and electrical diameter) of Klebsiella pneumoniae (K. pneumoniae) to specific antibiotic was accurately analyzed.
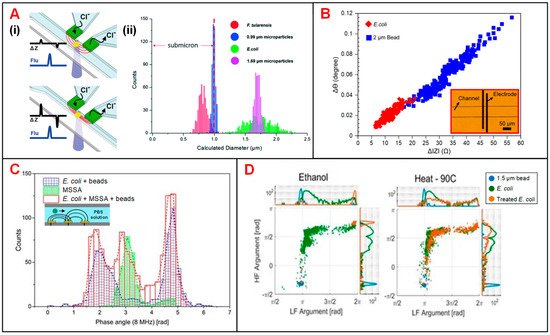
Figure 4. Bacteria analysis using IFC devices. (A) (i) Schematics of an IFC device with position-adjustable virtual wall. (ii) Histograms of bacteria and particle counts in distribution of calculated diameter derived from impedance signals. Reproduced from [28] with the permission from Royal Society of Chemistry. (B) Scatter plots of impedance signal amplitude and phase changes at 2 MHz for E. coli and 2-μm beads. Reproduced from [31] with the permission from Elsevier. (C) Histograms of cell counts in distribution of impedance signal phase at 8 MHz for E. coli, MSSA and E. coli + MSSA + beads. Reproduced from [27] with the permission from MDPI. (D) Scatter plots of impedance signal amplitude and phase at low (366 kHz) and high frequencies (6.9 MHz) for E. coli with ethanol and heat treatment. Reproduced from [36] with the permission from MDPI.
Besides, accurate recognition and viability analysis of protozoan pathogens have advanced in parasitic diseases diagnosis of human and livestock [46]. To this end, Mcgrath et al. detected single protozoan oocysts utilizing a continuous IFC system [32]. The heat treatment performed on Cryptosporidium parvum (C. parvum) lowered the impedance signal amplitude and phase especially at high frequency representing the internal properties of the oocyst (50 MHz) (Figure 5(Ai)). The difference of viable and inactive populations can be enhanced by increasing the conductivity of medium suspension. In addition, according to the amplitude at 250 kHz and phase at 18.3 MHz, the major human-pathogenic species (C. parvum, Cryptosporidium muris (C. muris) and Giardia Lamblia (G. lamblia)) were discriminated from other parasite species that posed little or no risk to human health (Figure 5(Aii)).
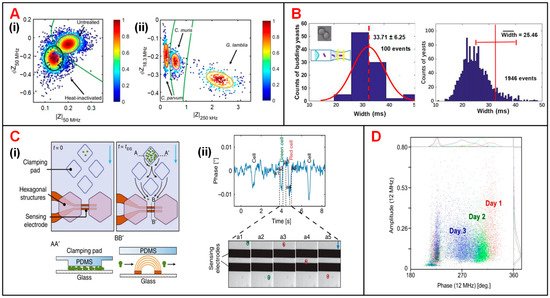
Figure 5. Microbial analysis using IFC devices. (A) (i) Scatter plot of phase (ΦZ50MHz) vs. amplitude (|Z50MHz|) for heat-inactivated and untreated C. parvum. (ii) Scatter plot of phase (ΦZ18.3MHz) vs. amplitude (|Z250kHz|) for C. parvum, C. muris and G. lamblia. Reproduced from [32] with the permission from Nature. (B) Histograms of particle counts in distribution of signal pulse width measured at 1 MHz. Width refers to the time that yeast cells take to pass through the sensing electrodes. Reproduced from [35] with the permission from American Chemical Society. (C) (i) Schematics of an IFC device used for long-term budding yeast culturing and growth-rate measurement. (ii) Signal phase changes corresponding to five events that yeast cells passing through the impedance sensing electrodes. Reproduced from [33] with the permission from Nature. (D) Scatter plot of impedance signal amplitude vs. phase at 12 MHz for yeast population during three-day brewing process. Reproduced from [34] with the permission from Springer.
Yeast cells, easily accessible and culturable, have been widely used as an important model organism to study cell growth and division in cell cycle progression [47]. Xie et al. optimized an IFC device with a constriction channel to detect the size of single budding yeast (S. cerevisiae) cells and calculate the late-budding rates of populations [35]. As shown in Figure 5B, due to the impact of velocity gradient near the constriction channel, rod particles are aligned with the electric field lines, so that the length of rod particles could be assessed by pulse width of impedance amplitude at 1 MHz. In this way, rod and spherical particles could be clearly discriminated. Moreover, late-budding yeast, namely mother cell with a daughter cell that is nearly mature, can be viewed as a rod-shaped cell, while other yeast is approximately oval. Using the same principle, the shape of target cells as well as the budding stages can be obtained. In another work, Chawla et al. developed a microfluidic platform allowing for long-term culturing and independent monitoring of growth rate of budding yeast (Figure 5(Ci)) [33]. In this device, multiple cell populations were anchored to pads and their daughter cells were then washed away, flowing through the impedance sensing unit. By analyzing the impedance signal phase at 1.5 MHz, passages of cells through electrodes were recorded. Then by counting the flowing cells in unit time, the growth rate of cell population can be calculated. As shown in Figure 5(Cii), the phase fluctuated drastically as the cell passes through the electrodes, and each phase pulse corresponds to a single cell flowing through the sensing area. This device enabled culturing and monitoring of various groups of budding yeast simultaneously. At the same time, cell populations can be exposed to different medium solution and their growth rates can be calculated indirectly from impedance signal phase. In addition, Opitz et al. focused on monitoring and analyzing of yeast population under different culturing conditions [34]. In their study, impedance signals at 12 MHz were analyzed to characterize cell viability in a three-day brewing process. On the first day, the high phase indicated that the cell population had high viability and they began to breed by large numbers (Figure 5D). By the end of the third day, the cell population showed lower viability. The cell loss could be ascribed to the depletion of oxygen and the accumulated ethanol.
2. EIS to Detect Suspended or Adherent Single Cells
Different from IFC devices that are commonly used for cell recognition and screening with high throughput, EIS sensing devices are capable of extracting broadband impedance information and tracking dynamic variations of single cells. Recent EIS sensing devices applied in single-cell analysis are summarized in Table 2. These devices are classified into two categories: one is to determine the optimal frequency at which the impedance of different cell lines or cell states is most sensitive [48][49] and the other is to continuously monitor the dynamic cell process or cell behavior and phenotypic changes [50][51][52][53][47][54][45][55][56][57].
Table 2. Applications of EIS measurement for single cells. OT: Observation time. Throughput: Maximum number of single cells that can be simultaneously measured.
| First Author (Year) |
Techniques | Frequency Range | Throughput | OT | Target Cells | Application | Ref. |
|---|---|---|---|---|---|---|---|
| Primiceri (2011) | ECIS | 1 Hz to 1 MHz | / | 4 h | Hepatocellular carcinoma cells |
Monitoring cell migration | [56] |
| Hong (2012) | DEP traps | 20 kHz to 101 kHz | / | / | A549, MDA-MB-231, MCF-7, and HeLa cells |
Electrical characteristics analysis of cancer cells | [55] |
| Nguyen (2013) | Hydrodynamic traps and ECIS |
100 Hz to 1 MHz | 16 | / | MDA-MB-231 and MCF-7 cells |
Monitoring cell capture, adhesion, and spreading process | [51] |
| Zhu (2014) | Negative pressure traps | 10 kHz to 10 MHz | 10 | 42 min | S. cerevisiae cells | Monitoring bud growth and cell motion | [50] |
| Zhu (2015) | Negative pressure traps | 10 kHz to 10 MHz | 10 | 120 min | S. pombe cells | Cell cycle determination | [47] |
| Zhou (2016) | Hydrodynamic traps | 100 Hz to 20 MHz | 10 | 48 h | Mouse embryonic stem cells | Monitoring the differentiation process | [54] |
| Park (2016) | Negative pressure traps | 5 kHz to 1 MHz | 5 | / | Cancerous human urothelial cells (TCCSUP) | Cell recognition | [49] |
| Tsai (2016) | Hydrodynamic traps | 10 kHz to 100 kHz | 3 | 24 h | HeLa cells | Monitoring electrical characteristics | [52] |
| Tang (2017) | Hydrodynamic traps | 1.953 kHz to 1 MHz | 10 | / | MCF-7 cells | Monitoring the capture process and cell screening | [48] |
| Chen (2020) | Hydrodynamic traps | 100 kHz to 2 MHz | / | 24 h | Arabidopsis mesophyll cells | Monitoring the regeneration process of primary cell wall | [45] |
| Zhang (2020) | DEP traps and ECIS | 100 kHz | 32 | 5 min | HeLa, MCF-7, and 293T cells |
Monitoring the recovery process after electroporation | [57] |
| Zhang (2020) | DEP traps and ECIS | 100 kHz | 32 | 21 days | Mesenchymal stem cells | Monitoring differentiation process | [53] |
EIS sensing technology has been used to investigate the optimal frequency at which the characteristic parameters extracted from EIS signals are most prominent in measuring specific dielectric properties of cells [48][49]. Park et al. proposed two types of devices to distinguish cancerous from normal human urothelial cell lines (Figure 6(Ai)) [49]. In one device, single cells were captured at 3D traps by applying negative pressure underneath. Then, the impedance of immobilized single cells was individually measured at frequencies from 5 kHz to 1 MHz. According to the EIS signals in Figure 6(Aii) plot, 119 kHz was supposed to be the optimal frequency, at which the impedance of two types of cells had the greatest divergence. The real-time impedance of the cell lines was measured at 119 kHz in the other device (an IFC device) to identify cancerous cells. These two devices potentially provide a supplementary platform to detect urothelial cancer of the bladder (UCB). In another study, Tang et al. developed a portable single-cell analytical system combining hydrodynamic traps and EIS measurement to accurately detect the sizes of MCF-7 cells [48]. Under the hydrodynamic forces, MCF-7 cells could be initially captured at the entrance of the narrow channel and then squeezed into it. Impedance signals were collected from three groups, among which one is the control group of PBS solution without cells, another one is the trapped cells in suspension, and the third one is the squeezed cells (Figure 6B). According to the sweep-frequency measurement of EIS, the frequency was optimized to 500 kHz, at which, cellular trapping-releasing-squeezing manipulation and cell size could be detected more accurately.
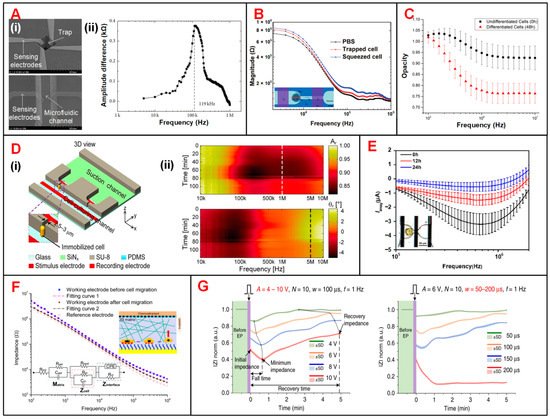
Figure 6. Cell-based assay using EIS sensing devices. (A) (i) SEM images of the two devices used to detect cancerous urothelial cells. Left one is an EIS sensing device with a negative pressure trap used to investigate the optimal frequency. Right one is an IFC device to perform high-throughput electrical impedance measurement of normal and cancerous urothelial cells. (ii) Measurement of the amplitude difference between normal and cancerous urothelial cells in the frequency range of 5 kHz to 1 MHz. Reproduced from [49] with the permission from Hindawi. (B) Schematics of a EIS sensing device to measure the amplitude and phase signal of MCF-7 cells under three typical conditions: PBS solution without cells, cell trapped and cell squeezed. Reproduced from [48] with the permission from Springer. (C) Using a EIS sensing device with microfluidic traps to distinguish the undifferentiated and differentiated cells by measuring the impedance over the frequency range from 100 kHz to 10 MHz. Reproduced from [54] with the permission from Elsevier. (D) (i) Schematics of an EIS-integrated single-cell culturing device for immobilization and impedance recording of Schizosaccharomyces pombe (S. pombe) cells. (ii) Recorded EIS amplitude and phase signals over the frequency range from 10 kHz to 10 MHz showing the growth and division of single S. pombe cells. Reproduced from [47] with the permission from Nature. (E) Imaginary part of current response for Arabidopsis mesophyll cells at different status (0 h, 12 h and 24 h after incubation, respectively). Reproduced from [45] with the permission from Elsevier. (F) The Bode impedance spectra measured on working electrode before and after cell migration, as well as on reference electrode without cells over the frequency range from 100 Hz to 1 MHz. Reproduced from [51] with the permission from American Chemical Society. (G) Recording of |Z|norm for HeLa cells in the recovery process under different conditions of electroporation. A, N, w and f stand for pulse amplitude, number, width and frequency, respectively. Reproduced from [57] with the permission from Nature.
EIS sensing technology has been used to monitor cell behavior and phenotypic changes, including differentiation of stem cells [53][45][58], cell growth and division [50][47][59], formation of cell wall [54], migration of tumor cells [51][56] and recovery process after electroporation [57].
In order to characterize the differentiation process of stem cells, Zhou et al. analyzed the impedance data from mouse embryonic stem cells (mESCs) at different time points in a cell differentiation cycle [54]. In this study, impedance opacity (|Z1MHz|/|Z50kHz|) was increasing during the 48-h cell differentiation process, and was significant at above 1 MHz (Figure 6C). Based on this finding, they observed the metastable transition state, from which stem cells could either differentiate irreversibly or return to pre-differentiation state at 24 h. Zhang et al. proposed a multifunctional microfluidic chip, which featured DEP trapping, electrical stimulation and real-time impedance monitoring of single cells [53][57][58]. They recorded the real-time impedance changes of two groups of MSCs with (OM group) or without electrical stimulation (OM + ES group) [53]. The results showed that electrical stimulation could accelerate the response to drug and advance the differentiation of MSCs. Besides, this device provided additional phenotypic indicators that were not available in cell traction force sensor and contributed to multimodal characterization of long-term physiological variations in the cell differentiation process [58].
Ghenim et al. were the first to monitor the impedance variation in the mitosis of a single mammalian cell [59]. Zhu et al. presented a microfluidic cell-culturing chip to trap, cultivate and selectively release individual yeast cells [60]. Then, this device was used to monitor the cell dynamics in a cell cycle of yeast cells (Figure 6(Di)) [50][47]. As an example, electrodes originally used to generate DEP forces were used to measure the electrical impedance spectrum of rod-shaped S. pombe cells, which were immobilized in an upright position at the traps [47]. Cell growth, nuclear division and cytokinesis in a cell cycle were sensitively characterized by EIS signal amplitude at 1 MHz and phase at 5 MHz (Figure 6(Dii)).
Chen et al. investigated the formation process of primary cell wall of Arabidopsis mesophyll cells [45]. The formation of the cell wall reduced the capacitance of entire plant cell and thus led to an increase in the imaginary part of impedance signal [21]. In support of this hypothesis, they measured the differential current response of Arabidopsis mesophyll cells at three status of cell wall formation (Figure 6E).
Cell migration, which serves as the initiation of cancer metastasis, could be recorded by ECIS technology [61]. Primiceri et al. demonstrated that cell migration could be monitored and automatically analyzed by a EIS biochip [56]. Nguyen et al. proposed a microfluidic chip with ECIS for monitoring the migration of single cancer cells in 3D matrixes [51]. In this study, the impedance measurements were performed with a voltage of 10 mV over the frequency range from 100 Hz to 1 MHz and showed the significant decrease of EIS amplitude after cell migration (Figure 6F). The real-time EIS recording was carried out at 4 kHz and demonstrated that MCF-7 cells were less metastatic than MDA-MB-231 cells. Zhang et al. monitored the recovery processes of HeLa cells after electroporation by using impedance measurement (Figure 6G) [57]. HeLa cells were trapped and electroporated with different working modes of center electrodes. Within 5 min after electroporation, normalized amplitude curves were slowly rising corresponded to the reversible EP processes, while those stabilizing at the minimum values indicated the irreversible EP and cell death.
References
- Liu, J.; Qiang, Y.; Alvarez, O.; Du, E. Electrical impedance microflow cytometry with oxygen control for detection of sickle cells. Sens. Actuators B Chem. 2018, 255, 2392–2398.
- Hassan, U.; Watkins, N.N.; Reddy, B., Jr.; Damhorst, G.; Bashir, R. Microfluidic differential immunocapture biochip for specific leukocyte counting. Nat. Protoc. 2016, 11, 714–726.
- Holmes, D.; Morgan, H. Single cell impedance cytometry for identification and counting of CD4 T-cells in human blood using impedance labels. Anal. Chem. 2010, 82, 1455–1461.
- Du, E.; Ha, S.; Diez-Silva, M.; Dao, M.; Suresh, S.; Chandrakasan, A.P. Electric impedance microflow cytometry for characterization of cell disease states. Lab Chip 2013, 13, 3903–3909.
- Honrado, C.; Ciuffreda, L.; Spencer, D.; Ranford-Cartwright, L.; Morgan, H. Dielectric characterization of Plasmodium falciparum-infected red blood cells using microfluidic impedance cytometry. J. R. Soc. Interface 2018, 15, 20180416.
- Zhang, Y.; Liang, H.; Tan, H.; Chen, D.; Wang, Y.; Xu, Y.; Wang, J.; Chen, J. Development of microfluidic platform to high-throughput quantify single-cell intrinsic bioelectrical markers of tumor cell lines, subtypes and patient tumor cells. Sens. Actuators B Chem. 2020, 317, 128231.
- Spencer, D.; Hollis, V.; Morgan, H. Microfluidic impedance cytometry of tumour cells in blood. Biomicrofluidics 2014, 8, 064124.
- Choi, H.; Kim, K.B.; Jeon, C.S.; Hwang, I.; Lee, S.; Kim, H.K.; Kim, H.C.; Chung, T.D. A label-free DC impedance-based microcytometer for circulating rare cancer cell counting. Lab Chip 2013, 13, 970–977.
- Han, S.I.; Han, K.H. Electrical detection method for circulating tumor cells using graphene nanoplates. Anal. Chem. 2015, 87, 10585–10592.
- Zhao, Y.; Jiang, M.; Chen, D.; Zhao, X.; Xue, C.; Hao, R.; Yue, W.; Wang, J.; Chen, J. Single-cell electrical phenotyping enabling the classification of mouse tumor samples. Sci. Rep. 2016, 6, 19487.
- Desai, S.P.; Coston, A.; Berlin, A. Micro-electrical impedance spectroscopy and identification of patient-derived, dissociated tumor cells. IEEE Trans. Nanobiosci. 2019, 18, 369–372.
- Ren, X.; Ghassemi, P.; Strobl, J.S.; Agah, M. Biophysical phenotyping of cells via impedance spectroscopy in parallel cyclic deformability channels. Biomicrofluidics 2019, 13, 044103.
- McGrath, J.S.; Honrado, C.; Moore, J.H.; Adair, S.J.; Varhue, W.B.; Salahi, A.; Farmehini, V.; Goudreau, B.J.; Nagdas, S.; Blais, E.M.; et al. Electrophysiology-based stratification of pancreatic tumorigenicity by label-free single-cell impedance cytometry. Anal. Chim. Acta 2020, 1101, 90–98.
- Ostermann, M.; Sauter, A.; Xue, Y.; Birkeland, E.; Schoelermann, J.; Holst, B.; Cimpan, M.R. Label-free impedance flow cytometry for nanotoxicity screening. Sci. Rep. 2020, 10, 142.
- Krebs, M.G.; Hou, J.M.; Ward, T.H.; Blackhall, F.H.; Dive, C. Circulating tumour cells: Their utility in cancer management and predicting outcomes. Ther. Adv. Med. Oncol. 2010, 2, 351–365.
- Hildebrandt, C.; Buth, H.; Cho, S.; Impidjati; Thielecke, H. Detection of the osteogenic differentiation of mesenchymal stem cells in 2D and 3D cultures by electrochemical impedance spectroscopy. J. Biotechnol. 2010, 148, 83–90.
- Song, H.; Wang, Y.; Rosano, J.M.; Prabhakarpandian, B.; Garson, C.; Pant, K.; Lai, E. A microfluidic impedance flow cytometer for identification of differentiation state of stem cells. Lab Chip 2013, 13, 2300–2310.
- Song, H.; Rosano, J.M.; Wang, Y.; Garson, C.J.; Prabhakarpandian, B.; Pant, K.; Klarmann, G.J.; Perantoni, A.; Alvarez, L.M.; Lai, E. Identification of mesenchymal stem cell differentiation state using dual-micropore microfluidic impedance flow cytometry. Anal. Methods 2016, 8, 7437–7444.
- Zhao, Y.; Liu, Q.; Sun, H.; Chen, D.; Li, Z.; Fan, B.; George, J.; Xue, C.; Cui, Z.; Wang, J.; et al. Electrical property characterization of neural stem cells in differentiation. PLoS ONE 2016, 11, e0158044.
- Xavier, M.; de Andres, M.C.; Spencer, D.; Oreffo, R.O.C.; Morgan, H. Size and dielectric properties of skeletal stem cells change critically after enrichment and expansion from human bone marrow: Consequences for microfluidic cell sorting. J. R. Soc. Interface 2017, 14, 20170233.
- Han, Z.; Chen, L.; Zhang, S.; Wang, J.; Duan, X. Label-free and simultaneous mechanical and electrical characterization of single plant cells using microfluidic impedance flow cytometry. Anal. Chem. 2020, 92, 14568–14575.
- Heidmann, I.; Schade-Kampmann, G.; Lambalk, J.; Ottiger, M.; Di Berardino, M. Impedance flow cytometry: A novel technique in pollen analysis. PLoS ONE 2016, 11, e0165531.
- Heidmann, I.; Di Berardino, M. Impedance flow cytometry as a tool to analyze microspore and pollen quality. Methods Mol. Biol. 2017, 1669, 339–354.
- Impe, D.; Reitz, J.; Kopnick, C.; Rolletschek, H.; Borner, A.; Senula, A.; Nagel, M. Assessment of pollen viability for wheat. Front. Plant Sci. 2019, 10, 1588.
- Ascari, L.; Cristofori, V.; Macri, F.; Botta, R.; Silvestri, C.; De Gregorio, T.; Huerta, E.S.; Di Berardino, M.; Kaufmann, S.; Siniscalco, C. Hazelnut pollen phenotyping using label-free impedance flow cytometry. Front. Plant Sci. 2020, 11, 615922.
- Canonge, J.; Philippot, M.; Leblanc, C.; Potin, P.; Bodin, M. Impedance flow cytometry allows the early prediction of embryo yields in wheat (Triticum aestivum L.) microspore cultures. Plant Sci. 2020, 300, 110586.
- Clausen, C.H.; Dimaki, M.; Bertelsen, C.V.; Skands, G.E.; Rodriguez-Trujillo, R.; Thomsen, J.D.; Svendsen, W.E. Bacteria detection and differentiation using impedance flow cytometry. Sensors 2018, 18, 3496.
- Choi, H.; Jeon, C.S.; Hwang, I.; Ko, J.; Lee, S.; Choo, J.; Boo, J.H.; Kim, H.C.; Chung, T.D. A flow cytometry-based submicron-sized bacterial detection system using a movable virtual wall. Lab Chip 2014, 14, 2327–2333.
- Bernabini, C.; Holmes, D.; Morgan, H. Micro-impedance cytometry for detection and analysis of micron-sized particles and bacteria. Lab Chip 2011, 11, 407–412.
- David, F.; Hebeisen, M.; Schade, G.; Franco-Lara, E.; Di Berardino, M. Viability and membrane potential analysis of Bacillus megaterium cells by impedance flow cytometry. Biotechnol. Bioeng. 2012, 109, 483–492.
- Guler, M.T.; Bilican, I. Capacitive detection of single bacterium from drinking water with a detailed investigation of electrical flow cytometry. Sens. Actuator A Phys. 2018, 269, 454–463.
- McGrath, J.S.; Honrado, C.; Spencer, D.; Horton, B.; Bridle, H.L.; Morgan, H. Analysis of parasitic protozoa at the single-cell level using microfluidic impedance cytometry. Sci. Rep. 2017, 7, 2601.
- Chawla, K.; Burgel, S.C.; Schmidt, G.W.; Kaltenbach, H.M.; Rudolf, F.; Frey, O.; Hierlemann, A. Integrating impedance-based growth-rate monitoring into a microfluidic cell culture platform for live-cell microscopy. Microsyst. Nanoeng. 2018, 4, 8.
- Opitz, C.; Schade, G.; Kaufmann, S.; Berardino, M.D. Rapid determination of general cell status, cell viability, and optimal harvest time in eukaryotic cell cultures by impedance flow cytometry. Appl. Microbiol. Biotechnol. 2019, 103, 8619–8629.
- Xie, X.; Zhang, Z.; Ge, X.; Zhao, X.; Hao, L.; Cheng, Z.; Zhou, W.; Du, Y.; Wang, L.; Tian, F.; et al. Particle self-aligning, focusing, and electric impedance microcytometer device for label-free single cell morphology discrimination and yeast budding analysis. Anal. Chem. 2019, 91, 13398–13406.
- Bertelsen, C.V.; Franco, J.C.; Skands, G.E.; Dimaki, M.; Svendsen, W.E. Investigating the use of impedance flow cytometry for classifying the viability state of E. coli. Sensors 2020, 20, 6339.
- Spencer, D.C.; Paton, T.F.; Mulroney, K.T.; Inglis, T.J.J.; Sutton, J.M.; Morgan, H. A fast impedance-based antimicrobial susceptibility test. Nat. Commun. 2020, 11, 5328.
- van Beers, E.J.; Samsel, L.; Mendelsohn, L.; Saiyed, R.; Fertrin, K.Y.; Brantner, C.A.; Daniels, M.P.; Nichols, J.; McCoy, J.P.; Kato, G.J. Imaging flow cytometry for automated detection of hypoxia-induced erythrocyte shape change in sickle cell disease. Am. J. Hematol. 2014, 89, 598–603.
- Küttel, C.; Nascimento, E.; Demierre, N.; Silva, T.; Braschler, T.; Renaud, P.; Oliva, A.G. Label-free detection of Babesia bovis infected red blood cells using impedance spectroscopy on a microfabricated flow cytometer. Acta Trop. 2007, 102, 63–68.
- Holmes, D.; Pettigrew, D.; Reccius, C.H.; Gwyer, J.D.; van Berkel, C.; Holloway, J.; Davies, D.E.; Morgan, H. Leukocyte analysis and differentiation using high speed microfluidic single cell impedance cytometry. Lab Chip 2009, 9, 2881–2889.
- Hassan, U.; Reddy, B., Jr.; Damhorst, G.; Sonoiki, O.; Ghonge, T.; Yang, C.; Bashir, R. A microfluidic biochip for complete blood cell counts at the point-of-care. Technology 2015, 3, 201–213.
- Watkins, N.N.; Hassan, U.; Damhorst, G.; Ni, H.; Vaid, A.; Rodriguez, W.; Bashir, R. Microfluidic CD4+ and CD8+ T lymphocyte counters for point-of-care HIV diagnostics using whole blood. Sci. Transl. Med. 2013, 5, 214ra170.
- Suresh, S. Biomechanics and biophysics of cancer cells. Acta Biomater. 2007, 3, 413–438.
- Durand-Smet, P.; Chastrette, N.; Guiroy, A.; Richert, A.; Berne-Dedieu, A.; Szecsi, J.; Boudaoud, A.; Frachisse, J.-M.; Bendahmane, M.; Hamant, O.; et al. A comparative mechanical analysis of plant and animal cells reveals convergence across kingdoms. Biophys. J. 2014, 107, 2237–2244.
- Chen, L.; Han, Z.; Fan, X.; Zhang, S.; Wang, J.; Duan, X. An impedance-coupled microfluidic device for single-cell analysis of primary cell wall regeneration. Biosens. Bioelectron. 2020, 165, 112374.
- Houssin, T.; Follet, J.; Follet, A.; Dei-Cas, E.; Senez, V. Label-free analysis of water-polluting parasite by electrochemical impedance spectroscopy. Biosens. Bioelectron. 2010, 25, 1122–1129.
- Zhu, Z.; Frey, O.; Haandbaek, N.; Franke, F.; Rudolf, F.; Hierlemann, A. Time-lapse electrical impedance spectroscopy for monitoring the cell cycle of single immobilized S. pombe cells. Sci. Rep. 2015, 5, 17180.
- Tang, W.; Tang, D.; Ni, Z.; Xiang, N.; Yi, H. A portable single-cell analysis system integrating hydrodynamic trapping with broadband impedance spectroscopy. Sci. China Technol. Sci. 2017, 60, 1707–1715.
- Park, Y.; Kim, H.W.; Yun, J.; Seo, S.; Park, C.J.; Lee, J.Z.; Lee, J.H. Microelectrical impedance spectroscopy for the differentiation between normal and cancerous human urothelial cell lines: Real-time electrical impedance measurement at an optimal frequency. BioMed Res. Int. 2016, 2016, 8748023.
- Zhu, Z.; Frey, O.; Franke, F.; Haandbaek, N.; Hierlemann, A. Real-time monitoring of immobilized single yeast cells through multifrequency electrical impedance spectroscopy. Anal. Bioanal. Chem. 2014, 406, 7015–7025.
- Nguyen, T.A.; Yin, T.-I.; Reyes, D.; Urban, G.A. Microfluidic chip with integrated electrical cell-Impedance sensing for monitoring single cancer cell migration in three-dimensional matrixes. Anal. Chem. 2013, 85, 11068–11076.
- Tsai, S.L.; Wang, M.H. 24 h observation of a single HeLa cell by impedance measurement and numerical modeling. Sens. Actuators B Chem. 2016, 229, 225–231.
- Zhang, Z.; Zheng, T.; Zhu, R. Microchip with single-cell impedance measurements for monitoring osteogenic differentiation of mesenchymal stem cells under electrical stimulation. Anal. Chem. 2020, 92, 12579–12587.
- Zhou, Y.; Basu, S.; Laue, E.; Seshia, A.A. Single cell studies of mouse embryonic stem cell (mESC) differentiation by electrical impedance measurements in a microfluidic device. Biosens. Bioelectron. 2016, 81, 249–258.
- Hong, J.-L.; Lan, K.-C.; Jang, L.-S. Electrical characteristics analysis of various cancer cells using a microfluidic device based on single-cell impedance measurement. Sens. Actuators B Chem. 2012, 173, 927–934.
- Primiceri, E.; Chiriaco, M.S.; Dioguardi, F.; Monteduro, A.G.; D’Amone, E.; Rinaldi, R.; Giannelli, G.; Maruccio, G. Automatic transwell assay by an EIS cell chip to monitor cell migration. Lab Chip 2011, 11, 4081–4086.
- Zhang, Z.; Zheng, T.; Zhu, R. Single-cell individualized electroporation with real-time impedance monitoring using a microelectrode array chip. Microsyst. Nanoeng. 2020, 6, 81.
- Zhang, Z.; Zheng, T.; Zhu, R. Long-term and label-free monitoring for osteogenic differentiation of mesenchymal stem cells using force sensor and impedance measurement. J. Mater. Chem. B 2020, 8, 9913–9920.
- Ghenim, L.; Kaji, H.; Hoshino, Y.; Ishibashi, T.; Haguet, V.; Gidrol, X.; Nishizawa, M. Monitoring impedance changes associated with motility and mitosis of a single cell. Lab Chip 2010, 10, 2546–2550.
- Zhu, Z.; Frey, O.; Ottoz, D.S.; Rudolf, F.; Hierlemann, A. Microfluidic single-cell cultivation chip with controllable immobilization and selective release of yeast cells. Lab Chip 2012, 12, 906–915.
- Crowell, L.L.; Yakisich, J.S.; Aufderheide, B.; Adams, T.N.G. Electrical impedance spectroscopy for monitoring chemoresistance of cancer cells. Micromachines 2020, 11, 832.
More
Information
Subjects:
Agriculture, Dairy & Animal Science
Contributor
MDPI registered users' name will be linked to their SciProfiles pages. To register with us, please refer to https://encyclopedia.pub/register
:
View Times:
1.0K
Revisions:
2 times
(View History)
Update Date:
10 Dec 2021
Table of Contents


Notice
You are not a member of the advisory board for this topic. If you want to update advisory board member profile, please contact office@encyclopedia.pub.
OK
Confirm
Only members of the Encyclopedia advisory board for this topic are allowed to note entries. Would you like to become an advisory board member of the Encyclopedia?
Yes
No
${ textCharacter }/${ maxCharacter }
Submit
Cancel
Back
Comments
${ item }
|
${ item.createdUser.fullName }
${ item.createdAt }
${ item.vote }
${ item.reply }
Delete
${ reply.createdUser.fullName }
${ reply.createdAt }
${ reply.vote }
Delete
There is no reply to this comment~
${ item.replyTextCharacter }/${ item.replyMaxCharacter }
Submit
Cancel
More
No more~
There is no comment~
${ textCharacter }/${ maxCharacter }
Submit
Cancel
${ selectedItem.replyTextCharacter }/${ selectedItem.replyMaxCharacter }
Submit
Cancel
Confirm
Are you sure to Delete?
Yes
No