Submitted Successfully!
To reward your contribution, here is a gift for you: A free trial for our video production service.
Thank you for your contribution! You can also upload a video entry or images related to this topic.
Version Summary Created by Modification Content Size Created at Operation
1 + 4017 word(s) 4017 2021-12-03 03:05:37 |
2 h -2 word(s) 4015 2021-12-10 09:42:25 | |
3 Remove from the EC "Structures for Engineering and Architecture" Meta information modification 4015 2022-03-28 05:59:37 |

Video Upload Options

Do you have a full video?

Confirm

Are you sure to Delete?
Cite
If you have any further questions, please contact Encyclopedia Editorial Office.
Contreras, D. Earthquake Reconnaissance Data. Encyclopedia. Available online: https://encyclopedia.pub/entry/16878 (accessed on 27 July 2024).
Contreras D. Earthquake Reconnaissance Data. Encyclopedia. Available at: https://encyclopedia.pub/entry/16878. Accessed July 27, 2024.
Contreras, Diana. "Earthquake Reconnaissance Data" Encyclopedia, https://encyclopedia.pub/entry/16878 (accessed July 27, 2024).
Contreras, D. (2021, December 08). Earthquake Reconnaissance Data. In Encyclopedia. https://encyclopedia.pub/entry/16878
Contreras, Diana. "Earthquake Reconnaissance Data." Encyclopedia. Web. 08 December, 2021.
Earthquake Reconnaissance Data
Edit

Earthquakes are one of the most catastrophic natural phenomena. After an earthquake, earthquake reconnaissance enables effective recovery by collecting data on building damage and other impacts. This paper aims to identify state-of-the-art data sources for building damage assessment and provide guidance for more efficient data collection. We have reviewed 39 articles that indicate the sources used by different authors to collect data related to damage and post-disaster recovery progress after earthquakes between 2014 and 2021. The current data collection methods have been grouped into seven categories: fieldwork or ground surveys, omnidirectional imagery (OD), terrestrial laser scanning (TLS), remote sensing (RS), crowdsourcing platforms, social media (SM) and closed-circuit television videos (CCTV). The selection of a particular data source or collection technique for earthquake reconnaissance includes different criteria depending on what questions are to be answered by these data. We conclude that modern reconnaissance missions cannot rely on a single data source. Different data sources should complement each other, validate collected data or systematically quantify the damage. The recent increase in the number of crowdsourcing and SM platforms used to source earthquake reconnaissance data demonstrates that this is likely to become an increasingly important data source.

earthquake reconnaissance fieldwork surveys closed-circuit television videos

1. Introduction

Each year, disasters cause significant human and economic losses. Out of these disasters, earthquakes are one of the most catastrophic natural phenomena. These events have caused more than 23 million deaths between 1902 and 2011 [1], substantial physical, social, economic [2] and, occasionally, institutional, cultural and environmental losses. Following an earthquake, there is a substantial demand and need for spatial information [1][2] about population location [3], evacuation routes, availability of resources [4], size of the affected area and distribution of damage. Later, during the emergency phase, it is necessary to collect more detailed data about damages in the structural components of buildings [5].
Earthquake reconnaissance enables collecting perishable data on building performance to prepare statistics, calibrate and validate engineering models, and identify the construction deficiencies that lead to inadequate structural performance. This paper aims to identify state-of-the-art data sources for building damage assessment and serve as a guide to make more efficient data collection based on the experiences in the last years. Damage is understood as a change in the mechanical, material and/or geometric properties of a building, affecting its performance and behaviour [6]. Damage data is highly ‘perishable’, or ephemeral, since damaged structures may be altered or removed during rescue or early recovery [7] activities [8] or modified by aftershocks. A large earthquake produces extensive building damage and affects the operational conditions of other structures [9] in and around an urban area [10]. Additionally, economic and social consequences are usually related to the loss of buildings’ usability [11][12]. Buildings are essential places to live [13], do business or carry out activities [14]; this is why most of the losses [15] and 75% of the casualties [16] in disasters are due to building damage [15]. Building damage assessment is a critical activity to secure the safety of the public [5] and provide information for disaster relief, early recovery planning [10] and later reconstruction [17][18][19], especially due to the threat of aftershocks. Moreover, damage assessment is essential for assessing disasters’ social and economic impact [18][19][20]. The effectiveness of post-disaster activities during the response and recovery phases depends on accurate and early damage estimation [21].
In the past, conventional recording and measurement tools, such as photography, note-taking and surveying, were used by reconnaissance investigators to collect data and document field observations. Nowadays, the availability of state-of-the-art instrumentation, mobile data collection technologies, social media (SM), crowdsourcing platforms, training and field support services has increased the ability of field investigation teams to capture perishable data during post-disaster phases [8]. Currently, there are two data sources in the disaster management cycle: sensor-generated, such as the data collected by remotes sensing (RS) tools, closed-circuit television videos (CCTV) or satellites, and user-generated content collected from SM and crowdsourcing platforms [22][23]. Quantitative assessment of damage determines the physical damage of the exposed elements in the affected area. The result of the damage assessment will be the aggregate quantities of damages for an exposure unit. This quantitative assessment is used to assess the direct economic loss as the basis for calculating the value of economic losses: the replacement cost [18] or insurance payouts of value to international aid organisations, bi-lateral/multilateral donors and the insurance industry [24]. During the emergency or relief phase, the quantitative assessment of damage starts with the structural component of the buildings due to its essential role in the safety of the population affected by earthquakes and the estimation of temporary shelter needed [7]. Structural damage evaluation implies a visual inspection to establish whether the building structure components are damaged, the degree to which different elements may be damaged and the degree of damage that represents a risk to the occupants of the building. These data are necessary for understanding the trend of natural disaster impacts and existing planning and building practices [25]. Earthquake reconnaissance enables collecting perishable data on building performance to prepare statistics, calibrate and validate engineering models and identify the construction deficiencies that lead to inadequate structural performance [26]. Damage detection and characterization involve five closely related subjects [9], i.e., structural health monitoring (SHM), condition monitoring (CM), non-destructive evaluation (NDE), statistical process control (SPC) and damage prognosis (DP) [6].

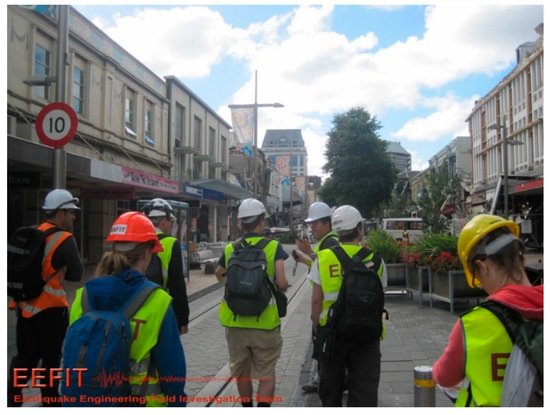
2. Fieldwork or Ground Surveys

Post-disaster structural damage assessment is typically based on ground surveying methods [21]. The objective of these missions is to learn about the performance of infrastructure and structures under seismic loading, collect accurate damage data [27] for further research [28] and scientific understanding of their physical, socio-economic, environmental [8], cultural and institutional consequences. In situ structural observations sometimes include records not limited to the mechanism of structural failure and observations of undamaged structures and the extent and scale of damage to structures at a global and component level [27]. To develop a detailed building damage map after an earthquake or a hurricane, it is necessary to identify the damage using a building-by-building approach [10][29]; most building damage assessments reviewed relied on a foot-on-ground approach [30]. This detailed inspection is the most reliable [21] and generates invaluable information on the seismic performance of the affected building stock [31]. However, the limited time the mission is deployed and the street level constraints on the extent of observations make it less reliable at collating damage statistics, which are particularly important for validating and developing fragility and vulnerability functions [27].
Fieldwork or ground surveys are a traditional approach to estimating the spatial distribution of earthquake impacts to building clusters, performed by volunteer groups consisting of structural engineers, architects, researchers with experience in building instrumentation, geotechnical and seismological specialists [28] and undergraduate students of these fields. These missions collect structural, geotechnical, seismological and damage information [28]. Earthquake reconnaissance missions are undertaken by national or international organisations such as the Earthquake Engineering Field Investigation Team (EEFIT) [8][26] in the United Kingdom (UK), the Geotechnical Extreme Events Reconnaissance Association (GEER) [8][26][32] and the Earthquake Engineering Research Institute (EERI) [8] in the United States (US). The EERI, through its program, Learning from Earthquakes (LFE) established in 1973, was the first professional organization to organize reconnaissance missions to significant seismic events. This organization recently has formed a virtual earthquake reconnaissance team (VERT) to conduct ‘virtual’ (i.e., not on-site) assessment within 48 h after an earthquake [8]. In Italy, the European Centre for Training and Research in Earthquake Engineering (EUCENTRE) and the Italian Network of University Laboratories for Earthquake Engineering (ReLUIS) have organized earthquake reconnaissance missions and conducted follow-on seismic policy analyses. For six decades, the New Zealand Society for Earthquake Engineering (NZSEE) has supported reconnaissance research of earthquakes and major tsunamis in the world [8]. The Asian Technical Committee (ATC3) “Geotechnology for Natural Hazards”, the Building Research Institute of Japan and the Nepalese Engineering Society have conducted reconnaissance missions in Asia after natural phenomena. Another organization that has supported reconnaissance missions in the US is the American Society of Civil Engineers (ASCE). Additionally, sometimes, self-organized teams with a focused hypothesis-driven research question or inquiry are formed to collect data [8]. In the 2017 Puebla–Morelos earthquake case, also known as the 2017 Puebla earthquake or the 2017 Mexico earthquake, the Applied Technology Council (ATC) from the US deployed a team to Mexico City sponsored by the ATC Endowment Fund. This team was joined by practising architects, engineers, professors and local agencies [28]. The NZSEE, in collaboration with the Universidad Autonoma de Metropolitana (UAM) Azcapotzalco, the American Concrete Institute (ACI) Disaster Reconnaissance team, the Colegio de Ingenieros Civiles de Mexico (CICM) and the team of Stanford University’s John A. Blume Earthquake Engineering Center [33] all deployed a team for the same earthquake in Mexico [34].
In a foot-on-ground survey, as it is portrayed in Figure 1, the assessment is conducted manually [35], one building after another [25]; each reconnaissance mission in the field takes approximately one week. Considering that, there is a preliminary data collection to limit the inspection area where the causes of failures of buildings can be observed within a safe environment. Earthquake reconnaissance missions’ members are usually trained volunteers affiliated with one of the organisations mentioned previously, who cannot spend more than one week away from their daily business. Even the ATC’s reconnaissance mission after the 2017 Puebla–Morelos earthquake lasted only three days [28]. To maximize the area to inspect, three teams composed of three to four structural engineers were deployed each day in this specific mission. Each team involved one Spanish speaker to interact with residents and one local structural engineer [28]. Usually, preliminary data collection before fieldwork includes seismic information, size of the affected area, building typologies, injuries and casualties, local institutions, accessibility, safety and security aspects, local traditions and any information supporting the fieldwork planning [36]. Traditionally, paper forms were used, but increasingly, smart technologies are used, such as tools to complete investigation forms and collect multi-media data (e.g., photos, audios and videos) [35]. One example was the damage assessment app used by the EEFIT mission team deployed to Albania to collect damage data after the earthquake in 2019 [37]. The ATC reconnaissance mission for the 2017 Puebla–Morelos earthquake focused on buildings with not only significant but also minimal damage. No inspections were undertaken on collapsed buildings, considering that those buildings do not suggest where or why the failures occurred [28]. This ATC’s reconnaissance mission collected damage and geotechnical data, earthquake ground motions from several suites and ambient vibration recordings from buildings instrumented by the team during the reconnaissance trip [28]. This ATC mission instrumented seven of the inspected buildings with an array of accelerometers [28]. The NZSEE and UAM team focused on extensive and widespread damage where local site effects could have contributed to the significant damage in buildings. At the same time, the team evaluated the performance of the repaired and retrofitted buildings after the 1985 Michoacán earthquake [34]. Stanford’s John A. Blume Earthquake Engineering Center surveyed the affected area in Mexico on 24–29 September. It complemented the database of collapsed buildings with data collected from newspapers and SM until 1 November 2017 [33].
Figure 1. EEFIT earthquake reconnaissance mission after the Christchurch earthquake in 2011. Source: [38].
The GEER deployed two teams in central Italy. The first team, integrated entirely by Italians, located potential landslide sites of interest. Later, a second team was deployed to collect data in the places identified by the first team [36]. Manual inspection and documentation of landslides were done by the GEER team in central Italy using standard geologist’s tools: scale, measuring tape, clinometer, compass, rock hammers and total station. Key landslide dimensions were measured on each manually inspected point, i.e., length, wide, scarp height and slope inclination [36]. Notes were taken about the slide mass or rockfall constituent materials, local geology, observed groundwater and seepage conditions and anthropogenic activity in the area. The width and height of the rockfall source were measured using total stations, while slope inclination below the rock source was either estimated or measured [36]. The geologic hammer was utilized to infer the rock strength. Stratification, weathering, spacing, joint width and infill material were evaluated. Distances were estimated for most rockfalls, given that lateral and vertical distances of the rollout were too large to measure manually. Boulder fragments were inspected with measurements of boulder size [36]. Parallel to the GEER mission, and with its support during the planning phase and the support of the Italian Department of Civil Protection (DPC by its acronym in Italian), EERI, EUCENTRE and ReLuis also deployed a mission in central Italy to study the effects of the earthquake sequence, not only on the built environment but also on the communities located in the affected areas. Another objective was to assess the retrofitting methodologies and evaluate their effectiveness in mitigating the damaging effects of ground shaking [39]. These three organizations also deployed two missions. The first mission was deployed following the 2016 Amatrice earthquake, and the second mission after the earthquake sequence in 2017 when it was considered safe to enter the restricted zones [39]. The mission teams were formed by engineers with expertise in lifelines and structures focused on bridges and buildings. Besides engineering aspects, the mission collected data related to emergency management and the performance of critical infrastructures (CI) such as hospitals and schools [39].

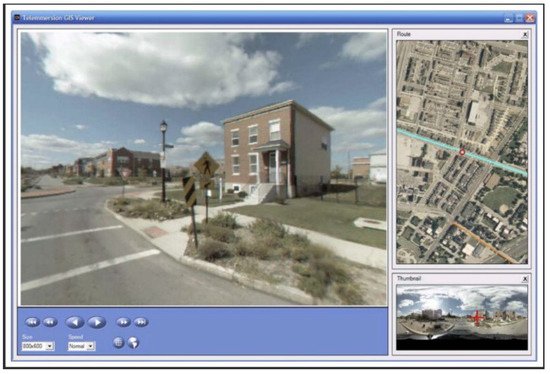
3. Omnidirectional Imagery (OD)

The outcomes of the fieldwork or ground surveys can be improved by the unique viewpoints and perspectives delivered by the OD camera technology. Employing OD cameras enables the collection of chains of omnidirectional images. The development of online platforms to host the collected images makes it possible for those photo chains to be easily visualized to simulate an immersive ‘walk through’ of a landscape with a 360 degree view, ideal for comprehensive damage inspections in reduced access zones [27]. One example of the visualisation obtained with this technology is presented in Figure 2.
Figure 2. A portion of an OD image depicting a street intersection in St. Louis, MO. Source: [40].
Previous studies have reported an acceptable level of accuracy of virtual surveys compared to street surveys [27][41][42]. Chains of OD images could be utilized to increase sample sizes by improving statistical structural damage data, allowing robust sampling techniques to be used across an area impacted by an earthquake [27]. EEFIT tested this data source in two different post-earthquake contexts: the 2016 Muisne earthquake in Ecuador and the 2016 earthquake in central Italy. In both cases, the same camera equipment was used: a Ricoh Theta S. The imagery was visualized employing the Mapillary platform to assess construction typologies, number of stories and degree of damage [27]. The context of the two EEFIT missions is different in the scale of the damage, the buildings affected, the urban context, the local topography and the earthquake’s characteristics.
In the 2016 Muisne earthquake in Ecuador, damage data collected through a series of rapid visual surveys (RVS) conducted in the field were compared to the data collected virtually along the same routes using chains of OD images. This mission validated the utilization of OD imagery with RVS data to compare virtual surveys, later using OD imagery on the damage data extracted from satellite imagery [27]. In 2016 in central Italy, the work was focused on testing OD imagery’s ability, collected during the walk-through, to better understand damage regarding the damage maps provided by the European Copernicus Emergency Management Service. These maps were delineated based on the timely geospatial information derived from RS and completed with available open data sources in situ for emergency response [27].

4. Discussion

Building-by-building foot-on-ground surveys collect highly detailed data that can be used forensically to validate RS data or models such as structural models or fragility curves [43]. However, they are expensive and time-consuming [30], and the duration of these inspections can last for months [29], depending on the availability of volunteers [31], to reach a good understanding of the event’s characteristics [29]. Nevertheless, it is necessary to differentiate between a rapid building damage survey [44], which is focused on buildings’ safety during the emergency phase, and a detailed damage survey oriented to assessing the performance of building structures or the restoration of historic buildings [45]. This second kind of damage survey can support early recovery planning and help to accomplish build-back-better and built-to-last. Now, smartphones allow quicker and more rigorous structural evaluations by filling in forms in apps containing all the necessary items to evaluate the damage to a building and collecting multimedia data. The collected photos can be indexed by their locations using GPS coordinates [46] or what3words. Eventually, post-earthquake investigation data can be quickly uploaded to servers through the network of smartphones so that seismic damage data can be quickly shared to support decision making for post-disaster recovery [35].
Omnidirectional imagery shows significant capabilities in identifying aggregated ‘low’ and ‘high’ damage grades, failure modes, number of stories and construction typologies. There are some potential issues with properly identifying disaggregated lower damage (e.g., damage grades 0–3 according to the European Macroseismic Scale-98) [27]. The comparison of RVS and OD based post-earthquake survey data identified challenges to overcome. Those challenges are poor image quality; insufficient photosphere captures related to the extent of its overlap, lack of photos close enough to each other and obstructions such as trees, walls or vehicles [27]. More advanced cameras could improve the image quality, and the gaps between pictures can be solved by reducing the distance between images (between 10 and 12 m) [27], especially on obstructed streets (e.g., tree-lined). Moreover uncertainties related to the validity of the information inferred using this method and the challenges associated with collecting detailed data still need to be addressed. The TLS capture of the entire geometry of the Baptistery of San Giovanni in Florence, Italy, was not used in the context of an earthquake reconnaissance mission. However, we decided to include this reference for the suitability of this method in reconnaissance missions when they need to focus on the forensic analysis of world heritage (WH) buildings. Terrestrial laser scanning can collect highly detailed data of cracks, settlements, displacements and other damages in structural and nonstructural elements, the latter being especially important in these kinds of buildings. However, time to collect the data and training to operate this tool correctly is necessary.
The main advantage of using RS for building damage assessment is that large damaged areas can be surveyed rapidly without being hampered by the emergency operation on the ground [24]. However, VHR satellite images useful for CD could be expensive, not be up-to-date, not match each other and contain clouds, making them useless for CD. An accurate damage detection can take some time while the objects in the images are classified, and the software algorithm in software is trained to detect changes related to damage [47]. Smaller and particularly complex urban disaster scenes, multi-perspective aerial imagery obtained with UAVs and sUAV and derived dense colour 3-D models are increasingly employed to gather data. Hence, it would be interesting to investigate how the regulation for the operation of sUAVs affects the data collection rate and its delineation of areas affected by the earthquakes, and sUAV’s effectiveness as a detailed reference source for the tracking of recovery efforts during return missions. These data sources are an alternative to CD in satellite images in identifying damage, and they also remove challenges such as the images not matching [48]. Currently, satellites are equipped with several RS payloads to complement airborne remote sensing and other UAVs. The result is a collaborative operated network involving multiple satellite observations, airborne RS and ground operations [18].
Crowdsourcing information can be a cost-effective option to form a dense real-time accelerometric network, reducing uncertainties of rapid earthquake scenarios [49]. Despite the intrinsic variability of felt reports, based on 20 years of DYFI experience [50], it is possible to observe how felt reports have contributed to earthquake response and science and behaviour studies [50][49]. Integrating DYFI data in ShakeMaps improves shaking estimates and the rapid assessment of an earthquake’s impact [50][49]. The Earthquake Network app and MyShake app are similar. The main difference between these apps is that the data recorded by the accelerometer in the Earthquake Network app are not used to make any seismological analysis, and EEWs are sent only when several smartphones in the same area detect accelerations above a specified threshold [51]. Currently, the main limitations of the EEW system implemented by the Earthquake Network are the lack of accuracy in the information of the earthquake intensity and that the geometry of the location of the smartphone network is not optimized regarding known faults [51]. Among these apps, the EMSC was the first to consider the behaviour of users and their associated digital footprints to detect a widely-felt earthquake in an intersection between seismology, citizen science and digital communication. This approach was also compared with the manually and independently derived macroseismic datasets from DYFI [49]. However, when looking at intensity levels reported by users, it is necessary to keep in mind that those living in low seismic zones tend to report an earthquake, regardless of the magnitude and/or impact displayed in the app user interface [51]. Another common problem among citizen science projects is user retention, which could be solved by encouraging interaction with the app and other users to boost user lifetime value [51]. In the case of Mayotte (2018), it was observed that while scientists were gathering on Twitter [29], citizens were debating on Facebook about the same seismic phenomenon. The answers to the questions formulated on the STTM group were available on Twitter. This situation can be explained by the socio-technical design of the platforms and the technological culture. People use Facebook for daily and personal uses. Instead, Twitter has become a handy platform for researchers to exchange ideas, collaborate and share preliminary outcomes [52].
Crowdsourcing and SM platforms tend to be the new data sources. Given the travel restrictions imposed by the COVID-19 pandemic, we started using them to collect data for the earthquake reconnaissance missions of the 2020 Zagreb earthquake [53][54][55] and 2020 Aegean earthquake [56][57], and even before the 2019 Albanian earthquake [58] and earthquake reconnaissance missions in the long-term for the tenth anniversaries of the earthquakes in L’Aquila (Italy) [59][60][61], Maule (Chile) [59][62] and Port-au-Prince (Haiti) [59]. We did not focus the review on SM platforms because there was already a literature review on this topic [63]. The ubiquity of smartphones and SM has opened new opportunities for fast crowdsourcing and two-way communication between affected people and institutions/authorities [49]. In some cases, one geotagged picture, an individual observation or objective comments on SM platforms can substantially reduce uncertainties regarding impacts [49]. However, the scientific community still casts doubts on the utility and reliability of data collected in the framework of citizen science projects. Text and image data collected from SM are unstructured data that need a lot of cleaning [64]. Then pre-processing and translation to English (in case of text data), which is time-consuming, before being useful for a supervised and/or an accurate unsupervised classification to extract meaningful information from them. Training users to post more objective and less emotional messages is necessary to obtain more useful damage and needs assessment data. The Institute of Earth Sciences, Academia Sinica in Taiwan, trained volunteer users among high school or junior high school teachers to ensure the quality of data collected through the crowdsourcing TERS system. These volunteers are trained in natural sciences, geology, historical earthquakes and associated surface damages, geohazards, TERS and volunteer reporting system, citizen seismology and field geology excursion with on-site practices [65].
Earthquake reconnaissance missions can also take advantage of images uploaded on SM platforms such as Instagram and Flickr. However, we did not find any literature reference in the last five years that mentioned the use of Instagram, a fact that could be explained, based on our experience, because pictures published on Instagram are accessed through Twitter. Flickr is an American image and video hosting platform which has been used in military defence [66] to monitor and evaluate post-disaster tourism recovery after typhoon Haiyan [67] and to prioritize the collection of RS imagery as a filtering tool after the Colorado floods [68]. However, at the time of writing, Flickr has not been used yet in earthquake reconnaissance and could also be another suitable data source. We accept that neither crowdsourcing platforms nor SM constitutes groundbreaking science; instead, the process of automating the extraction of meaningful information from the text and image data they provide to support earthquake reconnaissance missions could be the future direction of research. Closed Circuit Television Videos can record the collapse pattern in buildings, which is essential information for earthquake reconnaissance. In the future, the data collected can be used to monitor socio-economic recovery, counting pedestrian traffic during the early recovery, recovery and development phases [7]; however, protocols for obtaining relevant CCTV images need to be developed.

References

  1. Zook, M.; Graham, M.; Shelton, T.; Gorman, S. Volunteered geographic information and crowdsourcing disaster relief: A case study of the haitian earthquake. World Med. Health Policy 2010, 2, 7–33.
  2. Abbasi, A.; Hossain, L.; Hamra, J.; Owen, C. Social networks perspective of firefighters’ adaptive behaviour and coordination among them. In Proceedings of the 2010 IEEE/ACM International Conference on Green Computing and Communications & International Conference on Cyber, Physical and Social Computing, Hangshou, China, 18–20 December 2010; pp. 819–824.
  3. Durham, T.S.; Johari, P.; Bausch, D. Strategic directions in seismic modeling: HAZUS® development and current applications for catastrophe planning. In Risk Assessment, Modeling and Decision Support: Strategic Directions; Bostrom, A., French, S., Gottlieb, S., Eds.; Springer: Berlin/Heidelberg, Germany, 2008; pp. 101–116.
  4. Vieweg, S.; Hughes, A.L.; Starbird, K.; Palen, L. Microblogging during two natural hazards events: What Twitter may contribute to situational awareness. In Proceedings of the The 28th International Conference on Human Factors in Computing Systems, Atlanta, GA, USA, 10–15 April 2010; Association of Computing Machinery: New York, NY, USA, 2010; pp. 1079–1088.
  5. Nazarian, E.; Taylor, T.; Weifeng, T.; Ansari, F. Machine-learning-based approach for post event assessment of damage in a turn-of-the-century building structure. J. Civil Struct. Health Monit. 2018, 8, 237–251.
  6. Gonzalez-Drigo, R.; Cabrera, E.; Luzi, G.; Pujades, L.G.; Vargas-Alzate, Y.F.; Avila-Haro, J. Assessment of post-earthquake damaged building with interferometric real aperture radar. Remote Sens. 2019, 11, 2830.
  7. Contreras, D. Fuzzy boundaries between post-disaster phases: The case of L’Aquila, Italy. Int. J. Disaster Risk Sci. 2016, 7, 277–292.
  8. Wartman, J.; Berman, J.W.; Bostrom, A.; Miles, S.; Olsen, M.; Gurley, K.; Irish, J.; Lowes, L.; Tanner, T.; Dafni, J.; et al. Research needs, challenges, and strategic approaches for natural hazards and disaster reconnaissance. Front. Built Environ. 2020, 6, 573068.
  9. Farrar, C.R.; Worden, K. An introduction to structural health monitoring. Philos. Trans. R. Soc. A Math. Phys. Eng. Sci. 2007, 365, 303–315.
  10. Miura, H.; Midorikawa, S.; Matsuoka, M. Building damage assessment using high-resolution satellite SAR images of the 2010 Haiti earthquake. Earthq. Spectra 2016, 32, 591–610.
  11. Stannard, M.; Galloway, B.; Brunsdon, D.; Wood, P.; Beattie, G.; McCarthy, S.; Toner, R.; Clark, A.; Nolan, J.; Stoecklein, A. Field Guide: Rapid Post Disaster Building Usability Assessment-Earthquakes; Ministry of Business, Innovation and Employment: Wellington, UK, 2014.
  12. Contreras, D.; Forino, G.; Blaschke, T. Measuring the progress of a recovery process after an earthquake: The case of L’Aquila, Italy. Int. J. Disaster Risk Reduct. 2018, 28, 450–464.
  13. Matsuoka, M.; Yamazaki, F. Use of satellite SAR intensity imagery for detecting building areas damaged due to earthquakes. Earthq. Spectra 2004, 20, 54762735.
  14. Contreras, D.; Blaschke, T.; Hodgson, M.E. Lack of spatial resilience in a recovery process: Case L’Aquila, Italy. Technol. Forecast. Soc. Chang. 2017, 121, 76–88.
  15. Sharma, R.C.; Tateishi, R.; Hara, K.; Nguyen, H.T.; Gharechelou, S.; Nguyen, L.V. Earthquake damage visualization (EDV) technique for the rapid detection of earthquake-induced damages using SAR data. Sensors 2017, 17, 235.
  16. Bossu, R.; Roussel, F.; Fallou, L.; Landès, M.; Steed, R.; Mazet-Roux, G.; Dupont, A.; Frobert, L.; Petersen, L. LastQuake: From rapid information to global seismic risk reduction. Int. J. Disaster Risk Reduct. 2018, 28, 32–42.
  17. Dong, L.; Shan, J. A Comprehensive Review of Earthquake-Induced Building Damage Detection with Remote Sensing Techniques; Elsevier: Amsterdam, The Netherlands, 2013; Volume 84, pp. 85–99.
  18. Fan, Y.D.; Wen, Q.; Wang, W.; Wang, P.; Li, L.L.; Zhang, P. Quantifying disaster physical damage using remote sensing data-a technical work flow and case study of the 2014 Ludian earthquake in China. Int. J. Disaster Risk Sci. 2017, 8, 471–488.
  19. Li, L.; Liu, X.; Chen, Q.; Yang, S. Building damage assessment from PolSAR data using texture parameters of statistical model. Comput. Geosci. 2018, 113, 115–126.
  20. Contreras, D.; Blaschke, T.; Kienberger, S.; Zeil, P. Myths and realities about the recovery of L’Aquila after the earthquake. Int. J. Disaster Risk Reduct. 2014, 8, 125–142.
  21. Cusicanqui, J.; Kerle, N.; Nex, F. Usability of aerial video footage for 3-D scene reconstruction and structural damage assessment. Nat. Hazards Earth Syst. Sci. 2018, 18, 1583–1598.
  22. Qadir, J.; Ali, A.; ur Rasool, R.; Zwitter, A.; Sathiaseelan, A.; Crowcroft, J. Crisis analytics: Big data-driven crisis response. J. Int. Humanit. Action 2016, 1, 12.
  23. Ragini, J.R.; Anand, P.M.R.; Bhaskar, V. Big data analytics for disaster response and recovery through sentiment analysis. Int. J. Inform. Manag. 2018, 42, 13–24.
  24. Foulser-Piggott, R.; Spence, R.; Eguchi, R.; King, A. Using remote sensing for building damage assessment: GEOCAN Study and validation for 2011 Christchurch earthquake. Earthq. Spectra 2016, 32, 611–631.
  25. Zhou, Z.; Gong, J. Automated analysis of mobile LiDAR data for component-level damage assessment of building structures during large coastal storm events. Comput.-Aided Civil Infrastruct. Eng. 2018, 33, 373–392.
  26. Rossetto, T.; D’Ayala, D.; Gori, F.; Persio, R.; Han, J.; Novelli, V.; Wilkinson, S.M.; Alexander, D.; Hill, M.; Stephens, S.; et al. The value of multiple earthquake missions: The EEFIT L’Aquila Earthquake experience. Bull. Earthq. Eng. 2014, 12, 277–305.
  27. Stone, H.; Putrino, V.; D’Ayala, D. Earthquake damage data collection using omnidirectional imagery. Front. Built Environ. 2018, 4, 14.
  28. Lan, Y.J.; Stavridis, A.; Kim, I.; Diaz-Fanas, G.; Heintz, J.; Hernández-Bassal, L.; Anzola, E.; Berkowitz, R.; Hussain, S.; Jalalian, A.; et al. ATC Mw7.1 Puebla-Morelos earthquake reconnaissance observations: Structural observations and instrumentation. Earthq. Spectra 2020, 36, 31–48.
  29. Lacassin, R.; Devès, M.; Hicks, S.P.; Ampuero, J.P.; Bossu, R.; Bruhat, L.; Daryono, Y.; Wibisono, D.F.; Fallou, L.; Fielding, E.J.; et al. Rapid collaborative knowledge building via Twitter after significant geohazard events. Geosci. Commun. 2020, 3, 129–146.
  30. Friedland, C.J. Residential Building Damage from Hurricane Storm Surge: Proposed Methodologies to Describe, Assess and Model. Building Damage; Louisiana State University: Baton Rouge, LA, USA, 2009.
  31. Mangalathu, S.; Burton, H. Deep learning-based classification of earthquake-impacted buildings using textual damage descriptions. Int. J. Disaster Risk Reduct. 2019, 36, 101111.
  32. Rathje, E.M.; Adams, B.J. The role of remote sensing in earthquake science and engineering: Opportunities and challenges. Earthq. Spectra 2008, 24, 471–492.
  33. Galvis, F.A.; Miranda, E.; Heresi, P.; Davalos, H.; Ruiz-Garcia, J. Overview of collapsed buildings in Mexico City after the 19 September 2017 (M(w)7.1) earthquake. Earthq. Spectra 2020, 36, 83–109.
  34. Roeslin, S.; Juarez-Garcia, H.; Elwood, K.J.; Dhakal, R.P.; Gomez-Bernar, A. The 19th September 2017 Puebla, Mexico earthquake: Final report of the New Zealand Reconnaissance Team. Bull. N. Z. Soc. Earthq. Eng. 2020, 53, 150–172.
  35. Xu, Z.; Lu, X.; Cheng, Q.; Guan, H.; Deng, L.; Zhang, Z. A smart phone-based system for post-earthquake investigations of building damage. Int. J. Disaster Risk Reduct. 2018, 27, 214–222.
  36. Franke, K.W.; Lingwall, B.N.; Zimmaro, P.; Kayen, R.E.; Tommasi, P.; Chiabrando, F.; Santo, A. Phased reconnaissance approach to documenting landslides following the 2016 Central Italy earthquakes. Earthq. Spectra 2018, 34, 1693–1719.
  37. Freddi, F.; Novelli, V.; Gentile, R.; Veliu, E.; Andreev, S.; Andonov, A.; Greco, F.; Zhuleku, E. Observations from the 26th November 2019 Albania earthquake: The earthquake engineering field investigation team (EEFIT) mission. Bull. Earthq. Eng. 2021, 19, 2013–2044.
  38. Wilkinson, S.; Free, M.; Grant, D.; Boon, D.; Paganoni, S.; Mason, A.; Williams, E.; Fraser, S.; Haskell, J. EEFIT Mission Report: The Christchurch New Zealand Earthquake of 22 February 2011; EEFIT: London, UK, 2011; p. 123.
  39. Mazzoni, S.; Castori, G.; Galasso, C.; Calvi, P.; Dreyer, R.; Fischer, E.; Fulco, A.; Sorrentino, L.; Wilson, J.; Penna, A.; et al. 2016–2017 Central Italy Earthquake Sequence: Seismic Retrofit Policy and Effectiveness. Earthq. Spectra 2018, 34, 1671–1691.
  40. Wilson, J.; Kelly, C.; Schootman, M.; Baker, E.; Banerjee, A.; Clennin, M.; Miller, D. Assessing the built environment using omnidirectional imagery. Am. J. Prevent. Med. 2012, 42, 193–199.
  41. Nguyen, Q.C.; Khanna, S.; Dwivedi, P.; Huang, D.; Huang, Y.; Tasdizen, T.; Brunisholz, K.D.; Li, F.; Gorman, W.; Nguyen, T.T.; et al. Using Google Street View to examine associations between built environment characteristics and U.S. health outcomes. Prevent. Med. Rep. 2019, 14, 100859.
  42. Berland, A.; Lange, D.A. Google street view shows promise for virtual street tree surveys. Urban. For. Urban. Green. 2017, 21, 11–15.
  43. Booth, E.; Wilkinson, S.; Spence, R.; Free, M.; Rossetto, T. EEFIT: The UK Earthquake Engineering Field Investigation Team; University College London: London, UK, 2011; pp. 117–123.
  44. Contreras, D. Designing a Spatial Planning Support System for Rapid Building Damage Survey After an Earthquake: The Case of Bogotá D.C., Colombia. Master’s Thesis, University of Twente, Enschede, The Netherlands, 2009.
  45. Hess, M.; Petrovic, V.; Yeager, M.; Kuester, F. Terrestrial laser scanning for the comprehensive structural health assessment of the Baptistery di San Giovanni in Florence, Italy: An integrative methodology for repeatable data acquisition, visualization and analysis. Struct. Infrastruct. Eng. 2018, 14, 247–263.
  46. What3 Words. Available online: https://what3words.com/suene.madera.granja (accessed on 18 May 2021).
  47. Contreras, D.; Blaschke, T.; Tiede, D.; Jilge, M. Monitoring recovery after earthquakes through the integration of remote sensing, GIS, and ground observations: The case of L’Aquila (Italy). Cartogr. Geogr. Inform. Sci. 2016, 43, 115–133.
  48. Fytsilis, A.L.; Prokos, A.; Koutroumbas, K.D.; Michail, D.; Kontoes, C.C. A methodology for near real-time change detection between unmanned aerial vehicle and wide area satellite images. ISPRS J. Photogramm. Remote Sens. 2016, 119, 165–186.
  49. Bossu, R.; Fallou, L.; Landès, M.; Roussel, F.; Julien-Laferrière, S.; Roch, J.; Steed, R. Rapid public information and situational awareness after the 26 November 2019, Albania earthquake: Lessons learned from the lastquake system. Front. Earth Sci. 2020, 8, 1–15.
  50. Quitoriano, V.; Wald, D.J. USGS “Did You Feel It?”—Science and lessons from 20 years of citizen science-based macroseismology. Front. Earth Sci. 2020, 8, 120.
  51. Finazzi, F. The earthquake network project: A platform for earthquake early warning, rapid impact assessment, and search and rescue. Front. Earth Sci. 2020, 8, 243.
  52. Fallou, L.; Bossu, R.; Landès, M.; Roch, J.; Roussel, F.; Steed, R.; Julien-Laferrière, S. Citizen seismology without seismologists? Lessons learned from mayotte leading to improved collaboration. Front. Commun. 2020, 5, 49.
  53. Contreras, D.; Wilkinson, S.; Fallou, L.; Landès, M.; Tomljenovich, I.; Bossu, R.; Balan, N.; James, P. Assessing emergency response and early recovery using Sentiment Analysis (SA). The case of Zagreb, Croatia. In Proceedings of the 1st Croatian Conference on Earthquake Engineering (1CroCEE) 2021, Zagreb, Croatia, 9 March 2021; pp. 743–752.
  54. Contreras, D.; Wilkinson, S.; Fallou, L.; Landès, M.; Tomljenovich, I.; Bossu, R.; Balan, N.; James, P. Supervised Polarity and Topic Classification of LastQuake app user’s Pictures With Comments—Zagreb 2020 Earthquake; Dataset; Newcastle University: Newcastle, UK, 2021.
  55. So, E.; Babić, A.; Majetic, H.; Putrino, V.; Verrucci, E.; Contreras, D.; Rossetto, T.; Wilkinson, S.; Keogh, C.; D’Ayala, D. The Zagreb Earthquake of 22 March 2020; EEFIT: Newcastle, UK, 2020; p. 94.
  56. Aktas, Y.; O’kane, A.; Köşker, A.; Özden, A.T.; Vatteri, A.P.; Durmaz, B.; Kazantzidou-Firtinidou, D.; Cotton, D.; Contreras, D.; Verruci, E.; et al. The Aegean Earthquake and Tsunami of 30 October 2020; IstructE: London, UK, 2021; p. 150.
  57. Contreras, D.; Wilkinson, S.; Fallou, L.; Landès, M.; Bossu, R.; Aktas, Y. Polarity and Topic Supervised Classification of LastQuake App User’s Comments-Aegean 2020 Earthquake; New Castle University: Newcastle upon Tyne, UK, 2021.
  58. Contreras, D.; Wilkinson, S.; Alterman, E. Supervised & Unsupervised Polarity Classification of Twitter Data Related to the Albania 2019 Earthquake; New Castle University: Newcastle upon Tyne, UK, 2021.
  59. Contreras, D.; Wilkinson, S.; Balan, N.; James, P. Assessing post-disaster recovery using sentiment analysis: The case of L’Aquila, Italy. Earthq. Spectra 2021.
  60. Contreras, D.; Wilkinson, S.; Balan, N.; James, P. L’Aquila 10th Anniversary after the 2009 Earthquake Twitter Data Polarity Supervised Classification; New Castle University: Newcastle upon Tyne, UK, 2021.
  61. Contreras, D.; Wilkinson, S.; Balan, N.; Phengsuwan, J.; James, P. Assessing post-disaster recovery using sentiment analysis. The case of L’Aquila, Haiti, Chile and Canterbury. In Proceedings of the 17th World Conference on Earthquake Engineering (17WCEE), Sendai, Japan, 13–28 September 2020.
  62. Contreras, D.; Wilkinson, S.; Hervas, J.; Balan, N.; James, P. Polarity Supervised Classification of Twitter Data Posted in English Related to the 10th Anniversary of the 2010 Maule Earthquake in Chile; New Castle University: Newcastle upon Tyne, UK, 2021.
  63. Simon, T.; Goldberg, A.; Adini, B. Socializing in emergencies—A review of the use of social media in emergency situations. Int. J. Inf. Manag. 2015, 35, 609–619.
  64. MonkeyLearn. Your guide to data cleaning & the benefits of clean data. MonkeyLearn 2021, 2021.
  65. Liang, W.T.; Lee, J.C.; Hsiao, N.C. Crowdsourcing platform toward seismic disaster reduction: The Taiwan scientific earthquake reporting (TSER) system. Front. Earth Sci. 2019, 7, 79.
  66. Papapesios, N.; Ellul, C.; Shakir, A.; Hart, G. Exploring the use of crowdsourced geographic information in defence: Challenges and opportunities. J. Geogr. Syst. 2019, 21, 133–160.
  67. Yan, Y.; Eckle, M.; Kuo, C.-L.; Herfort, B.; Fan, H.; Zipf, A. Monitoring and assessing post-disaster tourism recovery using geotagged social media data. ISPRS Int. J. Geo-Inf. 2017, 6, 144.
  68. Cervone, G.; Sava, E.; Huang, Q.; Schnebele, E.; Harrison, J.; Waters, N. Using Twitter for tasking remote-sensing data collection and damage assessment: 2013 Boulder flood case study. Int. J. Remote Sens. 2016, 37, 100–124.
More
Information
Subjects: Engineering, Civil
Contributor MDPI registered users' name will be linked to their SciProfiles pages. To register with us, please refer to https://encyclopedia.pub/register :
View Times: 597
Revisions: 3 times (View History)
Update Date: 28 Mar 2022
1000/1000
Video Production Service