4. Discussion
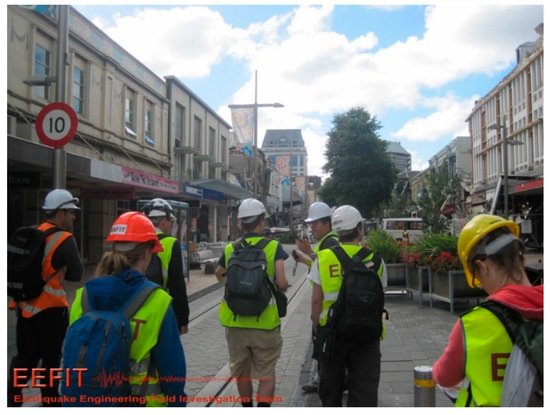
Building-by-building foot-on-ground surveys collect highly detailed data that can be used forensically to validate RS data or models such as structural models or fragility curves
[43][85]. However, they are expensive and time-consuming
[30][52], and the duration of these inspections can last for months
[29][44], depending on the availability of volunteers
[31][53], to reach a good understanding of the event’s characteristics
[29][44]. Nevertheless, it is necessary to differentiate between a rapid building damage survey
[44][86], which is focused on buildings’ safety during the emergency phase, and a detailed damage survey oriented to assessing the performance of building structures or the restoration of historic buildings
[45][29]. This second kind of damage survey can support early recovery planning and help to accomplish build-back-better and built-to-last. Now, smartphones allow quicker and more rigorous structural evaluations by filling in forms in apps containing all the necessary items to evaluate the damage to a building and collecting multimedia data. The collected photos can be indexed by their locations using GPS coordinates
[46][87] or what3words. Eventually, post-earthquake investigation data can be quickly uploaded to servers through the network of smartphones so that seismic damage data can be quickly shared to support decision making for post-disaster recovery
[35][55].
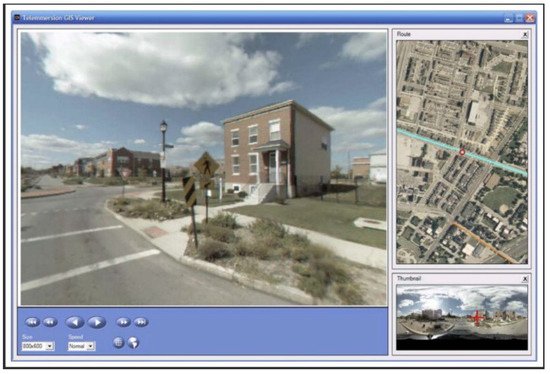
Omnidirectional imagery shows significant capabilities in identifying aggregated ‘low’ and ‘high’ damage grades, failure modes, number of stories and construction typologies. There are some potential issues with properly identifying disaggregated lower damage (e.g., damage grades 0–3 according to the European Macroseismic Scale-98)
[27][28]. The comparison of RVS and OD based post-earthquake survey data identified challenges to overcome. Those challenges are poor image quality; insufficient photosphere captures related to the extent of its overlap, lack of photos close enough to each other and obstructions such as trees, walls or vehicles
[27][28]. More advanced cameras could improve the image quality, and the gaps between pictures can be solved by reducing the distance between images (between 10 and 12 m)
[27][28], especially on obstructed streets (e.g., tree-lined). Moreover uncertainties related to the validity of the information inferred using this method and the challenges associated with collecting detailed data still need to be addressed. The TLS capture of the entire geometry of the Baptistery of San Giovanni in Florence, Italy, was not used in the context of an earthquake reconnaissance mission. However, we decided to include this reference for the suitability of this method in reconnaissance missions when they need to focus on the forensic analysis of world heritage (WH) buildings. Terrestrial laser scanning can collect highly detailed data of cracks, settlements, displacements and other damages in structural and nonstructural elements, the latter being especially important in these kinds of buildings. However, time to collect the data and training to operate this tool correctly is necessary.
The main advantage of using RS for building damage assessment is that large damaged areas can be surveyed rapidly without being hampered by the emergency operation on the ground
[24]. However, VHR satellite images useful for CD could be expensive, not be up-to-date, not match each other and contain clouds, making them useless for CD. An accurate damage detection can take some time while the objects in the images are classified, and the software algorithm in software is trained to detect changes related to damage
[47][30]. Smaller and particularly complex urban disaster scenes, multi-perspective aerial imagery obtained with UAVs and sUAV and derived dense colour 3-D models are increasingly employed to gather data. Hence, it would be interesting to investigate how the regulation for the operation of sUAVs affects the data collection rate and its delineation of areas affected by the earthquakes, and sUAV’s effectiveness as a detailed reference source for the tracking of recovery efforts during return missions. These data sources are an alternative to CD in satellite images in identifying damage, and they also remove challenges such as the images not matching
[48][31]. Currently, satellites are equipped with several RS payloads to complement airborne remote sensing and other UAVs. The result is a collaborative operated network involving multiple satellite observations, airborne RS and ground operations
[18].
Crowdsourcing information can be a cost-effective option to form a dense real-time accelerometric network, reducing uncertainties of rapid earthquake scenarios
[49][38]. Despite the intrinsic variability of felt reports, based on 20 years of DYFI experience
[50][36], it is possible to observe how felt reports have contributed to earthquake response and science and behaviour studies
[50][49][36,38]. Integrating DYFI data in ShakeMaps improves shaking estimates and the rapid assessment of an earthquake’s impact
[50][49][36,38]. The Earthquake Network app and MyShake app are similar. The main difference between these apps is that the data recorded by the accelerometer in the Earthquake Network app are not used to make any seismological analysis, and EEWs are sent only when several smartphones in the same area detect accelerations above a specified threshold
[51][37]. Currently, the main limitations of the EEW system implemented by the Earthquake Network are the lack of accuracy in the information of the earthquake intensity and that the geometry of the location of the smartphone network is not optimized regarding known faults
[51][37]. Among these apps, the EMSC was the first to consider the behaviour of users and their associated digital footprints to detect a widely-felt earthquake in an intersection between seismology, citizen science and digital communication. This approach was also compared with the manually and independently derived macroseismic datasets from DYFI
[49][38]. However, when looking at intensity levels reported by users, it is necessary to keep in mind that those living in low seismic zones tend to report an earthquake, regardless of the magnitude and/or impact displayed in the app user interface
[51][37]. Another common problem among citizen science projects is user retention, which could be solved by encouraging interaction with the app and other users to boost user lifetime value
[51][37]. In the case of Mayotte (2018), it was observed that while scientists were gathering on Twitter
[29][44], citizens were debating on Facebook about the same seismic phenomenon. The answers to the questions formulated on the STTM group were available on Twitter. This situation can be explained by the socio-technical design of the platforms and the technological culture. People use Facebook for daily and personal uses. Instead, Twitter has become a handy platform for researchers to exchange ideas, collaborate and share preliminary outcomes
[52][43].
Crowdsourcing and SM platforms tend to be the new data sources. Given the travel restrictions imposed by the COVID-19 pandemic, we started using them to collect data for the earthquake reconnaissance missions of the 2020 Zagreb earthquake
[53][54][55][88,89,90] and 2020 Aegean earthquake
[56][57][91,92], and even before the 2019 Albanian earthquake
[58][93] and earthquake reconnaissance missions in the long-term for the tenth anniversaries of the earthquakes in L’Aquila (Italy)
[59][60][61][94,95,96], Maule (Chile)
[59][62][94,97] and Port-au-Prince (Haiti)
[59][94]. We did not focus the review on SM platforms because there was already a literature review on this topic
[63][98]. The ubiquity of smartphones and SM has opened new opportunities for fast crowdsourcing and two-way communication between affected people and institutions/authorities
[49][38]. In some cases, one geotagged picture, an individual observation or objective comments on SM platforms can substantially reduce uncertainties regarding impacts
[49][38]. However, the scientific community still casts doubts on the utility and reliability of data collected in the framework of citizen science projects. Text and image data collected from SM are unstructured data that need a lot of cleaning
[64][99]. Then pre-processing and translation to English (in case of text data), which is time-consuming, before being useful for a supervised and/or an accurate unsupervised classification to extract meaningful information from them. Training users to post more objective and less emotional messages is necessary to obtain more useful damage and needs assessment data. The Institute of Earth Sciences, Academia Sinica in Taiwan, trained volunteer users among high school or junior high school teachers to ensure the quality of data collected through the crowdsourcing TERS system. These volunteers are trained in natural sciences, geology, historical earthquakes and associated surface damages, geohazards, TERS and volunteer reporting system, citizen seismology and field geology excursion with on-site practices
[65][42].
Earthquake reconnaissance missions can also take advantage of images uploaded on SM platforms such as Instagram and Flickr. However, we did not find any literature reference in the last five years that mentioned the use of Instagram, a fact that could be explained, based on our experience, because pictures published on Instagram are accessed through Twitter. Flickr is an American image and video hosting platform which has been used in military defence
[66][100] to monitor and evaluate post-disaster tourism recovery after typhoon Haiyan
[67][101] and to prioritize the collection of RS imagery as a filtering tool after the Colorado floods
[68][102]. However, at the time of writing, Flickr has not been used yet in earthquake reconnaissance and could also be another suitable data source. We accept that neither crowdsourcing platforms nor SM constitutes groundbreaking science; instead, the process of automating the extraction of meaningful information from the text and image data they provide to support earthquake reconnaissance missions could be the future direction of research. Closed Circuit Television Videos can record the collapse pattern in buildings, which is essential information for earthquake reconnaissance. In the future, the data collected can be used to monitor socio-economic recovery, counting pedestrian traffic during the early recovery, recovery and development phases
[7]; however, protocols for obtaining relevant CCTV images need to be developed.