Your browser does not fully support modern features. Please upgrade for a smoother experience.
Submitted Successfully!
 +1 credit
Thank you for your contribution! You can also upload a video entry or images related to this topic.
For video creation, please contact our Academic Video Service.
| Version | Summary | Created by | Modification | Content Size | Created at | Operation |
|---|---|---|---|---|---|---|
| 1 | Marcelo Andrés Umsza-Guez | + 2435 word(s) | 2435 | 2021-12-03 05:13:28 | | | |
| 2 | Beatrix Zheng | + 342 word(s) | 2777 | 2021-12-08 02:23:58 | | | | |
| 3 | Beatrix Zheng | + 342 word(s) | 2777 | 2021-12-08 02:24:51 | | |
Video Upload Options
We provide professional Academic Video Service to translate complex research into visually appealing presentations. Would you like to try it?
Cite
If you have any further questions, please contact Encyclopedia Editorial Office.
Umsza-Guez, M.A. Syrah Grape Skin Residues as Antioxidant Source. Encyclopedia. Available online: https://encyclopedia.pub/entry/16841 (accessed on 27 May 2026).
Umsza-Guez MA. Syrah Grape Skin Residues as Antioxidant Source. Encyclopedia. Available at: https://encyclopedia.pub/entry/16841. Accessed May 27, 2026.
Umsza-Guez, Marcelo Andrés. "Syrah Grape Skin Residues as Antioxidant Source" Encyclopedia, https://encyclopedia.pub/entry/16841 (accessed May 27, 2026).
Umsza-Guez, M.A. (2021, December 07). Syrah Grape Skin Residues as Antioxidant Source. In Encyclopedia. https://encyclopedia.pub/entry/16841
Umsza-Guez, Marcelo Andrés. "Syrah Grape Skin Residues as Antioxidant Source." Encyclopedia. Web. 07 December, 2021.
Copy Citation
In recent years, the valorization of agro-industrial by-products has become evident, due to the extensive information available on their valuable contents of bioactive compounds that promote many beneficial effects on human health, such as reducing the risk of developing chronic disease, e.g., cancer, neurodegenerative and cardiovascular diseases.
Vitis vinifera
agro-food waste
recovery
green technology
ultrasound assisted
polyphenols
1. Individual Bioactive Compounds by UAE from Syrah Var. Grape Skin Residue
The extracts obtained were analyzed by HPLC, and 19 individual phenolic compounds were quantified (Table 1). The best extracts were chosen in terms of total flavonoids at different temperatures (40, 50 and 60 °C) and ultrasound for 20 min from the different processes. The extract prepared at room temperature (25 °C) applying 20 min of ultrasound (UAE 25:20) was prepared to verify whether the ultrasound applied in the absence of high temperatures was capable of enhancing the extraction or degrading of compounds.
Table 1. Effect of ultrasound-assisted extraction under different process conditions (time-temperature) on the quantification of individual compounds present in Syrah var.
| Phenolic Compounds mg/100 g |
Extracts ‡ | |||||||
|---|---|---|---|---|---|---|---|---|
| Control 25 °C | UAE 25:20 | Control 40 °C | UAE 40:20 | Control 50 °C | UAE 50:20 | Control 60 °C | UAE 60:20 | |
| Phenolic acids | ||||||||
| Gallic acid | 9.6 ± 0.1 b | <LQ | 9.3 ± 0.5 b | <LQ | 10.2 ± 0.0 ab | <LQ | 14.9 ± 0.3 a | <LQ |
| Caffeic acid | 7.3 ± 0.1 ab | 6.4 ± 0.1 b | 8.6 ± 0.1 ab | 6.8 ± 0.0 ab | 8.4 ± 0.0 ab | 8.2 ± 0.1 ab | 9.9 ± 0.2 a | 7.9 ± 0.2 ab |
| Caftaric acid | 17 ± 0.1 ab | 14.2 ± 0.4 b | 20.7 ± 0.3 ab | 13.9 ± 0.1 b | 18.4 ± 0.1 ab | 22.4 ± 0.5 a | 22.1 ± 0.2 a | <LQ |
| Stilbenes | ||||||||
| Cis-resveratrol | 3.5 ± 0.1 ab | 2.9 ± 0.0 b | 2.9 ± 0.0 b | 3.6 ± 0.0 ab | 3.2 ± 0.0 b | ND | 4.3 ± 0.0 a | 3.6 ± 0.0 ab |
| Trans-resveratrol | 5.5 ± 0.1 ab | 4.7 ± 0.0 b | 4.9 ± 0.2 b | 5.0 ± 0.0 b | 5.8 ± 0.0 ab | ND | 6.3 ± 0.0 a | ND |
| Viniferin | 9.1 ± 0.2 bc | 7.6 ± 0.0 c | 9.3 ± 0.3 bc | 9.5 ± 0.0 abc | 9.5 ± 0.0 abc | 10.4 ± 0.1 ab | 12.1 ± 0.2 a | 9.4 ± 0.0 bc |
| Flavanols | ||||||||
| (+)-Catechin | 14.9 ± 0.5 ab | 12.9 ± 0.2 b | 16.5 ± 0.4 ab | 13.7 ± 0.0 b | 16.0 ± 0.3 ab | 14.6 ± 0.4 ab | 23.0 ± 0.4 a | 14.8 ± 0.2 ab |
| Procyanidin B1 | 21.1 ± 0.4 ab | 18.4 ± 0.1 b | 20.2 ± 0.8 b | 22.5 ± 0.1 ab | 19.7 ± 0.4 b | 23.8 ± 0.2 ab | 27.1 ± 0.2 a | 22.5 ± 0.2 ab |
| Procyanidin B2 | 25.1 ± 0.5 ab | 21.4 ± 0.2 b | 24.4 ± 0.5 ab | 23.7 ± 0.1 b | 22.4 ± 0.3 b | 24.6 ± 0.4 ab | 33.0 ± 0.4 a | 24.0 ± 0.3 b |
| Flavonols | ||||||||
| Kaempferol-3-O-glucoside | 12.1 ± 0.3 a | 13.4 ± 0.4 a | 12.5 ± 0.2 a | 10.4 ± 0.0 a | 16.8 ± 0.1 a | 6.7 ± 0.4 a | 19.9 ± 0.5 a | 11.1 ± 0.3 a |
| Quercetin-β-D-glucoside | 199.1 ± 5.1 c | 177.4 ± 3.8 de | 187.7 ± 6.2 cd | 110.4 ± 4.4 f | 167.9 ± 2.8 e | 288.9 ± 3.2 a | 247.7 ± 2.7 b | 112.5 ± 0.4 f |
| Isorhamnetin-3-glucoside-chloride | 68.4 ± 0.3 c | 40.1 ± 0.3 d | 65.3 ± 0.2 c | 39.3 ± 0.2 d | 64.5 ± 0.1 c | 99.0 ± 0.1 b | 77.6 ± 0.1 b | 43.8 ± 0.2 d |
| Myricetin | 37.4 ± 0.4 abc | 29.8 ± 0.5 c | 39.6 ± 0.2 ab | 17.7 ± 0.1 d | 34.1 ± 0.2 bc | 33.5 ± 0.3 bc | 43.9 ± 0.3 a | 16.2 ± 0.3 d |
| Rutin | 6.7 ± 0.2 ab | 7.4 ± 0.1 ab | 5.1 ± 0.1 b | 7.6 ± 0.0 ab | 6.9 ± 0.1 ab | 8.4 ± 0.1 ab | 8.7 ± 0.1 a | 8.4 ± 0.2 ab |
| Anthocyanins | ||||||||
| Malvidin-3-glucoside-chloride | 324.5 ± 3.2 a | 259.8 ± 1.5 b | 150.0 ± 6.4 d | 118.8 ± 5.2 e | 121.6 ± 2.9 e | 157.5 ± 3.3 d | 203.3 ± 3.8 c | 159.8 ± 5.3 d |
| Cyanidin-3-glucoside-chloride | 5.5 ± 0.1 ab | 4.8 ± 0.0 bc | 5.1 ± 0.2 bc | 5.8 ± 0.0 ab | 4.3 ± 0.1 c | 6.4 ± 0.0 a | 6.9 ± 0.0 a | ND |
| Pelargonidin-3-glucoside-chloride | 41.2 ± 0.5 a | 33.8 ± 0.5 ab | 21.9 ± 0.2 cd | 19.6 ± 0.1 d | 18.6 ± 0.1 d | 23.9 ± 0.1 cd | 28.0 ± 0.1 bc | 25.5 ± 0.1 cd |
| Delfinidine-3-O-glucoside | 17.4 ± 0.3 a | 12.4 ± 0.4 abc | 10.9 ± 0.2 bc | 11.0 ± 0.1 abc | 9.3 ± 0.1 c | 10.3 ± 0.2 bc | 16.0 ± 0.2 ab | 11.5 ± 0.2 abc |
| Peonidine-3-O-glucoside | 34.2 ± 0.5 a | 31.1 ± 0.2 a | 13.8 ± 0.3 d | 22.0 ± 0.1 bc | 14.7 ± 0.1 d | 24.6 ± 0.2 bc | 28.1 ± 0.2 ab | 19.5 ± 0.1 cd |
‡ The values (means ± SD) correspond to averages from three replicates. Different letters in the same line indicate significant differences between the values (p < 0.05). <LQ = limit of quantification; ND = not detected. Ultrasound-assisted extraction (UAE) at temperature 40 °C for 0 (UAE 40 °C: 0 min), 10 (UAE 40 °C: 10 min), 20 (UAE 40 °C: 20 min) and 30 (UAE 40 °C: 30 min), 50 °C for 0 (UAE 50 °C: 0 min), 10 (UAE 50 °C: 10 min), 20 (UAE 50 °C: 20 min) and 30 (UAE 50 °C: 30 min), and 60 °C for 0 (UAE 60 °C: 0 min), 10 (UAE 60 °C: 10 min), 20 (UAE 60 °C: 20 min) and 30 (UAE 60 °C: 30 min), respectively.
In the group of phenolic acids, caftaric acid was the one with the highest concentration in all extracts, except in UEA 60:20. Studies report caffeic acid as the main phenolic acid [1][2][3][4] in grape skins. Caffeic acid was the only compound of the group present in all extracts, however, the values verified were lower than those registered in the whole grape residue extracts [5]. In grape juices, gallic acid and phenolic acid are quantified in higher concentrations, however, this compound is mainly found in grape seeds [6].
In UAE 50:20 and UAE 60:20 extracts, trans-resveratrol was not determined in the analyses. According to Casazza, Aliakbarian, Mantegna, Cravotto, and Perego [7], trans-resveratrol is found in greater amounts in grape seeds than in skins. In the work of Natividade et al. [6], it was found that the content of trans-resveratrol present in the Syrah variety grape juice was also below the detection limit. The high temperatures associated with the use of ultrasound showed negative effects on the individual flavonoids in the extracts, since the control at 60 °C showed higher values for all compounds, compared to the US 60:20 extract. The same could be verified with the use of ultrasound at room temperature. Teixeira et al. [8] reported that procyanidin B2 is one of the most abundant flavonoids present in grape skins and seeds, a fact observed in this study, as this compound from the group of flavanols was the one with the highest concentration in the extracts.
Sonication did not influence the extraction of compounds from the flavonol group. The concentration of myricetin, for example, was higher in all extracts prepared without ultrasound pretreatment. Regarding the content of quercetin-3-β-D-glycoside and isohramnetin-3-O-glycoside in the samples, only the UAE 50:20 extract presented values higher than the control (50 °C). The compounds kaempferol-3-O-glucoside and rutin showed results with opposite trends: the use of ultrasound was relevant only for the former at room temperature, while the latter had higher concentrations in all extracts with the application of ultrasound, except at 60 °C. In general, these results are not in agreement with the work by Caldas et al. [9], in which the authors found greater extraction of flavonols with the use of ultrasound.
Among the anthocyanins, the compounds with the highest values were peonidin-3-O-glucoside, pelargonidin-3-O-glucoside and malvidin-3-O-glucoside. Melo et al. [10], when evaluating the phenolic profile of Syrah grape pomace grown in the region of the São Francisco Valley, found that the levels of peonidin-3-O-glycoside and malvidin-3-glycoside were also predominant in the anthocyanin group.
In this study, the malvidin-3-O-glucoside concentration range found for the extracts (118.8 ± 5.2 to 324.5 ± 3.2 mg/100 g) by UAE was greater than the values found in red grape pomace by conventional extraction, ultrasound-assisted extraction and microwave-assisted extraction [9].
It is important to emphasize that the amount of anthocyanins present in the grape is influenced by cultivation factors, such as: grape planting method, climatic aspects, physicochemical parameters (pH and temperature) [11][12].
The sum of the concentrations of the phenolic compounds in each group, under different extraction conditions are shown in Figure 1. It can be observed that the chemical groups with the highest concentrations in the extracts were anthocyanins and flavonols. Lingua, Fabani, Wunderlin, and Baroni [13] found that, similarly, the two groups were the main ones found in three different grape varieties (Syrah, Merlot, Cabernet Sauvignon), with anthocyanins being the compounds with the highest concentration in Syrah grapes. The authors also highlighted that malvidin and quercetin were the compounds in the highest concentrations in the samples, as shown in Table 1.
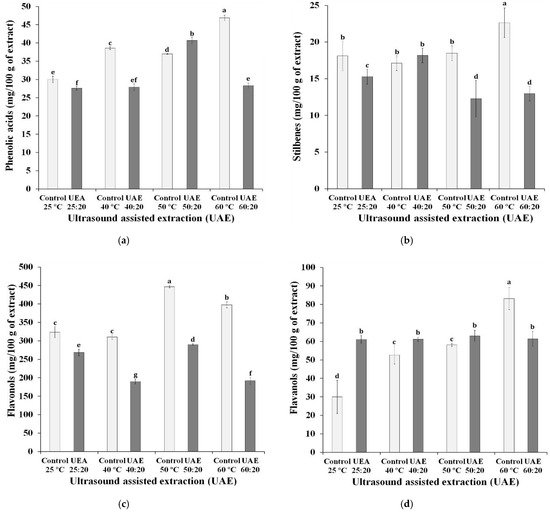
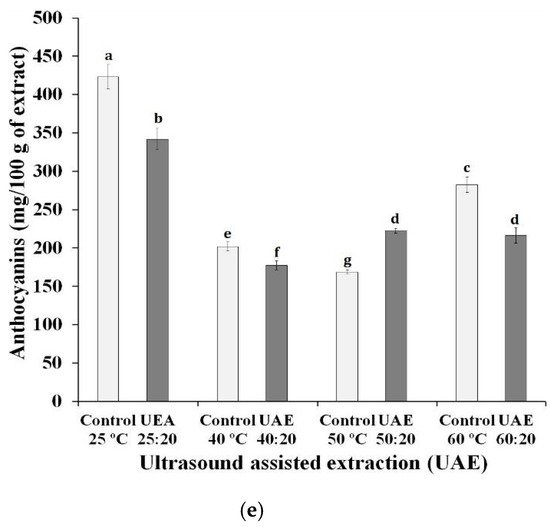
Figure 1. Effect of ultrasound-assisted extraction using different time-temperature processes on the content of (a) phenolic acids, (b) stilbenes, (c) flavonols, (d), flavanols and (e) anthocyanin compounds in Syrah var. Ultrasound-assisted extraction (UAE) at temperature 40 °C for 0 (UAE 40 °C: 0 min), 10 (UAE 40 °C: 10 min), 20 (UAE 40 °C: 20 min) and 30 (UAE 40 °C: 30 min), 50 °C for 0 (UAE 50 °C: 0 min), 10 (UAE 50 °C: 10 min), 20 (UAE 50 °C: 20 min) and 30 (UAE 50 °C: 30 min), and 60 °C for 0 (UAE 60 °C: 0 min), 10 (UAE 60 °C: 10 min), 20 (UAE 60 °C: 20 min) and 30 (UAE 60 °C: 30 min), respectively. Values with different superscript letters (a–g) between treatments differ significantly (p < 0.05) by the Turkey test multiple range tests. Each value is the mean ± SE (n = 3).
The application of high temperatures for the preparation of extracts showed a negative influence on the concentration of anthocyanins. The control sample at 25 °C, without ultrasound exposure, had the highest anthocyanin content, followed by the UAE 25:20 sample, both with statistically different values from the other extracts. With the exception of extracts prepared at a temperature of 50 °C, the use of ultrasound negatively influenced the anthocyanin content. Tiwari, Patras, Brunton, Cullen, and O’Donnell [14] reported possible changes in the concentrations of anthocyanins delphinidin-3-O-glucoside, cyanidin-3-O-glucoside and malvidin-3-O-glucoside, when the ultrasound was applied under different conditions (time of exposure to the ultrasound and amplitude level used in the equipment). Some authors suggest that the degradation of anthocyanins may be related to oxidation reactions caused by the interaction with free radicals formed during extraction using ultrasound [15]. The group of flavanols and flavonols showed similar behavior to that of anthocyanins, regarding the use of ultrasound, that is, all extracts exposed for 20 min to ultrasound reached values lower than those verified in extracts subjected exclusively to the influence of temperature, with the exception of the extracts prepared at 50 °C. These results suggest a possible disadvantage to the use of ultrasound, due to the degradation of the compounds.
As noted in this study, Li et al. [16] reported that flavonoids, whose main compounds are anthocyanins, flavanols and flavonols, are in greater abundance in grape skins. This characteristic is associated with the maturation of the grapes used in winemaking: the more ripe, the greater the occurrence of anthocyanins in the extracts and the lower the anthocyanin/flavanol ratio [17]. With the exception of flavonoids, phenolic acids are compounds present in plant matrices with a relevant biological effect [18].
In the analyzed samples, the phenolic acid concentration range (27.6 to 46.9 mg/100 g) was the lowest among the phenolic groups. This is because this class of phenolic compounds is found in greater concentration in grape pulp [16].
Stilbenes, a group that includes the trans-resveratrol compound, had the lowest concentration in the samples, however, fresh grape skins are indicated as an excellent source of resveratrol, with concentrations ranging from 50 to 100 µg/g [19]. Rockenbach et al. [20] did not detect the presence of trans-resveratrol in the skin of wine residue grapes. The authors suggest that the compound was transferred to the product made from grapes during manufacturing, which also justifies the low concentration of stilbenes in the extracts in this study. Fernández-Marín et al. [21] stated that the terroir is decisive for the stilbene content present in the grapes.
2. Free Radical Scavenging Activity of Extracts Obtained from Syrah Var. Using UAE
The content of phenolic compounds is generally associated with the presence of antioxidant activity in different plant matrices, including grapes [22].
To assess the antioxidant potential, the EC50 method was used, which calculates the amount of antioxidants needed to inhibit the initial concentration of the DPPH radical by 50% [23], therefore, the lower the concentration value, the higher will be the antioxidant capacity (Figure 2a). All extracts exposed for 20 min to ultrasound (UAE 40:20; UAE 50:20; UAE 60:20) are included in the group with the highest antioxidant potential (22, 20 and 16 mg/100 mL, respectively). These samples, when related to controls at each temperature, showed the increase of antioxidant activities in 47.6%, 50.0% and 61.0%, respectively. EC50 values above 250 mg/mL refer to the low antioxidant potential of the sample [24], therefore, it is possible to state that all extraction conditions applied in this research contributed to obtaining extracts with excellent antioxidant capacity, since the values ranged from 16.8 ± 0.2 to 48.7 ± 0.5 mg/100 mL.
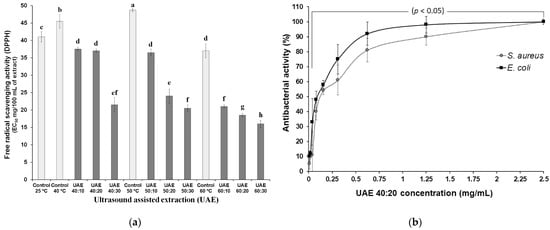
Figure 2. Effect of ultrasound-assisted extraction using different processes (time-temperature) (a) on the free radical scavenging activity and (b) on the antibacterial activity of the extract of skin of grape var. Syrah. Ultrasound-assisted extraction (UAE) at temperature 40 °C for 0 (UAE 40 °C: 0 min), 10 (UAE 40 °C: 10 min), 20 (UAE 40 °C: 20 min) and 30 (UAE 40 °C: 30 min), 50 °C for 0 (UAE 50 °C: 0 min), 10 (UAE 50 °C: 10 min), 20 (UAE 50 °C: 20 min) and 30 (UAE 50 °C: 30 min), and 60 °C for 0 (UAE 60 °C: 0 min), 10 (UAE 60 °C: 10 min), 20 (UAE 60 °C: 20 min) and 30 (UAE 60 °C: 30 min), respectively. Values with different superscript letters (a–h) between treatments differ significantly (p < 0.05) by the Turkey test multiple range tests. Each value is the mean ± SE (n = 3).
Some research carried out with grape skin extracts demonstrate the anti-radical potential, such as, Sridhara and Charles [25] who evaluated the scavenging activity of DPPH of grape skin extracts (var. Kyoho) and verified values between 77.92 and 95.71 mg/mL at the different concentrations tested. Park et al. [26] observed in three extracts (peel/pulp) of different grape varieties scavenging activity between 48.47 and 57.09%. Doshi et al. [27] verified antiradical activity of 4.2 and 1.8 (TE mM/mL) Pusa Navrang and Merlot variety, respectively.
From the values obtained from some compounds, the possible correlation between them was analyzed. The results for this assessment are shown in Table 2. The correlation between the total anthocyanin group and the compound malvidin-3-glucosside-chloride reached a value close to 1, thus being a positive correlation. This result ensures that the greater the total anthocyanin content in the sample, the higher the concentration of malvidin-3-glucoside-chloride, as predicted from previous results. Similar to this study, Antoniolli et al. [28] found that malvidin-3-glucoside-chloride was the predominant compound among the total anthocyanins analyzed in grape pomace.
Table 2. Correlation between phenolic compounds and antioxidant activity.
| Variables | EC50 | Total Flavonoid Content | Malvidin-3-Glucoside-Chloride | Total Anthocyanins | Total Phenolic Content | Procyanidin B2 |
|---|---|---|---|---|---|---|
| EC50 | - | −0.737 (<0.0001) | 0.480 (0.018) | 0.454 (0.026) | - | - |
| Total flavonoid content | −0.737 (<0.0001) | - | −0.478 (0.018) | −0.457 (0.025) | 0.441 (0.031) | - |
| Malvidin-3-glucoside-chloride | 0.480 (0.018) | −0.478 (0.018) | - | 0.996 (<0.0001) | −0.657 (0.000) | - |
| Anthocyanins | 0.454 (0.026) | −0.457 (0.025) | 0.996 (<0.0001) | - | −0.649 (0.001) | - |
| Total phenolic content | - | 0.441 (0.031) | −0.657 (0.000) | −0.649 (0.001) | - | 0.451 (0.027) |
| Procyanidin B2 | - | - | - | - | 0.451 (0.027) | - |
Both total anthocyanins and malvidin-3-glucoside-chloride did not correlate with the antioxidant activity of the extracts. According to Orak [29], the absence of correlation had already been confirmed in other studies. The total flavonoid content was the only one that achieved a significant correlation in terms of antioxidant potential (p < 0.0001). The negative value close to 1 suggests that these parameters behave in an inversely proportional manner. Knowing that the lower the value for IC50, the greater the antioxidant capacity, it is noted that the content of flavonoids has a positive influence for this parameter. The correlation between the total phenolic content and the total flavonoid content showed a value closer to zero than 1 (0.441), suggesting the lack of correlation between these parameters. The same occurred with the correlation between total phenolic content and procyanidin B2 (0.451).
Quercetin was also applied in the correlation analyses; however, it is not registered in Table 2 because it did not present statistically significant results with at least one of the parameters (p < 0.05). This fact, as well as the diffuse values for correlation, raise the possibility of degradation of some bioactive compounds due to the use of ultrasound during extraction [22].
3. Antimicrobial Activities of Extracts Obtained from Syrah Var. Using UAE
Some researchers highlight the antimicrobial action of compounds (such as polyphenols, flavonoids, others) preferentially present in grape skins [30][31] that could be used as natural preservatives in food [1]. As examples of these compounds, stilbenes and resveratrol can be cited, which act against phytopathogens such as Botrytis cinerea [32]. Resveratrol also has recognized antimicrobial activity against several species, such as Trichophyton tonsurans, Staphylococcus aureus, Pseudomonas aeruginosa, Enterococcus faecalis, Epidermophyton floccosum, Microsporum gypseum and Trichophyton mentagrophytes.
The extracts UAE 40:20, UAE 50:20, UAE 60:20 and their respective controls (40 °C, 50 °C and 60 °C) and the extract prepared without the application of ultrasound at room temperature (C:A) were also subjected to this analysis. However, the antibacterial activity was only observed in the UAE 40:20 extract (Figure 2b). This situation needs further research because the concentrations of phenolic acids, stilbenes, flavonols, flavanols, anthocyanin compounds, in addition to the free radical scavenging activity were almost the same in the evaluated samples. Many scientific works report that grape seeds contain greater amounts of total phenolic compounds when compared to skins, thus, extracts obtained from seeds have greater antimicrobial activities [26].
Figure 2b shows that, for E. coli, the extract showed high antibacterial activity up to a concentration of 0.62 mg/mL, with an MIC of 1.25 mg/mL and an MBC of 2.5 mg/mL. Staphylococcus aureus, on the other hand, was less sensitive to the antibacterial action of the UAE 40:20 extract, with MIC and MBC values at a concentration of 2.5 mg/mL. Contrary to what was shown in this study, Yeo, Leo, and Chan [33] and Silva et al. [1] found that the propolis extract obtained from UAE had better effects against Gram-positive bacteria than Gram-negative ones. Oliveira et al. [34] in a study carried out with grape pomace extract (var. Merlot and Syrah) obtained by supercritical extraction (SFE), reported that Gram-negative bacteria were more resistant to the antimicrobial effects of the extract, when compared to Gram-positive bacteria, however, the authors revealed that, for the extracts obtained by SFE with the application of ethanol as a co-solvent, no antimicrobial activity was observed. Katalinić et al. [35] used extracts made from the skins of 14 different grape varieties as an antimicrobial agent and showed that there were no significant differences in the resistance of Gram-positive and Gram-negative bacteria. Katalinić et al. [35] verified the antimicrobial effect (Gram-positive bacteria: Staphylococcus aureus, Bacillus cereus and Gram-negative bacteria Escherichia coli O157:H7, Salmonella Infantis, Campylobacter coli) of extracts from 14 grape skin varieties using the technique of microdilution. The minimum inhibitory concentrations (0.014–0.59 mg·GAE/mL), were found especially against Campylobacter and Salmonella.
Gram-negative bacteria have two layers in their cell membrane, unlike Gram-positive bacteria that have only one barrier, facilitating the penetration of lipophilic compounds [36][37]. However, according to Yeo et al. [33], the physicochemical characteristic of the extracts is the main factor for the distinct bioactive qualities between the samples, followed by the structural difference of the bacteria. The grape extracts under the conditions and concentration ranges tested were not able to inhibit the growth of the isolates (data not shown). The MIC and CFM for amphotericin B were 0.5 µg/mL and 4 µg/mL, respectively, for the Aspergillus fumigatus isolate, and 4 µg/mL and 16 µg/mL, for the Fusarium oxysporum sp. passiflorae.
References
- da Silva, G.V.; Machado, B.A.S.; de Oliveira, W.P.; da Silva, C.F.G.; de Quadros, C.P.; Druzian, J.I.; Ferreira, E.d.S.; Umsza-Guez, M.A. Effect of Drying Methods on Bioactive Compounds and Antioxidant Capacity in Grape Skin Residues from the New Hybrid Variety “BRS Magna”. Molecules 2020, 25, 3701.
- Dal Magro, L.; Goetze, D.; Ribeiro, C.T.; Paludo, N.; Rodrigues, E.; Hertz, P.F.; Klein, M.P.; Rodrigues, R.C. Identification of Bioactive Compounds From Vitis labrusca L. Variety Concord Grape Juice Treated With Commercial Enzymes: Improved Yield and Quality Parameters. Food Bioprocess Technol. 2016, 9, 365–377.
- Padilha, C.V.d.S.; Miskinis, G.A.; de Souza, M.E.A.O.; Pereira, G.E.; de Oliveira, D.; Bordignon-Luiz, M.T.; Lima, M.d.S. Rapid determination of flavonoids and phenolic acids in grape juices and wines by RP-HPLC/DAD: Method validation and characterization of commercial products of the new Brazilian varieties of grape. Food Chem. 2017, 228, 106–115.
- Amorim, F.L.; de Cerqueira Silva, M.B.; Cirqueira, M.G.; Oliveira, R.S.; Machado, B.A.S.; Gomes, R.G.; de Souza, C.O.; Druzian, J.I.; de Souza Ferreira, E.; Umsza-Guez, M.A.; et al. Physicochemical analysis of Apple and Grape Pomaces. Food Chem. 2018, 10, 319–337.
- Tournour, H.H.; Segundo, M.A.; Magalhães, L.M.; Barreiros, L.; Queiroz, J.; Cunha, L.M. Valorization of grape pomace: Extraction of bioactive phenolics with antioxidant properties. Ind. Crops Prod. 2015, 74, 397–406.
- Natividade, M.M.P.; Corrêa, L.C.; Souza, S.V.C.; Pereira, G.E.; Lima, L.C.O. Simultaneous analysis of 25 phenolic compounds in grape juice for HPLC: Method validation and characterization of São Francisco Valley samples. Microchem. J. 2013, 110, 665–674.
- Casazza, A.A.; Aliakbarian, B.; Mantegna, S.; Cravotto, G.; Perego, P. Extraction of phenolics from Vitis vinifera wastes using non-conventional techniques. J. Food Eng. 2010, 100, 50–55.
- Teixeira, A.; Baenas, N.; Dominguez-Perles, R.; Barros, A.; Rosa, E.; Moreno, D.A.; Garcia-Viguera, C. Natural bioactive compounds from winery by-products as health promoters: A review. Int. J. Mol. Sci. 2014, 15, 15638–15678.
- Caldas, T.W.; Mazza, K.E.L.; Teles, A.S.C.; Mattos, G.N.; Brígida, A.I.S.; Conte-Junior, C.A.; Borguini, R.G.; Godoy, R.L.O.; Cabral, L.M.C.; Tonon, R.V. Phenolic compounds recovery from grape skin using conventional and non-conventional extraction methods. Ind. Crops Prod. 2018, 111, 86–91.
- Melo, P.S.; Massarioli, A.P.; Denny, C.; Dos Santos, L.F.; Franchin, M.; Pereira, G.E.; Vieira, T.M.F.D.S.; Rosalen, P.L.; De Alencar, S.M. Winery by-products: Extraction optimization, phenolic composition and cytotoxic evaluation to act as a new source of scavenging of reactive oxygen species. Food Chem. 2015, 181, 160–169.
- Mulero, J.; Pardo, F.; Zafrilla, P. Journal of Food Composition and Analysis Antioxidant activity and phenolic composition of organic and conventional grapes and wines. J. Food Compos. Anal. 2010, 23, 569–574.
- Sousa, E.C.; Uchôa-Thomaz, A.M.A.; Carioca, J.O.B.; de Morais, S.M.; de Lima, A.; Martins, C.G.; Alexandrino, C.D.; Ferreira, P.A.T.; Rodrigues, A.L.M.; Rodrigues, S.P.; et al. Chemical composition and bioactive compounds of grape pomace (Vitis vinifera L.), Benitaka variety, grown in the semiarid region of Northeast Brazil. Food Sci. Technol. 2014, 34, 135–142.
- Lingua, M.S.; Fabani, M.P.; Wunderlin, D.A.; Baroni, M.V. In vivo antioxidant activity of grape, pomace and wine from three red varieties grown in Argentina: Its relationship to phenolic profile. J. Funct. Foods 2016, 20, 332–345.
- Tiwari, B.K.; Patras, A.; Brunton, N.; Cullen, P.J.; O’Donnell, C.P. Effect of ultrasound processing on anthocyanins and color of red grape juice. Ultrason. Sonochem. 2010, 17, 598–604.
- Tiwari, B.K.; O’Donnell, C.P.; Cullen, P.J. Effect of sonication on retention of anthocyanins in blackberry juice. J. Food Eng. 2009, 93, 166–171.
- Li, F.X.; Li, F.H.; Yang, Y.X.; Yin, R.; Ming, J. Comparison of phenolic profiles and antioxidant activities in skins and pulps of eleven grape cultivars (Vitis vinifera L.). J. Integr. Agric. 2019, 18, 1148–1158.
- Pinelo, M.; Arnous, A.; Meyer, A.S. Upgrading of grape skins: Significance of plant cell-wall structural components and extraction techniques for phenol release. Trends Food Sci. Technol. 2006, 17, 579–590.
- Meng, J.F.; Fang, Y.L.; Qin, M.Y.; Zhuang, X.F.; Zhang, Z.W. Varietal differences among the phenolic profiles and antioxidant properties of four cultivars of spine grape (Vitis davidii Foex) in Chongyi County (China). Food Chem. 2012, 134, 2049–2056.
- Baliga, M.S.; Katiyar, S.K. Chemoprevention of photocarcinogenesis by selected dietary botanicals. Photochem. Photobiol. Sci. 2006, 5, 243–253.
- Rockenbach, I.I.; Gonzaga, L.V.; Rizelio, V.M.; Gonçalves, A.E.d.S.S.; Genovese, M.I.; Fett, R. Phenolic compounds and antioxidant activity of seed and skin extracts of red grape (Vitis vinifera and Vitis labrusca) pomace from Brazilian winemaking. Food Res. Int. 2011, 44, 897–901.
- Fernández-Marín, M.I.; Guerrero, R.F.; García-Parrilla, M.C.; Puertas, B.; Ramírez, P.; Cantos-Villar, E. Terroir and variety: Two key factors for obtaining stilbene-enriched grapes. J. Food Compos. Anal. 2013, 31, 191–198.
- Medina-Torres, N.; Ayora-Talavera, T.; Espinosa-Andrews, H.; Sánchez-Contreras, A.; Pacheco, N. Ultrasound assisted extraction for the recovery of phenolic compounds from vegetable sources. Agronomy 2017, 7, 47.
- Chen, Z.; Bertin, R.; Froldi, G. EC50 estimation of antioxidant activity in DPPH* assay using several statistical programs. Food Chem. 2013, 138, 414–420.
- Xu, Y.; Burton, S.; Kim, C.; Sismour, E. Phenolic compounds, antioxidant, and antibacterial properties of pomace extracts from four virginia-grown grape varieties. Food Sci. Nutr. 2016, 4, 125–133.
- Sridhar, K.; Charles, A.L. In vitro antioxidant activity of Kyoho grape extracts in DPPH and ABTS assays: Estimation methods for EC50 using advanced statistical programs. Food Chem. 2019, 275, 41–49.
- Park, M.; Oh, J. Antioxidant and antimicrobial activities of muscadine grape extracts. Korean J. Food Preserv. 2015, 22, 12–18.
- Doshi, P.; Adsule, P.; Banerjee, K.; Oulkar, D. Phenolic compounds, antioxidant activity and insulinotropic effect of extracts prepared from grape (Vitis vinifera L.) byproducts. J. Food Sci. Technol. 2015, 52, 181–190.
- Antoniolli, A.; Fontana, A.R.; Piccoli, P.; Bottini, R. Characterization of polyphenols and evaluation of antioxidant capacity in grape pomace of the cv. Malbec. Food Chem. 2015, 178, 172–178.
- Orak, H.H. Total antioxidant activities, phenolics, anthocyanins, polyphenoloxidase activities of selected red grape cultivars and their correlations. Sci. Hortic. 2007, 111, 235–241.
- Jeandet, P.; Douillet-Breuil, A.-C.; Bessis, R.; Debord, S.; Sbaghi, M.; Adrian, M. Phytoalexins from the Vitaceae: Biosynthesis, Phytoalexin Gene Expression in Transgenic Plants, Antifungal Activity, and Metabolism. J. Agric. Food Chem. 2002, 50, 2731–2741.
- Marina, G.C.; Samantha, S.C.; Josiane, D.V.; Carlos, A.B.C.S.; Marcelo, A.U.-G.; Bruna, A.S.M. Phytochemical importance and utilization potential of grape residue from wine production. Afr. J. Biotechnol. 2017, 16, 179–192.
- Filip, V.; Plocková, M.; Šmidrkal, J.; Špičková, Z.; Melzoch, K.; Schmidt, Š. Resveratrol and its antioxidant and antimicrobial effectiveness. Food Chem. 2003, 83, 585–593.
- Yeo, K.L.; Leo, C.P.; Chan, D.J.C. Ultrasonic enhancement on propolis extraction at varied pH and alcohol content. J. Food Process Eng. 2015, 38, 562–570.
- Oliveira, D.A.; Salvador, A.A.; Smânia, A.; Smânia, E.F.A.; Maraschin, M.; Ferreira, S.R.S. Antimicrobial activity and composition profile of grape (Vitis vinifera) pomace extracts obtained by supercritical fluids. J. Biotechnol. 2013, 164, 423–432.
- Katalinić, V.; Možina, S.S.; Skroza, D.; Generalić, I.; Abramovič, H.; Miloš, M.; Ljubenkov, I.; Piskernik, S.; Pezo, I.; Terpinc, P.; et al. Polyphenolic profile, antioxidant properties and antimicrobial activity of grape skin extracts of 14 Vitis vinifera varieties grown in Dalmatia (Croatia). Food Chem. 2010, 119, 715–723.
- Silici, S.; Kutluca, S. Chemical composition and antibacterial activity of propolis collected by three different races of honeybees in the same region. J. Ethnopharmacol. 2005, 99, 69–73.
- Smith-Palmer, A.; Stewart, J.; Fyfe, L. Antimicrobial properties of plant essential oils and essences against five important food-borne pathogens. Lett. Appl. Microbiol. 1998, 26, 118–122.
More
Information
Subjects:
Food Science & Technology
Contributor
MDPI registered users' name will be linked to their SciProfiles pages. To register with us, please refer to https://encyclopedia.pub/register
:
View Times:
941
Revisions:
3 times
(View History)
Update Date:
08 Dec 2021
Table of Contents


Notice
You are not a member of the advisory board for this topic. If you want to update advisory board member profile, please contact office@encyclopedia.pub.
OK
Confirm
Only members of the Encyclopedia advisory board for this topic are allowed to note entries. Would you like to become an advisory board member of the Encyclopedia?
Yes
No
${ textCharacter }/${ maxCharacter }
Submit
Cancel
Back
Comments
${ item }
|
${ item.createdUser.fullName }
${ item.createdAt }
${ item.vote }
${ item.reply }
Delete
${ reply.createdUser.fullName }
${ reply.createdAt }
${ reply.vote }
Delete
There is no reply to this comment~
${ item.replyTextCharacter }/${ item.replyMaxCharacter }
Submit
Cancel
More
No more~
There is no comment~
${ textCharacter }/${ maxCharacter }
Submit
Cancel
${ selectedItem.replyTextCharacter }/${ selectedItem.replyMaxCharacter }
Submit
Cancel
Confirm
Are you sure to Delete?
Yes
No