 +1 credit
| Version | Summary | Created by | Modification | Content Size | Created at | Operation |
|---|---|---|---|---|---|---|
| 1 | Yih-Min Wu | + 2332 word(s) | 2332 | 2021-11-23 07:58:23 | | | |
| 2 | Lindsay Dong | + 161 word(s) | 2493 | 2021-11-29 10:15:23 | | | | |
| 3 | Lindsay Dong | Meta information modification | 2493 | 2021-11-29 10:38:35 | | |
Video Upload Options
With advancements in technology and data processing speed, risk mitigation tools, such as earthquake early warnings (EEW), have emerged as life-saving guards in many earthquake-prone countries. The seconds-long warning achieved during EEW may be very helpful in saving the lives of human beings by allowing them to flee from buildings (if possible), or to take the proper shelter, or to move to a safer place within a building.
1. Introduction
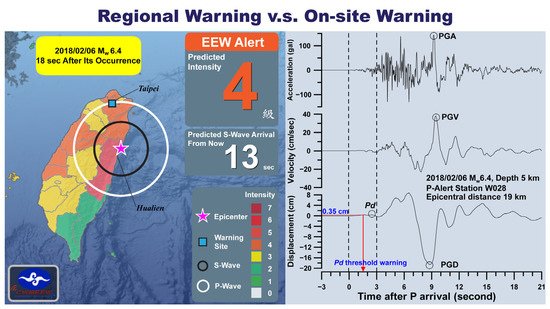
The EEW system, in its principle form, takes information related to basic phases (P-wave and other phases) from the real-time seismic signals, performs the elementary calculations, and, if needed, issues a warning. The EEW system is not limited to major earthquakes only, but also targets smaller earthquakes, which may cause high shaking in local areas, as well. EEW systems are generally categorized as regional (network-based) and on-site (single station or network-based) systems. The regional system consists of several sensors placed around the fault/source, and seismic signals from these instruments are transferred continuously to the central station for processing [1][2][3][4][5]. The regional EEW system exploits the use of P-wave and some S-wave information [6] to estimate the location and magnitude of the earthquake and to predict the ground-shaking at farther distances using ground-motion prediction equations (GMPE). Once the earthquake is triggered using short-term averaging (STA), long-term averaging (LTA), or another algorithm, the initial few seconds of data (typically 3–5 s) after the P-wave’s arrival is used to perform the calculations. The regional EEW system generally takes about 10–15 s to detect an earthquake and issue a warning. By that time, the damaging S-waves reach some of the locations close to the epicenter and a warning is not possible. The areas without a warning are termed “blind zones” and may range around 40–60 km from the epicenter, depending upon how quickly an earthquake is located. The problem of the blind zone can be overcome by the on-site EEW system, under which a single station installed in the proximity of the target area will immediately sense the earthquake and issue the warning. This system will use the P-wave information and estimate the ground shaking using empirical scaling relationships. The on-site warning system is faster than the regional system and can provide early warnings to sites located in the near-source region. The accuracy of the estimation of earthquake parameters is moderate for an on-site EEW, as it is a single sensor-based or a small network-based system. Figure 1 depicts the difference in time taken for the issuance of the regional and on-site warnings.
2. The P-Alert Sensors and EEW
3. Shakemaps Using P-Alert Network
The NTU network can generate near-real-time shakemaps during earthquakes. A shakemap is a contour demonstrating the PGA, or any other ground-motion parameter distributions, recorded from different strong-motion stations. A seismic network with closely spaced instruments will deliver these shakemaps precisely, as no interpolation is required. Once five P-Alert instruments record a PGA ≥ 1.5 gal, the network starts plotting shakemaps [13]. These shakemaps are updated at regular intervals after 30 s and are delivered to the intended users, including the National Science and Technology Center for Disaster Reduction (NCDR), for damage assessment and possible rescue operations. The shakemaps are also posted on social media, including Facebook and Twitter. With P-Alert instruments distributed all over the country, the shakemaps produced using this instrumentation offer detailed shaking patterns, which are helpful for assessing the damage pattern. The ability to provide shakemaps and to determine rupture direction using this instrumentation is discussed previously in many studies [14][15][16][17][18][19][20].
4. P-Alert Performance during Recent Damaging Events
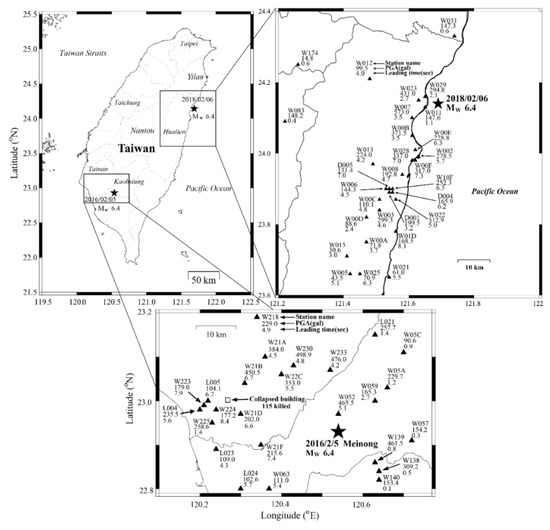
The NTU network has shown its ability to work as an on-site EEW system and provide near-real-time shakemaps during recent events. Hsieh et al. (2014) [21] discussed the performance of the P-Alert network during the two earthquakes of 27 March ( 6.1) and 2 June ( 6.3) 2013 that occurred in central Taiwan. The working of this network during the Meinong earthquake of 5 February 2016 was discussed by Wu et al. (2016) [4]. The Meinong earthquake was an inland earthquake that occurred in Southern Taiwan and caused more than 117 fatalities. A detailed shakemap was generated by the NTU network within two minutes of the earthquake’s occurrence and the high shaking regions observed in the maps agreed with the damage locations. The individual instrument also provided 4–8 s of on-site warning time before PGA arrival (Figure 5), which is crucial for the locations situated in the blind zone of regional warning. The instruments recorded high PGA values (497 gals) in the epicentral region. Using PGA and PGV shakemaps, it was observed that the highly damaged areas were in high PGV (>17 cm/s) regions.
5. Applications of P-Alert Networks
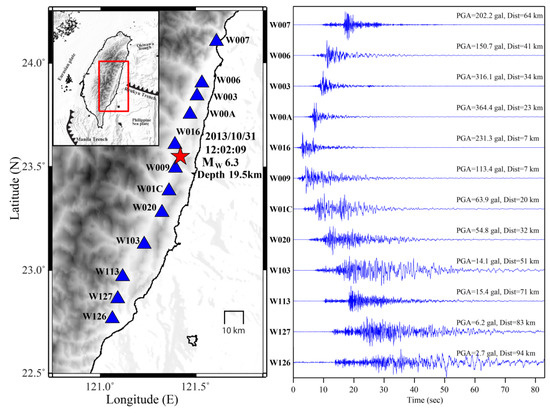
Rupture direction is the key parameter and can cause severe destruction, as the ground motion is amplified because of a piling-up of ground motion from near- and far-end instruments. The dense shakemaps generated using P-Alert instrumentation can be used to assess the rupture direction, which is one of the key factors in studying the damage pattern after an earthquake. Wu et al. (2016) [4] found that the rupture direction evaluated using shakemaps during the Meinong earthquake of 2016 agreed with aftershock distribution, which is a usual way of assessing rupture direction. The timely information of rupture direction can help save a lot of lives. The rupture direction using shakemaps from this network during the 2018 Hualien earthquake correlated well with aftershock distribution and surface ruptures [5], which again emphasizes the ability of this instrumentation in estimating rupture direction. Using real-time shakemap interpolation and attenuation regression, Jan et al. (2018) [23] tested the feasibility of using rupture direction from the near-source P-Alert instruments for delivering a warning to the far areas. They used 16 moderate-to-large earthquakes to infer that directivity can be obtained precisely within 17 s of the occurrence of an earthquake, which in turn is very helpful for EEW. Figure 6 shows the rupture direction evaluated using the recorded PGA at selected stations during the Hualien 6.3 earthquake of 2013. From the figure, the rupture direction is northeast–southwest and agrees well with aftershock distribution [14].
The near-real-time detailed shakemaps can identify the direction of the source rupture. Yang et al. (2018) [20] proposed a nontraditional regional EEW system based on time-dependent anisotropic PGA attenuation relationships that are based on real-time P-Alert signals, named “ShakingAlarm”. This is a ground-motion-driven approach using observed data from the source region to establish time-dependent anisotropic PGA attenuation and accurately predict the PGA for the far region before the arrival of the observed PGA.
Many multi-story buildings in different parts of the world need damage assessments post-earthquakes. The P-Alert instruments have proven efficient in structural health monitoring. Putting a minimum of only three of these instruments can accurately predict the structural health of any building after any earthquake. Hsu et al. (2018) [24] used P-Alert instruments and conducted several shake-table tests with incremental damage to check the performance of P-Alert for evaluating post-earthquake building safety. They found that acceptable damage detection for an entire building is possible using these instruments. The tests were conducted using three types of instruments. It was found that around 50% of P-Alert instruments were correct in identifying the damage level of each story of a building. However, when they aimed to detect the damage to the whole building, these devices displayed 100% correct results. It was concluded that, although P-Alert systems may be a poor indicator of damage location, they correctly depict the damage to an entire building.
6. Summary
References
- Allen, R.M.; Kanamori, H. The potential for earthquake early warning in Southern California. Science 2003, 300, 786–789.
- Kanamori, H. Real-time seismology and earthquake damage mitigation. Annu. Rev. Earth Planet. Sci. 2005, 33, 195–214.
- Satriano, C.; Wu, Y.M.; Zollo, A.; Kanamori, H. Earthquake Early Warning: Concepts, Methods and Physical Grounds. Soil Dyn. Earthq. Eng. 2011, 31, 106–118.
- Wu, Y.M.; Liang, W.T.; Mittal, H.; Chao, W.A.; Lin, C.H.; Huang, B.S.; Lin, C.M. Performance of a low-cost earthquake early warning system (P-alert) during the 2016 ML 6.4 Meinong (Taiwan) earthquake. Seismol. Res. Lett. 2016, 87, 1050–1059.
- Wu, Y.M.; Mittal, H.; Huang, T.C.; Yang, B.M.; Jan, J.C.; Chen, S.K. Performance of a Low-Cost Earthquake Early Warning System (P-Alert) and Shake Map Production during the 2018 Mw 6.4 Hualien, Taiwan, Earthquake. Seismol. Res. Lett. 2019, 90, 19–29.
- Wu, Y.M.; Shin, T.C.; Tsai, Y.B. Quick and reliable determination of magnitude for seismic early warning. Bull. Seismol. Soc. Am. 1998, 88, 1254–1259.
- Wu, Y.M.; Lin, T.L. A test of earthquake early warning system using low cost accelerometer in Hualien, Taiwan. In Early Warning for Geological Disasters—Scientific Methods and Current Practice; Wenzel, F., Zschau, J., Eds.; Springer: Berlin/Heidelberg, Germany, 2014; pp. 253–261. ISBN 978-3-642-12232-3.
- Wu, Y.M.; Lin, T.L.; Chao, W.A.; Huang, H.H.; Hsiao, N.C.; Chang, C.H. Faster short-distance earthquake early warning using continued monitoring of filtered vertical displacement: A case study for the 2010 Jiasian earthquake, Taiwan. Bull. Seismol. Soc. Am. 2011, 101, 701–709.
- Wu, Y.M.; Kanamori, H. Experiment on an onsite early warning method for the Taiwan early warning system. Bull. Seismol. Soc. Am. 2005, 95, 347–353.
- Wu, Y.M.; Kanamori, H. Rapid assessment of damaging potential of earthquakes in Taiwan from the beginning of P Waves. Bull. Seismol. Soc. Am. 2005, 95, 1181–1185.
- Wu, Y.M.; Kanamori, H. Development of an Earthquake Early Warning System Using Real-Time Strong Motion Signals. Sensors 2008, 8, 1–9.
- Chen, D.Y.; Hsiao, N.C.; Wu, Y.M. The Earthworm based earthquake alarm reporting system in Taiwan. Bull. Seismol. Soc. Am. 2015, 105, 568–579.
- Yang, B.M.; Mittal, H.; Wu, Y.M. Real-time production of PGA, PGV, Intensity, and Sa Shakemaps using Dense MEMS-Based Sensors in Taiwan. Sensors 2021, 21, 943.
- Hsieh, C.Y.; Wu, Y.M.; Chin, T.L.; Kuo, K.H.; Chen, D.Y.; Wang, K.S.; Chan, Y.T.; Chang, W.Y.; Li, W.S.; Ker, S.H. Low cost seismic network practical applications for producing quick shaking maps in Taiwan. Terr. Atmos. Ocean. Sci. 2014, 25, 617.
- Wu, Y.M.; Chen, D.Y.; Lin, T.L.; Hsieh, C.Y.; Chin, T.L.; Chang, W.Y.; Li, W.S.; Ker, S.H. A high-density seismic network for earthquake early warning in Taiwan based on low cost sensors. Seismol. Res. Lett. 2013, 84, 1048–1054.
- Chen, D.Y.; Wu, Y.M.; Chin, T.L. An empirical evolutionary magnitude estimation for early warning of earthquakes. J. Asian Earth Sci. 2017, 135, 190–197.
- Legendre, C.P.; Tseng, T.L.; Mittal, H.; Hsu, C.H.; Karakhanyan, A.; Huang, B.S. Complex wave propagation revealed by peak ground velocity maps in the Caucasus Area. Seismol. Res. Lett. 2017, 88, 812–821.
- Mittal, H.; Wu, Y.M.; Sharma, M.L.; Lin, T.L.; Yang, B.M. Shake maps generation for Delhi region using two different algorithms. In Proceedings of the 16th Symposium on Earthquake Engineering, Department of Earthquake Engineering, Roorkee, India, 20–22 December 2018. Paper No. 232.
- Mittal, H.; Wu, Y.M.; Lin, T.L.; Legendre, C.P.; Gupta, S.; Yang, B.M. Time-dependent shake map for Uttarakhand Himalayas, India, using recorded earthquakes. Acta Geophys. 2019, 67, 753–763.
- Yang, B.M.; Huang, T.C.; Wu, Y.M. ShakingAlarm: A Nontraditional Regional Earthquake Early Warning System Based on Time-Dependent Anisotropic Peak Ground-Motion Attenuation Relationships. Bull. Seismol. Soc. Am. 2018, 108, 1219–1230.
- Wu, Y.M.; Zhao, L. Magnitude estimation using the first three seconds P-wave amplitude in earthquake early warning. Geophys. Res. Lett. 2006, 33, L16312.
- Mittal, H.; Yang, B.M.; Tseng, T.L.; Wu, Y.M. Importance of real-time PGV in terms of Lead-Time and Shakemaps: Results using ML 6.2 & 2019 ML 6.3 Hualien, Taiwan Earthquakes. J. Asian Earth Sci. 2021, 220, 104936.
- Jan, J.C.; Huang, H.-H.; Wu, Y.M.; Chen, C.C.; Lin, C.H. Near real-time estimates on earthquake rupture directivity using near-field ground motion data from a dense low-cost seismic network. Geophys. Res. Lett. 2018, 45, 7496–7503.
- Hsu, T.Y.; Yin, R.C.; Wu, Y.M. Evaluating Post-Earthquake Building Safety Using Economical MEMS Seismometers. Sensors 2018, 18, 1437.


