Your browser does not fully support modern features. Please upgrade for a smoother experience.
Submitted Successfully!
 +1 credit
Thank you for your contribution! You can also upload a video entry or images related to this topic.
For video creation, please contact our Academic Video Service.
| Version | Summary | Created by | Modification | Content Size | Created at | Operation |
|---|---|---|---|---|---|---|
| 1 | Sabrina Simoncelli | + 1946 word(s) | 1946 | 2021-10-22 07:49:00 |
Video Upload Options
We provide professional Academic Video Service to translate complex research into visually appealing presentations. Would you like to try it?
Cite
If you have any further questions, please contact Encyclopedia Editorial Office.
Simoncelli, S. Quantitative Super-Resolution Imaging and GPCR Oligomerization Analysis. Encyclopedia. Available online: https://encyclopedia.pub/entry/16007 (accessed on 26 July 2026).
Simoncelli S. Quantitative Super-Resolution Imaging and GPCR Oligomerization Analysis. Encyclopedia. Available at: https://encyclopedia.pub/entry/16007. Accessed July 26, 2026.
Simoncelli, Sabrina. "Quantitative Super-Resolution Imaging and GPCR Oligomerization Analysis" Encyclopedia, https://encyclopedia.pub/entry/16007 (accessed July 26, 2026).
Simoncelli, S. (2021, November 15). Quantitative Super-Resolution Imaging and GPCR Oligomerization Analysis. In Encyclopedia. https://encyclopedia.pub/entry/16007
Simoncelli, Sabrina. "Quantitative Super-Resolution Imaging and GPCR Oligomerization Analysis." Encyclopedia. Web. 15 November, 2021.
Copy Citation
G-protein coupled receptors (GPCRs) are the largest family of cell surface receptors in eukaryotic cells. These seven-transmembrane receptors have influence in physiological events such as cell to cell communication, immune responses, nerve transmission and even hunger and sleep regulation. The role of GPCRs in diseases such as rheumatoid arthritis, heart disease, cancer, obesity, and neurodegenerative disorders accentuates the need to investigate this family of receptors further. More than a third of all drugs approved by the FDA target GPCRs but often such drugs have a variety of poorly understood mechanisms, as a recent example surrounding opioid receptor agonists illustrates.
super-resolution
DNA-PAINT microscopy
qPAINT
G-protein coupled receptors
purinergic receptor Y2 (P2Y2)
oligomerization
1. Introduction
GPCRs have been shown to form dimers and/or oligomers, where the receptor is present in groups of two or more receptors of the same or different kind. There are several reports of oligomers affecting ligand-binding pharmacology, function, trafficking, and internalisation compared to their monomeric form[1][2]. Several experimental techniques, ranging from traditional biochemical approaches to biophysical ensemble methods based on resonance energy transfer (RET), such as fluorescence resonance energy transfer (FRET) and bioluminescence resonance energy transfer (BRET), have been key to observing the formation of dimers and oligomers[3][4]. However, one of the main issues with these techniques is that they cannot provide information on the size of the oligomeric complexes, nor on the location of the GPCRs in the cell. Over the years, different optical microscopy approaches, based on molecular brightness analysis, have been proposed to tackle some of these shortcomings[5][6][7]. However, they provide average oligomerization information, and it is not possible to extract the precise stoichiometry of specific molecular complexes. A suitable technique to provide information on the oligomeric state of GPCRs and their dynamics down to the single-molecule level is single-molecule tracking[8][9][10]. Yet, this typically requires receptor densities that are orders of magnitude lower than those occurring in natural settings. The relevance of this shortcoming is particularly important when investigating GPCR oligomerization in certain cancer cell lines, where the receptors are overexpressed.
Here, we present a novel single-molecule based approach to study the oligomerization of a rhodopsin-like GPCR, the purinergic receptor Y2 (P2Y2), in a pancreatic cancer cell line with high expression of the receptor[11]. Our approach is based on the most recently developed single-molecule localization microscopy (SMLM) method named DNA-PAINT[12] (a variation of point accumulation for imaging in nanoscale topography) in combination with an imaging analysis pipeline suitable for protein quantification. DNA-PAINT is an SMLM technique that relies on the repetitive binding between two short complementary single-stranded DNAs, one conjugated to a fluorescent dye (imager strand) and the other chemically coupled to either a primary or secondary antibody targeting the protein of interest (docking strand). These short-lived transient events (millisecond to second range) create the necessary blinking required for SMLM, allowing the localization of the position of single molecules with nanometer precision[12]. Over the course of the experiment, these cumulative DNA binding events form a cluster of single molecule localizations within the true position of the biological target, as illustrated in Scheme 1. Depending on the DNA pair’s binding kinetics in particular the association rate, kon, and the imager DNA strand concentration, ci, each docking strand is visited by an imager at a frequency given by (kon *ci), which corresponds to the inverse of the dark time for a single docking strand (i.e., length of time that a docking strand is not bound to an imager strand between binding events)[13]. The frequency of the imagers binding to their docking strand scales linearly with the number of docking strands, and this is the principle of the quantitative analysis known as qPAINT (Scheme 1). The predictable binding kinetics between imager and docking strands make qPAINT suitable to accurately correlate the frequency of single-molecule events with the underlying number of labelled molecular targets[13], overcoming ‘overcounting’ artifacts observed with other SMLM techniques.
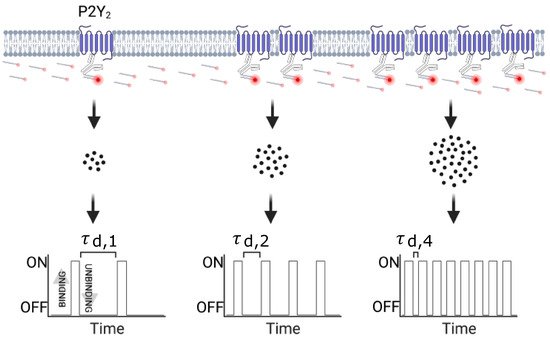
Scheme 1. Overview of qPAINT analysis pipeline (created with BioRender.com, BioRender, Toronto YTO, Canada).
To demonstrate the potential of qPAINT to study GPCRs oligomerization status, we investigated the nanoscale distribution of the P2Y2 receptor, a member of the d subgroup of the family A of GPCRs, in the cancer cell line AsPC-1, as it endogenously expresses high levels of this receptor and single cells are easily imaged due to its low levels of cell grouping[11]. P2Y2 has been related to immune regulation, bone mineralisation, intraocular pressure, HIV-1 infection, and cancer metastasis and proliferation[14][15][16][17]. P2Y2 has recently gained traction due to its role in several cancers such as breast, head and neck, prostate, and pancreatic [11][17][18][19]. This receptor, which can interact with adenosine triphosphate (ATP) and uridine triphosphate (UTP), is known to homo-dimerise and homo-oligomerise[20][21]. When applied to P2Y2, qPAINT revealed the molecular densities and nano- and micro-scale spatial arrangements of GPCRs down to the single molecule level, as well as their modulation in response to agonist and antagonist treatment. Understanding the natural oligomerisation state of P2Y2 and the effect of agonists and antagonists could inform the mechanist action of P2Y2 and aid in targeting it therapeutically.
2. Super-Resolution Imaging of P2Y2 Receptors in AsPC-1 Cells Using DNA-PAINT
To unravel the molecular organization of P2Y2 receptors in and near the plasma membrane of AsPC-1 cells, we used DNA-PAINT imaging under total internal reflection (TIR) excitation. Figure 1a shows a representative super-resolution image of P2Y2 obtained via DNA-PAINT. TIR excitation allows investigation of samples at or near the cell membrane by optically sectioning light illumination to only the most superficial ~100 nm of the sample. This is extremely beneficial in the study of GPCRs located at the plasma membrane as the receptors are typically not only at the cell membrane, but also at intracellular sites such as endosomes, endoplasmic reticulum, and the Golgi complex[22] and TIRF imaging minimizes their intracellular visualisation.
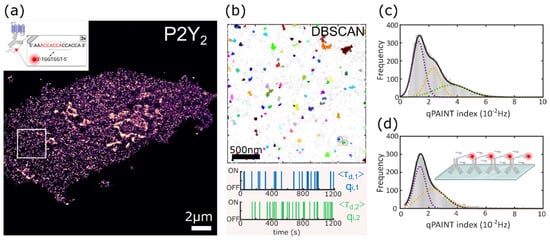
Figure 1. qPAINT calibration to determine qi. (a) Representative rendered DNA-PAINT image of P2Y2 proteins in an AsPC-1 cell. Inset shows a schematic representation of DNA docking and imager strand sequences displaying the 3× repeat binding motif (created with BioRender.com). White box indicates ROI for subsequent cluster analysis. (b) DBSCAN cluster analysis output for ROI indicated in (a). Non-clustered points are shown in grey. Box represents clusters used for subsequent single molecule on-off time series. (c) Histogram of internal calibration qPAINT indexes per cluster pooled from all data samples fit with a multi-Gaussian function. (d) Histogram of calibration sample qPAINT indexes per cluster from DNA coupled anti P2Y2 antibody deposited on glass fit with a multi-Gaussian function.
P2Y2 receptors were labelled with a primary antibody which we validated using the immortalised human pancreatic stellate cell line PS-1 as it expresses traces amounts of the protein of interest[11][23]. For DNA-PAINT imaging, the anti-P2Y2 receptor antibody was chemically coupled to an optimised docking strand sequence design to increase imaging speed. The docking strand features a repetitive (ACC)n sequence motif that provides 3× overlapping binding sites for the imager strand (Figure 1a, inset)[24]. The benefit of such docking sequence is not only the increase of imaging speed, but also the possibility to use relatively low imager strand concentrations achieving a high signal-to-noise ratio and single-molecule localisation precision. In our experiments we achieved an overall localisation precision of ~10 nm using a 1 nM concentration of imager strand fluorescently labelled with ATTO643, as determined by the nearest-neighbour-based analysis.
3. Discussion
Over the years, multiple optical microscopy techniques have been applied to the study of GPCR oligomerization, with one of the first single molecule imaging studies done by Kasai et al.[25]. Subsequently, both Spatial Intensity Distribution Analysis (SpIDA)[7][26] and molecular brightness approaches[5][6] were also developed and applied to study a variety of GPCRs. In recent years, single-molecule tracking and FRET imaging have also been applied to identify key factors in the regulation of GPCRs dynamic interactions in living cells[8][27]. While these techniques have been paramount to investigate the oligomeric organisation of GPCRs and the dynamic interactions that control GPCRs signalling, many challenges still remain; including the limitation of applicability to endogenous settings (i.e., many of these methods require labelled receptors or fusion proteins) and the possibility of multi-colour imaging to simultaneously study different types of hetero-oligomers. Most recently, dSTORM (direct stochastic optical reconstruction microscopy), a single-molecule super-resolution microscopy method, was employed to investigate the nanoscale organisation of a GPCR in presynaptic active zones[26], presenting a step-forward in visualising the organization of these receptors in endogenous conditions with nanoscale resolution. However, this was possible at the cost of increased experimental complexity, as the approach required transiently transfecting cells under controlled conditions to accurately quantify the number of receptors per cluster of single-molecule localizations.
As a novel method for quantitative analysis and nano-scale visualisation of the oligomeric state of GPCRs in single cells, here we employed a quantitative single molecule based super-resolution imaging technique based on DNA-PAINT, named qPAINT. Our approach allows the study of GPCR oligomerization in an endogenous setting, while avoiding the difficulties experienced with other SMLM techniques, such as dSTORM or PALM, to quantify the protein copy number[26][28]. During the last four years, examples of the use of qPAINT to quantify protein clustering in different biological systems have started to emerge[29][30][31]. This work is the first to employ qPAINT towards the study of GPCRs, a technique that can certainly help resolve contentious issues associated with GPCR oligomerization in different settings. Furthermore, due to the comparative advantages of DNA-PAINT over other SMLM techniques—it can routinely deliver lateral resolution in the 5–10 nm range and it allows multiplexing with a single laser source—it is straightforward to expand the applicability of qPAINT to detect and quantify GPCR hetero-oligomers. We note, however, that like any other technique that relies on antibody labelling, its applicability will depend on the availability of validated antibodies and that the final accuracy towards the absolute protein copy number is affected by the overall antibody-target binding efficiency, which can lead to potential undercounting. Still, by keeping data acquisition and analysis the same it is possible to draw conclusions about changes in the nanoscale distribution of the receptors in the different conditions. Furthermore, the presented approach is not suitable for live-cell imaging.
By leveraging the capabilities of qPAINT to its maximum potential, our study provides a detailed quantitative characterization of the density, spatial organization, and stoichiometry of the antibody labelled purinergic receptor Y2 oligomers in the pancreatic cancer cell line AsPC-1. Specifically, our data indicate that P2Y2 receptors are highly expressed in AsPC-1 cells with an average density of ca. 40 receptors per µm2. We find that P2Y2 receptors are mainly organised in nanodomains containing three or more sub-units, with only 20% of the receptors forming dimers and 10% distributed as monomers. Our results also show that while the oligomerization status of P2Y2 receptors does not change upon agonist treatment, there is a marked reduction of the percentage of P2Y2 receptors forming oligomers in antagonistic conditions. Our results are in line with current models for the P2Y2 receptor, which imply that homo-oligomeric assemblies of P2Y2 receptors are required for receptor internalisation and the effect of the antagonist prevents the formation of these complexes. Similar antagonist effects have been observed for CXCR4 and dopamine D3 GPCR receptors[32][33]. The fact that we did not observe significant difference in the oligomerisation of P2Y2 receptors in control and agonistic conditions suggest that oligomeric assemblies could be part and parcel of the natural activation of the receptor.
In conclusion, we demonstrated the accuracy and ease of implementation of qPAINT to quantitatively characterise the oligomeric state of GPCRs, alongside achieving single receptor visualisation. qPAINT analysis of the oligomeric state of P2Y2 revealed consistency with currently proposed models for this receptor[21][32][33].
References
- Xiaoqing Guo; Qin Li; Shulan Pi; Bo Hu; Yuanpeng Xia; Ling Mao; G Protein-Coupled Purinergic P2Y Receptor Oligomerization: Pharmacological Changes and Dynamic Regulation. Biochem. Pharmacol. 2021, 192, 114689, 10.22541/au.160684078.83449304/v1.
- Michel Bouvier; Oligomerization of G-protein-coupled transmitter receptors. Nature Reviews Neuroscience 2001, 2, 274-286, 10.1038/35067575.
- Hui Guo; Su An; Richard Ward; Yang Yang; Ying Liu; Xiao-Xi Guo; Qian Hao; Tian-Rui Xu; Methods used to study the oligomeric structure of G-protein-coupled receptors. Bioscience Reports 2017, 37, 37, 10.1042/bsr20160547.
- Chayma El Khamlichi; Flora Reverchon-Assadi; Nadège Hervouet-Coste; Lauren Blot; Eric Reiter; Séverine Morisset-Lopez; Bioluminescence Resonance Energy Transfer as a Method to Study Protein-Protein Interactions: Application to G Protein Coupled Receptor Biology. Molecules 2019, 24, 537, 10.3390/molecules24030537.
- Ali Işbilir; Robert Serfling; Jan Möller; Romy Thomas; Chiara De Faveri; Ulrike Zabel; Marco Scarselli; Annette G. Beck-Sickinger; Andreas Bock; Irene Coin; et al.Martin J. LohsePaolo Annibale Determination of G-protein–coupled receptor oligomerization by molecular brightness analyses in single cells. Nature Protocols 2021, 16, 1419-1451, 10.1038/s41596-020-00458-1.
- Michael R. Stoneman; Gabriel Biener; Richard J. Ward; John D. Pediani; Dammar Badu; Annie Eis; Ionel Popa; Graeme Milligan; Valerică Raicu; A general method to quantify ligand-driven oligomerization from fluorescence-based images. Nature Methods 2019, 16, 493-496, 10.1038/s41592-019-0408-9.
- Antoine G. Godin; Santiago Costantino; Louis-Etienne Lorenzo; Jody L. Swift; Mikhail Sergeev; Alfredo Ribeiro-Da-Silva; Yves De Koninck; Paul W. Wiseman; Revealing protein oligomerization and densities in situ using spatial intensity distribution analysis. Proceedings of the National Academy of Sciences 2011, 108, 7010-7015, 10.1073/pnas.1018658108.
- Titiwat Sungkaworn; Marie-Lise Jobin; Krzysztof Burnecki; Aleksander Weron; Martin Lohse; Davide Calebiro; Single-molecule imaging reveals receptor–G protein interactions at cell surface hot spots. Nature 2017, 550, 543-547, 10.1038/nature24264.
- Davide Calebiro; Finn Rieken; Julia Wagner; Titiwat Sungkaworn; Ulrike Zabel; Alfio Borzi; Emanuele Cocucci; Alexander Zürn; Martin J. Lohse; Single-molecule analysis of fluorescently labeled G-protein-coupled receptors reveals complexes with distinct dynamics and organization. Proceedings of the National Academy of Sciences 2012, 110, 743-748, 10.1073/pnas.1205798110.
- Marco Scarselli; Paolo Annibale; Peter J. McCormick; Shivakumar Kolachalam; Stefano Aringhieri; Aleksandra Radenovic; Giovanni U. Corsini; Roberto Maggio; Revealing G-protein-coupled receptor oligomerization at the single-molecule level through a nanoscopic lens: methods, dynamics and biological function. The FEBS Journal 2015, 283, 1197-1217, 10.1111/febs.13577.
- Lipeng Hu; Xiao-Xin Zhang; Shu-Heng Jiang; Ling-Ye Tao; Qing Li; Li-Li Zhu; Minwei Yang; Yan-Miao Huo; Yong-Sheng Jiang; Guang-Ang Tian; et al.Xiao-Yan CaoYan-Li ZhangQin YangXiao-Mei YangYa-Hui WangJun LiGary Guishan XiaoYongwei SunZhi-Gang Zhang Targeting Purinergic Receptor P2Y2 Prevents the Growth of Pancreatic Ductal Adenocarcinoma by Inhibiting Cancer Cell Glycolysis. Clinical Cancer Research 2018, 25, 1318-1330, 10.1158/1078-0432.ccr-18-2297.
- Schnitzbauer, J.; Strauss, M.T.; Schlichthaerle, T.; Schueder, F.; Jungmann, R.; Super-resolution microscopy with DNA-PAINT. Nature Protocols 2017 2017, 12, 1198–1228.
- Ralf Jungmann; Maier S Avendaño; Mingjie Dai; Johannes B Woehrstein; Sarit Agasti; Zachary Feiger; Zachary Feiger Avital Rodal; Ralf Jungmann Maier S Avendaño Mingjie Dai Johannes B Woehrstein Sarit S Agasti Peng Yin; Quantitative super-resolution imaging with qPAINT. Nature Methods 2016, 13, 439-442, 10.1038/nmeth.3804.
- Isabel R Orriss; Dilek Guneri; Mark O R Hajjawi; Kristy Shaw; Jessal J. Patel; Timothy R Arnett; Activation of the P2Y2 receptor regulates bone cell function by enhancing ATP release. Journal of Endocrinology 2017, 233, 341-356, 10.1530/joe-17-0042.
- Claire Séror; Marie-Thérèse Melki; Frédéric Subra; Syed Qasim Raza; Marlène Bras; Héla Saïdi; Roberta Nardacci; Laurent Voisin; Audrey Paoletti; Frédéric Law; et al.Isabelle MartinsAlessandra AmendolaAli A. Abdul-SaterFabiola CiccosantiOlivier DelelisFlorence NiedergangSylvain ThierryNajwane Said-SadierChristophe LamazeDidier MétivierJérôme EstaquierGian Maria FimiaLaura FalascaRita CasettiNazanine ModjtahediJean KanellopoulosJean-François MouscadetDavid OjciusMauro PiacentiniMarie-Lise GougeonGuido KroemerJean-Luc Perfettini Extracellular ATP acts on P2Y2 purinergic receptors to facilitate HIV-1 infection. Journal of Experimental Medicine 2011, 208, 1823-1834, 10.1084/jem.20101805.
- Gonzalo De La Rosa; Ana I. Gómez; María C. Baños; Pablo Pelegrín; Signaling Through Purinergic Receptor P2Y2 Enhances Macrophage IL-1β Production. International Journal of Molecular Sciences 2020, 21, 4686, 10.3390/ijms21134686.
- Wei-Hua Li; Ying Qiu; Hong-Quan Zhang; Xin-Xia Tian; Wei-Gang Fang; P2Y2 Receptor and EGFR Cooperate to Promote Prostate Cancer Cell Invasion via ERK1/2 Pathway. PLoS ONE 2015, 10, e0133165, 10.1371/journal.pone.0133165.
- Jiang-Lan Zhang; Ying Liu; Hui Yang; Hong-Quan Zhang; Xin-Xia Tian; Wei-Gang Fang; ATP-P2Y2-β-catenin axis promotes cell invasion in breast cancer cells. Cancer Science 2017, 108, 1318-1327, 10.1111/cas.13273.
- Lucas T. Woods; Kimberly Jasmer; Kevin Muñoz Forti; Vinit C. Shanbhag; Jean M. Camden; Laurie Erb; Michael J. Petris; Gary A. Weisman; P2Y2 receptors mediate nucleotide-induced EGFR phosphorylation and stimulate proliferation and tumorigenesis of head and neck squamous cell carcinoma cell lines. Oral Oncology 2020, 109, 104808, 10.1016/j.oraloncology.2020.104808.
- Maya Abe; Kanae Watanabe; Yoshiyuki Kuroda; Tetsuto Nakagawa; Hideyoshi Higashi; Homodimer formation by the ATP/UTP receptor P2Y2 via disulfide bridges. Journal of Biochemistry 2018, 163, 475-480, 10.1093/jb/mvy010.
- Ivana Kotevic; Karin Kirschner; Hartmut Porzig; Kurt Baltensperger; Constitutive interaction of the P2Y2 receptor with the hematopoietic cell-specific G protein Gα16 and evidence for receptor oligomers. Cellular Signalling 2005, 17, 869-880, 10.1016/j.cellsig.2004.11.011.
- Silvia Sposini; Aylin C. Hanyaloglu; Spatial encryption of G protein-coupled receptor signaling in endosomes; Mechanisms and applications. Biochemical Pharmacology 2017, 143, 1-9, 10.1016/j.bcp.2017.04.028.
- Sriram, K.; Salmerón, C.; Wiley, S.Z.; Insel, P.A; GPCRs in pancreatic adenocarcinoma: Contributors to tumour biology and novel therapeutic targets. Br. J. Pharmacol 2020, 177, 2434–2455.
- Sebastian Strauss; Ralf Jungmann; Up to 100-fold speed-up and multiplexing in optimized DNA-PAINT. Nature Methods 2020, 17, 789-791, 10.1038/s41592-020-0869-x.
- Rinshi Kasai; Kenichi G. N. Suzuki; Eric Prossnitz; Ikuko Koyama-Honda; Chieko Nakada; Takahiro Fujiwara; Akihiro Kusumi; Full characterization of GPCR monomer–dimer dynamic equilibrium by single molecule imaging. Journal of Cell Biology 2011, 192, 463-480, 10.1083/jcb.201009128.
- Sana Siddig; Sarah Aufmkolk; Sören Doose; Marie-Lise Jobin; Christian Werner; Markus Sauer; Davide Calebiro; Super-resolution imaging reveals the nanoscale organization of metabotropic glutamate receptors at presynaptic active zones. Science Advances 2020, 6, eaay7193, 10.1126/sciadv.aay7193.
- Wesley B. Asher; Peter Geggier; Michael D. Holsey; Grant T. Gilmore; Avik K. Pati; Jozsef Meszaros; Daniel S. Terry; Signe Mathiasen; Megan J. Kaliszewski; Mitchell D. McCauley; et al.Alekhya GovindarajuZhou ZhouKaleeckal G. HarikumarKhuloud JaqamanLaurence J. MillerAdam W. SmithScott C. BlanchardJonathan A. Javitch Single-molecule FRET imaging of GPCR dimers in living cells. Nature Methods 2021, 18, 397-405, 10.1038/s41592-021-01081-y.
- Kim Jonas; Francesca Fanelli; Ilpo T. Huhtaniemi; Aylin C. Hanyaloglu; Single Molecule Analysis of Functionally Asymmetric G Protein-coupled Receptor (GPCR) Oligomers Reveals Diverse Spatial and Structural Assemblies. Journal of Biological Chemistry 2015, 290, 3875-3892, 10.1074/jbc.m114.622498.
- Sabrina Simoncelli; Juliette Griffié; David J. Williamson; Jack Bibby; Cara Bray; Rose Zamoyska; Andrew P. Cope; Dylan M. Owen; Multi-color Molecular Visualization of Signaling Proteins Reveals How C-Terminal Src Kinase Nanoclusters Regulate T Cell Receptor Activation. Cell Reports 2020, 33, 108523, 10.1016/j.celrep.2020.108523.
- Izzy Jayasinghe; Alexander H. Clowsley; Ruisheng Lin; Tobias Lutz; Carl Harrison; Ellen Green; David Baddeley; Lorenzo Di Michele; Christian Soeller; True Molecular Scale Visualization of Variable Clustering Properties of Ryanodine Receptors. Cell Reports 2018, 22, 557-567, 10.1016/j.celrep.2017.12.045.
- Lisa S. Fischer; Christoph Klingner; Thomas Schlichthaerle; Maximilian T. Strauss; Ralph Böttcher; Reinhard Fässler; Ralf Jungmann; Carsten Grashoff; Quantitative single-protein imaging reveals molecular complex formation of integrin, talin, and kindlin during cell adhesion. Nature Communications 2021, 12, 1-10, 10.1038/s41467-021-21142-2.
- Sara Marsango; Gianluigi Caltabiano; Mireia Jiménez-Rosés; Mark J. Millan; John Pediani; Richard J. Ward; Graeme Milligan; A Molecular Basis for Selective Antagonist Destabilization of Dopamine D3 Receptor Quaternary Organization. Scientific Reports 2017, 7, 1-17, 10.1038/s41598-017-02249-3.
- Richard J. Ward; John D. Pediani; Sara Marsango; Richard Jolly; Michael R. Stoneman; Gabriel Biener; Tracy M. Handel; Valerică Raicu; Graeme Milligan; Chemokine receptor CXCR4 oligomerization is disrupted selectively by the antagonist ligand IT1t. Journal of Biological Chemistry 2021, 296, 100139, 10.1074/jbc.ra120.016612.
More
Information
Subjects:
Biophysics; Cell Biology
Contributor
MDPI registered users' name will be linked to their SciProfiles pages. To register with us, please refer to https://encyclopedia.pub/register
:
View Times:
779
Revision:
1 time
(View History)
Update Date:
15 Nov 2021
Table of Contents


Notice
You are not a member of the advisory board for this topic. If you want to update advisory board member profile, please contact office@encyclopedia.pub.
OK
Confirm
Only members of the Encyclopedia advisory board for this topic are allowed to note entries. Would you like to become an advisory board member of the Encyclopedia?
Yes
No
${ textCharacter }/${ maxCharacter }
Submit
Cancel
Back
Comments
${ item }
|
${ item.createdUser.fullName }
${ item.createdAt }
${ item.vote }
${ item.reply }
Delete
${ reply.createdUser.fullName }
${ reply.createdAt }
${ reply.vote }
Delete
There is no reply to this comment~
${ item.replyTextCharacter }/${ item.replyMaxCharacter }
Submit
Cancel
More
No more~
There is no comment~
${ textCharacter }/${ maxCharacter }
Submit
Cancel
${ selectedItem.replyTextCharacter }/${ selectedItem.replyMaxCharacter }
Submit
Cancel
Confirm
Are you sure to Delete?
Yes
No