Your browser does not fully support modern features. Please upgrade for a smoother experience.
Submitted Successfully!
 +1 credit
Thank you for your contribution! You can also upload a video entry or images related to this topic.
For video creation, please contact our Academic Video Service.
| Version | Summary | Created by | Modification | Content Size | Created at | Operation |
|---|---|---|---|---|---|---|
| 1 | Haleh Moghaddasi | + 3344 word(s) | 3344 | 2021-11-02 03:53:24 | | | |
| 2 | Camila Xu | Meta information modification | 3344 | 2021-11-10 06:54:43 | | | | |
| 3 | Camila Xu | Meta information modification | 3344 | 2021-11-10 06:55:43 | | | | |
| 4 | Lindsay Dong | Meta information modification | 3344 | 2021-11-12 09:20:45 | | |
Video Upload Options
We provide professional Academic Video Service to translate complex research into visually appealing presentations. Would you like to try it?
Cite
If you have any further questions, please contact Encyclopedia Editorial Office.
Moghaddasi, H.; Vanegas, J. Net Zero Energy Communities. Encyclopedia. Available online: https://encyclopedia.pub/entry/15854 (accessed on 27 June 2026).
Moghaddasi H, Vanegas J. Net Zero Energy Communities. Encyclopedia. Available at: https://encyclopedia.pub/entry/15854. Accessed June 27, 2026.
Moghaddasi, Haleh, Jorge Vanegas. "Net Zero Energy Communities" Encyclopedia, https://encyclopedia.pub/entry/15854 (accessed June 27, 2026).
Moghaddasi, H., & Vanegas, J. (2021, November 10). Net Zero Energy Communities. In Encyclopedia. https://encyclopedia.pub/entry/15854
Moghaddasi, Haleh and Jorge Vanegas. "Net Zero Energy Communities." Encyclopedia. Web. 10 November, 2021.
Copy Citation
Net Zero Energy Community (NZC) is an emerging concept with multiple variations in the scope and calculation methods, which complicates uniformly quantifying its targets.
net zero community
energy efficiency measures
electrification
renewable power systems
global energy mix
community energy balance
climate action targets
global warming
1. Net Zero Community Definition
Existing NZC definitions have differing requirements that complicate the achievement of NZC objectives [1][2][3][4][5]. Table 1 shows variations in supply and source in the selected publications.
Table 1. Variations in the current net zero community concept.
| NZC Definition | Net Zero Community/District | Onsite/Off-Site Energy | Source/Site Energy | Reference | Organization/ Journal |
|---|---|---|---|---|---|
| One that has greatly reduced energy needs through efficiency gains such that the balance of energy for vehicles, thermal, and electrical energy within the community is met by renewable energy. | Net Zero-Energy Community (ZEC) | Both | Site | Carlisle et al. 2009 [5] |
National Renewable Energy Laboratory (NREL) |
| A neighborhood in which the annual energy consumption for buildings and transportation of inhabitants is balanced by the production of on-site renewable energy. | zero-energy neighborhood (nZEN) | On-site | Site | Marique & Reiter 2014 [6] |
Energy and Buildings Journal |
| A cluster of residential units where the overall energy demand is low and is partly met by renewable energy self-produced within the neighborhood. | Nearly Zero energy Neighborhoods (ZenN) | Both | Site | Sørnes et al. 2014 [7] | IVL Swedish Environmental Research Institute |
| On a source energy basis, the actual annual delivered energy is less than or equal to the onsite renewable exported energy. | Zero Energy Community (ZEC) |
On-site | Source | Peterson et al. 2015 [8] |
US Department of Energy (DOE) |
| Aggregate multiple buildings and Optimize energy efficiency, district thermal energy, and renewable energy generation among those buildings so that on-site renewable energy can offset the energy use at the district scale. | Zero Energy Districts | On-site | Site | Pless et al. 2018 [9] | US National Renewable Energy Laboratory (NREL) |
| A district where energy supply/on-site potential is equalised by the final energy demand of its users. | Net Zero Energy District (NZED) | On-site | Site | Koutra et al. 2018 [10] |
Sustainable Cities and Society Journal |
| All of the community’s energy needs on a net annual basis must be supplied by on-site renewable energy. No combustion is allowed. | ZEC | On-site | Site | ILFI 2019 [11] |
International Living Future Institute (ILFI) US |
| A group of interconnected buildings with associated infrastructure, located within both a confined geographical area and a virtual boundary. An SPEN aims to reduce its direct and indirect energy use towards zero adopted over a complete year and to increase use and production of renewable energy according to a normalization factor. | Sustainable Plus Energy Neighborhoods (SPEN) | Both | Site | Salom and Tamm 2020 [12] |
Syn.ikia Norway |
| Energy-efficient and energy-flexible urban areas or groups of connected buildings which produce net zero GHG emissions and actively manage an annual local or regional surplus production of renewable energy. | Positive Energy District (PED) | Both | Site | Hinterberger et al. 2021 [13] |
JPI Urban Europe and SET-Plan 3.2 Programme Austria |
| A group of interconnected buildings with distributed energy resources such as solar energy systems, electric vehicles, charging stations and heating systems, located within a confined geographical area and with a well-defined physical boundary to the electric and thermal grids. | Zero Emission Neighborhoods in Smart Cities (FME ZEN) | Both | Site | Wiik et al. 2021 [14] |
Research Centre on Zero Emission Neighborhoods (ZEN) Norway |
Note: The Key terms, on-site/off-site energy and source/site energy are defined at the US Department of Energy (2015) [8].
The existing variations in defining a community NZ present a challenge to stakeholders such as developers and policymakers when attempting to implement NZC and track its progress. Polly et al. [15] noted that “stakeholders face a lack of documented processes, tools, and best practices to assist them in achieving zero energy districts”. Koutra et al. [10] claimed that “the term Net-Zero Energy District is an innovative concept still in progress growing prevalent during the last years and it is still restricted to the scientific literature review”. According to Kennedy [16], many communities aim to become “zero carbon”, yet “there are neither clear definitions for the scope of emissions that such a label would address on an urban scale, nor is there a process for qualifying the carbon reduction claims”. Carlisle et al. [5] concluded that “a definition for a zero-energy community is different and more complex than that of a ZEB because a community uses energy not only for buildings but also for industry, vehicles, and community-based infrastructure”.
To adapt an NZC concept, it is important to clarify existing variations in definitions and calculated methods. To do so, previous literature reviewed NZC variations, and the outcome presented different conclusions for each case [5][6][17][18].
Torcellini’s [17] NZ classification at the building level (NZB) from the National Renewable Energy Laboratory (NREL) was analyzed in [19]. Carlisle et al. [5] have expanded the four NZB classifications into NZCs to evaluate their energy performance, where a community may achieve one or more of the defined NZC summarized in Table 2.
Table 2. Net zero community definition classifications. Modified from Carlisle et al. [5] at NREL (2009).
| NZC | Buildings | Transport |
|---|---|---|
| NZ Site Energy | As much renewable energy is produced in the community for buildings and infrastructure as is needed by buildings and infrastructure in a year when accounted for at the site. | Measured vehicle miles traveled by community occupants regardless of whether they filled up their gas tank in the community or outside the boundary. |
| NZ Source Energy | A source ZEB produces at least as much energy as it uses in a year when accounted for at the source. Source energy refers to the primary energy used to generate and deliver the energy to the site. | For transportation fuel, source energy would include a multiplier to account for the energy required to transport the fuel to the fueling station. |
| NZ Energy Costs | In a cost ZEB, the amount of money the utility pays the building owners and the community (for renewable energy generated on all residential and community buildings and infrastructure) for the energy the building exports to the grid is at least equal to the amount the owner pays the utility for the energy services and energy used over the year. | By including transportation, the cost of the fossil-based fuels is offset by the fuel generated from renewable sources. |
| NZ Energy Emissions | A net zero emissions community produces and uses at least as much emissions-free renewable energy as it uses from emissions-producing energy sources annually. To calculate the total emissions of buildings and transportation, imported and exported energy are multiplied by the appropriate emission multipliers based on utility emissions and on-site generation emissions (if there are any). |
Carbon, NOx, and SOx are common emissions that ZEBs and transportation powered by renewable energy offset. |
According to Carlisle et al. [5], if a community generates at least 75% of its energy demand through on-site renewable supply, it is considered a “near-zero community”. Carlisle excluded off-grid communities from his classification [5].
However, Brozovsky et al. [18] commented on Carlisle’s NZC classification that “it is not made clear why these different terms were used or if they are supposed to be used as synonyms”. The authors concluded that although the interest in scientific NZC is growing, a variety of “coexisting terminologies” and different methodologies have been developed [18]. Brozovsky et al. [18] noted “this proliferation of terms causes not only confusion among the authors of scientific papers but makes it unnecessarily difficult for non-expert readers to follow”.
The key NZ variation parameters, including boundary, energy balance, time scale, emission source, energy type, renewable supply, and grid connections were highlighted in [19]. Table 3 summarizes the review publications on the NZC concept and presents the main challenges, existing variations, and requirements for adopting NZC.
Table 3. Review of NZC variation by selected publications.
| References | Review Focus | Challenges | Variations | Recommendations |
|---|---|---|---|---|
| Marique & Reiter 2014 [6] | A simplified framework to assess the feasibility of a zero-energy neighborhood/community | 1. Impact of urban form on energy needs and on-site renewable energy production 2. Impact of location on transportation energy consumption. 3. Lack of reports, calculated methods, and tools to quantify energy use, GHG emissions, and energy efficiency of scenarios. |
Concept of “zero energy” and “zero carbon”, scale (focus on individual buildings), energy balance, grid connections, political targets, energy source and supply, emission source, mode and location of renewables, assessment tools, site configuration, building orientation and shape, urban form on transport, timescale (daily, monthly, yearly), primary energy. | 1. The location of new buildings and developments is crucial in the total balance. 2. Consideration of renewable production, energy use in building and transportation sectors as an integrated system, rather than separated topics. |
| Amaral et al. 2018 [20] |
Performance of Nearly zero-energy districts |
Growth of complexity, lack of systematic literature, lack of inclusive energy modeling tools, interrelations between climatic and morphological indicators in methodology. | System boundaries, density, morphology, microclimates, public spaces, stakeholders, the concept of “community”, travel distance, energy source and supply, energy use specifications, source accessibility, solar capacity, distribution systems. | 1. Analysis of the correlation between geometric indicators and urban microclimate on the energy performance of districts. 2. Clarification of the metrics, calculation methods, and energy types in different methodologies. |
| Brozovsky et al. 2021 [18] |
Definitions, public initiatives, research gap, future research possibilities of zero emission neighborhoods and positive energy districts | Lack of: Clarity on the definition, target, key performance indicators; published a systematic review of low, nearly zero, zero, and positive energy/emission/carbon communities; clear definitions for every term exist; structured approach; articles that include embodied energy/emissions, LCA, microclimates, and social aspects of NZC; attention to the dimensions of the space (people and mobility) |
Different terminologies regarding reduced or minimized carbon emissions, different methodologies, balance boundary, mobility boundary, political, regulatory, economic, social, and technological features. | 1. Need for clear definitions and a structured approach to developing them. 2. Consistent and uniform description of targets, standard set of categories, key performance indicators, system boundaries, and spatial scales. 3. Social, microclimatic, economic considerations in future NZC research. 4. More NZC research outside of Europe and China is needed to cover a broader spectrum of climates and a wider geographical context. |
From the literature in Table 1, Table 2 and Table 3, the main variations in the existing NZC concept can be divided into five categories:
-
Multiple definitions, different terminologies and terms that create confusion and lack of clarity in adapting an NZC;
-
Lack of structured methods and inclusive energy modeling tools to verify committed NZC;
-
Lack of published reports and systematic literature on NZC characteristics;
-
Lack of clarity on system boundaries in definitions (i.e., mobility, travel distance, energy balance);
-
Variations in climatic and geographic context that directly impact energy loads and methodology.
Many publications conducted energy analyses at the community level [10][21][22][23][24][25][26][27][28][29]. Two selected studies are reviewed in this section to show differences in NZC implementation. Their optimization strategies are summarized to present their NZC variations, including a lack of consensus on the methodologies, system boundary, energy balance, climatic and geographic contexts, and infrastructure connections.
1.1. Bakhtavar et al. in 2020, Assessment of Renewable Energy-Based Strategies for NZCs
Bakhtavar et al. presented a multi-objective model through weighted goal programming to assess renewable energy strategies and deliver the optimal energy mix in net zero energy communities [30][31]. The authors included the application of life cycle assessment (LCA) and life cycle costing (LCC) as input data in their optimization model. The proposed model was applied to a case study in Canada (Table 4) to find the best renewable supply (RE) mix with the lowest undesirable outcomes.
Table 4. Proposed model for the case study, a medium-scale community in the Okanagan Valley, BC, Canada. Data from Bakhtavar et al. [30].
| Building Types | Number of Dwellings | Area of Units m2 | Average Energy Use (kWh) |
|---|---|---|---|
| Single-family detached house | 40 | 210 | 2259 |
| Single-family attached house | 2115 | 185 | 21,111 |
| Senior congregate care apartments | 725 | 102 | 12,778 |
Grey-based and other differently weighted energy planning approaches were set to find the optimal decisions, where the grey weighting program prioritized environmental impact reduction [30]. Figure 1 presents the result of five scenarios using different renewable technologies from the goal programming model.
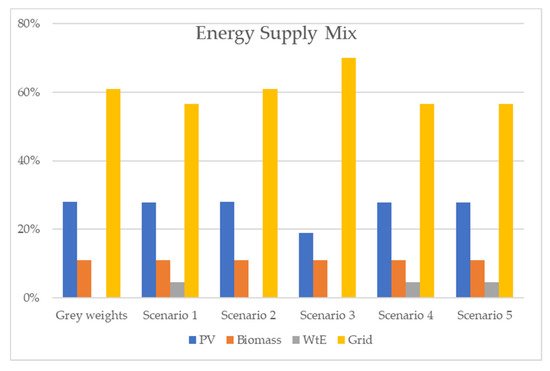
Figure 1. Optimal energy supply mix through different weighting scenarios, data from Bakhtavar et al. [30].
Grey weights and Scenario 2 presented the best solution for energy mix and RE fractions by recommending maximum biomass and PV with minimum waste-to-energy (WtE) capacities. Maximizing the capacity of RE caused reductions in total life cycle GHG emissions by 26.37%, life cycle impacts by 24.9%, and annual supply energy costs by 41.8% [30]. However, the increased cost from the investment, operation and maintenance of integrated renewable energy led to a payback period of 30 years [30].
1.2. Kim et al. in 2019, Techno-Economic Analysis of Hybrid Renewable Energy System with Solar District Heating for NZC
This study investigated a hybrid renewable energy system containing a heat pump, Seasonal Thermal Energy Storage (STES), solar thermal, and district heating networks in a net zero energy community through a techno-economic analysis [32]. A case study of Jincheon, an eco-friendly energy city in South Korea (area of 72,000 m2), was selected; it has 200 dwellings and six public buildings [32].
Kim et al. studied the impact of the solar fraction on levelized cost of heat (LCoH) and the impact of shifting to renewables, and performed an economic analysis of integration of thermal energy storage systems into the electricity and heating sector. A comparative analysis was conducted between three cases by using Transient System Simulation (TRNSYS) software: case 1, a gas-fired boiler and packaged air conditioning system; case 2, a centralized heat pump system; and case 3, a proposed HERS system [32].
The result showed that by increasing the solar fraction of the proposed system from 42.8% to 91.8%, case 3 saved 73% and 61% of primary energy consumption compared to case 1 and case 2, respectively. In addition, the calculated equivalent CO2 emissions presented a reduction of 17% compared to case 1 and 61% compared to case 2. The result of the LCoH analysis presented a 14% lower value for case 3 compared to case 1. Case 3 was selected as the best system pattern, and presented a benefit-cost ratio of 1.7 compared to both cases 1 and 2, with a six-year payback period [32].
The above studies underline the lack of a clear and common definition of NZC terms. For example, both studies use the term “net zero energy community”, yet transport energy use is excluded, NZC targets and timescale are not clarified. The case studies are in different locations, Canada and South Korea, with different scales and building types, yet the direct effect of their climate and geographical contexts on the NZC methodology are not clarified. Bakhtavar et al. included LCA and LCC in their NZC optimization approaches, while Kim et al. did not. From these NZC studies by Kim and Bakhtavar, it can be concluded that supply–demand balancing optimization with renewables at a community level has positive outcomes but challenging solutions due to renewable source accessibility, uncertainties and variabilities, programming tools, the economic feasibility of the source shift, system efficiency and reliability, technical complications, and financial barriers. The mentioned challenges will be investigated by reviewing the projection models for the global energy sectors from 2020 to 2050, as well as current NZC projects.
2. Planned NZC Precedent Cases
These cases were selected from the world’s pioneer planned NZ communities opened in 2000, 2002, and 2011 in Germany, London, and the US, respectively. The main energy technologies used in these cases included solar, wind, and CHP plant. Further EEMs and electrifications were used to reduce the peak loads including EV, EV charger/station, solar heating hot water, geothermal, heat pumps, high standard construction/lighting/appliances, and passive strategies. However, the communities have not achieved their NZ targets. The selected projects are the example of the world’s NZC cases from the literature [33][34][35][36][37][38][39][40][41][42][43] with supporting resources and potential to address their NZ targets. This section reviews NZC targets, energy strategies, savings, and challenges in each case.
The key challenges for data collection were the lack of updated literature in the last five years on the existing communities with NZC targets and of peer-reviewed publications to present the calculated measures and track the projects’ NZ progress. Most of the available documents are either old (before 2016) and/or published as technical reports, white papers, webpages, or handbooks. In some cases, the presented data varies between sources. For review purposes, approximate values were used to present data from the publications, as shown in Table 5.
Table 5. Planning characteristics of the worldwide precedent cases.
| Master Plan | Area (ha) |
Population | Dwellings | Density (du/ha) |
Year (Project Opened) |
|---|---|---|---|---|---|
| BedZED | 1.7 | 240 | 160 | 116 | 2002 |
| West Village | 83 | 4350 | 1006 | ~14 (4.5 du/acre) | 2011 |
| Kronsberg | 1200 | 15,00 | 6000 | 47 | 2000 |
Note: ha = hectare; and du/ha = dwelling units/hectare.
2.1. Beddington Zero Energy Development (BedZED), London
BedZED is the UK’s first and largest mixed-use eco-community. The project was completed in 2002 and is located in Hackbridge, London. BedZED community was designed by Bill Duster Architects in collaboration with the Peabody Trust (client) and Bioregional Development Group (environmental consultants) [44]. The project’s size is 1.7 hectares (ha), with 116 dwellings per hectare, including live/work units [37][39][45][46]. BedZED includes 99 homes, with 220 residents and 100 office workers [37][39]. The project was planned as a response to the UK’s Climate Change Action Act (1998–2002) to reduce CO2e emissions by 80% by 2050 compared to 1990 levels [45]. The NZC in BedZED was defined as “an excellent passive building envelope that reduces the demand for heat and power to the point where it becomes economically viable to use energy generated on-site from renewable resources” [37]. The project aimed to cover emissions from office and local energy use, embodied energy from construction, transports, food, and waste [39]. An 81% reduction in energy use for hot water (5.2 kWh/person/day) and a 45% reduction in electricity use (3.4 kWh/person/day) was reported, compared to the average in Sutton, London [39][44][45].
The primarily utilized energy strategies were solar PV to cover 20% of the electricity demand and a 130 kW-biomass CHP plant for the rest of the electricity and all the heating related to hot water [39][45][47][48]. The community included a six-plot terrace with 18 dwellings with roofs being covered with 777 sqm of PV [39][44][49]. The total renewable energy cost breakdown (PV and CHP) was 5.8% of the total construction cost of the community (£15,250,000) [37].
The CHP system was planned based on a downdraft gasification method that converts woodchips into gas to produce electricity through a generator [39][50]. The local street tree surgery waste, certified by the Forest Stewardship Council, was used as a sustainable fuel for the CHP plant [39][45]. When fully operational, the CHP plant required 20 tonnes/week of woodchips with a cost of USD 34/tonne [51].
One of the challenges regarding the CHP plant was related to noise. The CHP plant was planned to switch off between 1:00 am and 4:00 am, which lowered the noise [45]. However, the restart programming caused complications with tar forming during system cool down [39][50]. It was concluded that the CHP system operates more efficiently if it runs constantly for a community as small as BedZED [39][50].
CHP’s environmental savings were calculated as the generation of 726,000 kWh of electricity and 1,452,000 kWh of heat per year (with an average running time of 85% of the year) [37][51]. It is estimated that the CHP plant prevents about 326,000 kg of CO2 emission per year from national grid electric production compared to gas-fired power systems [37]. However, the CHP plant was decommissioned due to its maintenance complications and running costs [39][45][51]. It was concluded that generating all energy on-site for a community as small as 2 ha is a challenging solution [39]. Chance [39] recommended the use of CHP plants only with advanced consideration of proper management in selecting, installing, and maintaining energy equipment [39].
Regarding the transport sector, BedZED is committed to the Green Transport Plan (GTP) to reduce car energy use by 50% in 10 years by:
-
Reducing parking space (less than one per home compared to the UK’s typical 1.5/home);
-
Car club (London’s first one);
-
Solar-electric PV systems to power 40 electric vehicles;
-
Electric charging station (free with every two of four parking spaces);
-
Pedestrian and bike network (living streets);
-
Public transport (bus stops, train stations);
As an outcome, the residents drove an average of 2318 km per year, which was 64% less than the local average [39]. The literature noted that “while it may not have met the original goals, BedZED was still an important step in the right direction towards a sustainable future” [44]. BedZED homes reduced their CO2 emissions by 56% compared to the average UK home [39], which resulted in the community reducing its environmental impact by 20% to 30% by utilizing energy efficiency strategies in the construction stage [37][51].
The data reported on energy analyses and savings at the BedZED community are old (2007) and insufficient to track the project’s NZC progress. A detailed energy evaluation of the project with updated measured data needs to be included in the published documented reports.
References
- Hammon, R.W. Applications for Large Residential Communities: What is Net-zero Energy? Strateg. Plan. Energy Environ. 2010, 29, 26–55.
- Leibowicz, B.D.; Lanham, C.M.; Brozynski, M.T.; Vázquez-Canteli, J.R.; Nicolás Castillo, C.; Zoltan, N. Optimal decarbonization pathways for urban residential building energy services. Appl. Energy 2018, 230, 1311–1325.
- Vera, I.; Langlois, L. Energy indicators for sustainable development. Energy 2007, 32, 875–882.
- Kallushi, A.; Harris, J.; Miller, J.; Johnston, M.; Ream, A. Think Bigger: Net-Zero Communities. Proceedings of ACEEE 2012. pp. 115–127. Available online: https://www.aceee.org/files/proceedings/2012/data/papers/0193-000355.pdf (accessed on 8 August 2021).
- Carlisle, N.; van Geet, O.; Pless, S. Definition of a’Zero Net Energy’Community; National Renewable Energy Lab.(NREL): Golden, CO, USA, 2009.
- Marique, A.-F.; Reiter, S. A simplified framework to assess the feasibility of zero-energy at the neighbourhood/community scale. Energy Build. 2014, 82, 114–122.
- Sørnes, I.S.K.; Fredriksen, E.; Martinsson, F.; Romero, A.; Rodriguez, F.; Schneuwly, P. Nearly Zero Energy Neighborhoods. Final Report on Common Definition for nZEB Renovation. D.1.2 Report. 2014. Available online: https://smart-cities-marketplace.ec.europa.eu/sites/default/files/zenn_final_report_on_common_definition_for_nzeb_renovation.pdf (accessed on 14 September 2021).
- Peterson, L.; Torcellini, P.; Grant, R. A Common Definition for Zero Energy Buildings. Department of Energy (DOE). 2015. Available online: https://www.energy.gov/sites/prod/files/2015/09/f26/A%20Common%20Definition%20for%20Zero%20Energy%20Buildings.pdf (accessed on 3 February 2021).
- Pless, S.; Polly, B.J.; Zaleski, S. Communities of the Future: Accelerating Zero Energy District Master Planning. 2018. Available online: https://www.nrel.gov/docs/fy18osti/71841.pdf (accessed on 8 August 2021).
- Koutra, S.; Becue, V.; Gallas, M.-A.; Ioakimidis, C.S. Towards the development of a net-zero energy district evaluation approach: A review of sustainable approaches and assessment tools. Sustain. Cities Soc. 2018, 39, 784–800.
- International Living Future Institute (ILFI). The Living Community Challenge (LCC) Handbook: A Visionary Path to a Regenerative Future. In Living Community Challengesm 1.2; International Living Future Institute: Seattle, WA, USA, 2019.
- Salom, J.; Tamm, M. WP3 Technology Integration in Smart Managed Plus Energy Buildings and Neighbourhoods D3.1 Methodology Framework for Plus Energy Buildings and Neighbourhoods. 30-09-2020/M9. 2020. Available online: https://www.synikia.eu/wp-content/uploads/2020/12/D3.1_Methodology-framework-for-Plus-Energy-Buildings-and-Neighbourhoods.pdf (accessed on 14 September 2021).
- Hinterberger, R.; Gollner, C.; Noll, M.; Meyer, S.; Schwarz, H. Reference Framework for Positive Energy Districts and Neighbourhoods. 23 March 2020. Available online: https://jpi-urbaneurope.eu/wp-content/uploads/2020/04/White-Paper-PED-Framework-Definition-2020323-final.pdf (accessed on 9 September 2021).
- Wiik, M.R.K.; Fufa, S.M.; Fjellheim, K.; Lien, S.K.; Krogstie, J.; Ahlers, D.; Wyckmans, A.; Driscoll, P.; Brattebø, H.; Gustavsen, A. Zero Emission Neighbourhoods in Smart Cities. Definition, Key Performance Indicators and Assessment Criteria: Version 2.0. ZEN Report 2021. Available online: https://sintef.brage.unit.no/sintef-xmlui/bitstream/handle/11250/2738744/ZEN%2bReport%2bno%2b32.pdf?sequence=1&isAllowed=y (accessed on 14 September 2021).
- Polly, B.; Kutscher, C.; Macumber, D.; Schott, M.; Pless, S.; Livingood, B.; Van Geet, O. From zero energy buildings to zero energy districts. In Proceedings of the 2016 American Council for an Energy Efficient Economy Summer Study on Energy Efficiency in Buildings, Pacific Grove, CA, USA, 21–26 August 2016.
- Kennedy, S.; Sgouridis, S. Rigorous classification and carbon accounting principles for low and Zero Carbon Cities. Energy Policy 2011, 39, 5259–5268.
- Amaral, A.R.; Rodrigues, E.; Gaspar, A.R.; Gomes, Á. Review on performance aspects of nearly zero-energy districts. Sustain. Cities Soc. 2018, 43, 406–420.
- Brozovsky, J.; Gustavsen, A.; Gaitani, N. Zero emission neighbourhoods and positive energy districts—A state-of-the-art review. Sustain. Cities Soc. 2021, 72, 103013.
- Moghaddasi, H.; Culp, C.; Vanegas, J.; Ehsani, M. Net Zero Energy Buildings: Variations, Clarifications, and Requirements in Response to the Paris Agreement. Energies 2021, 14, 3760.
- Torcellini, P.; Pless, S.; Deru, M.; Crawley, D. Zero Energy Buildings: A Critical Look at the Definition; National Renewable Energy Lab. (NREL): Golden, CO, USA, 2006. Available online: https://www.nrel.gov/docs/fy06osti/39833.pdf (accessed on 25 December 2020).
- Ravindra, K.; Iyer, P.P. Decentralized demand–supply matching using community microgrids and consumer demand response: A scenario analysis. Energy 2014, 76, 32–41.
- Neves, D.; Silva, C.A.; Connors, S. Design and implementation of hybrid renewable energy systems on micro-communities: A review on case studies. Renew. Sustain. Energy Rev. 2014, 31, 935–946.
- Petersen, J.-P. Energy concepts for self-supplying communities based on local and renewable energy sources: A case study from northern Germany. Sustain. Cities Soc. 2016, 26, 1–8.
- Vindel, E.; Berges, M.; Akinci, B. Energy sharing through shared storage in net zero energy communities. In Journal of Physics: Conference Series; IOP Publishing: Lausanne, Switzerland, 2019.
- Gjorgievski, V.Z.; Chatzigeorgiou, N.G.; Venizelou, V.; Christoforidis, G.C.; Georghiou, G.; Papagiannis, G. Evaluation of Load Matching Indicators in Residential PV Systems-the Case of Cyprus. Energies 2020, 13, 1934.
- Parra, D.; Swierczynski, M.; Stroe, D.I.; Norman, S.A.; Abdon, A.; Worlitschek, J.; O’Doherty, T.; Rodrigues, L.; Gillott, M.; Zhang, X.; et al. An interdisciplinary review of energy storage for communities: Challenges and perspectives. Renew. Sustain. Energy Rev. 2017, 79, 730–749.
- Parra, D.; Norman, S.A.; Walker, G.S.; Gillott, M. Optimum community energy storage system for demand load shifting. Appl. Energy 2016, 174, 130–143.
- Palacios-Garcia, E.J.; Moreno-Munoz, A.; Santiago, I.; Moreno-Garcia, I.M.; Milanés-Montero, M. Smart community load matching using stochastic demand modeling and historical production data. In Proceedings of the 2016 IEEE 16th International Conference on Environment and Electrical Engineering (EEEIC), Florence, Italy, 7–10 June 2016.
- Moghaddasi, H.; Tabb, P.; Rashed-Ali, H. What It Takes to Become a Net Zero Development: Case Study of Serenbe, Georgia. Prometheus 2020, 4, 84–89. Available online: https://prometheus.library.iit.edu/index.php/journal/article/view/58 (accessed on 25 October 2021).
- Bakhtavar, E.; Prabatha, T.; Karunathilake, H.; Sadiq, R.; Hewage, K. Assessment of renewable energy-based strategies for net-zero energy communities: A planning model using multi-objective goal programming. J. Clean. Prod. 2020, 272, 122886.
- Xie, N. Interval grey number based project scheduling model and algorithm. Grey Syst. Theory Appl. 2018, 8, 100–109.
- Kim, M.-H.; Kim, D.; Heo, J.; Lee, D.-W. Techno-economic analysis of hybrid renewable energy system with solar district heating for net zero energy community. Energy 2019, 187, 115916.
- Gaiser, K.; Stroeve, P. The impact of scheduling appliances and rate structure on bill savings for net-zero energy communities: Application to West Village. Appl. Energy 2014, 113, 1586–1595.
- Fraker, H. A Road Map for the United States and Beyond. In The Hidden Potential of Sustainable Neighborhoods; Springer: Berlin/Heidelberg, Germany, 2013.
- Raibley, T.J. West Village Energy Initiative: Community Renewable Energy Deployment Project Renewable Energy Anaerobic Digester Feasibility Study; HDR Engineering, Inc.: Folsom, CA, USA, 2011. Available online: https://www.osti.gov/servlets/purl/1157557 (accessed on 28 June 2021).
- Wheeler, S.M.; Segar, R.B. Zero net energy at a community scale: UC Davis West village. In Energy Efficiency towards the End of Demand Growth; Sioshansi, F.P., Ed.; Elsevier Science: Amsterdam, The Netherlands, 2013; pp. 305–324.
- Dunster, B. BedZED: Beddington zero-fossil energy development. In Sustainable Urban Design; Taylor & Francis: Abingdon, UK, 2013; pp. 157–174.
- Lovell, H. Discourse and innovation journeys: The case of low energy housing in the UK. Technol. Anal. Strateg. Manag. 2008, 20, 613–632.
- Chance, T. Towards sustainable residential communities; the Beddington Zero Energy Development (BedZED) and beyond. Environ. Urban. 2009, 21, 527–544.
- Voss, K.; Musall, E. Net Zero Energy Buildings: International Projects of Carbon Neutrality in Buildings; Detail: München, Germany, 2012; pp. 94–108.
- Fraker, H. The Hidden Potential of Sustainable Neighborhoods: Lessons from Low-Carbon Communities; Island Press: Washington, DC, USA, 2013.
- Coates, G.J. Sustainable urbanism: Creating resilient communities in the age of peak oil and climate destabilization. Environ. Policy Is Soc. Policy–Soc. Policy Is Environ. Policy 2013, 81–101.
- Eppinger, J. Towards the Sustainable City: Planning and Urban Development for the Year 2000 World Exposition in Hanover, Germany; Routledge: London, UK, 2003.
- Zhu, D.; Kung, M.; Zhou, L. Analysis of sustainable energy systems in ecovillages: A review of progress in BedZED and Masdar City. Low Carbon Econ. 2015, 6, 1.
- Hodge, J.; Haltrecht, J. BedZED Seven Years on: The Impact of the UK’s Best Known Eco-village and Its Residents. Wallington, London. 2010. Available online: https://storage.googleapis.com/www.bioregional.com/downloads/BedZED-7-years-on_Bioregional_Peabody_2009.pdf (accessed on 6 June 2021).
- Saheb, Y.; Shnapp, S.; Johnson, C. The Zero Energy concept: Making the whole greater than the sum of the parts to meet the Paris Climate Agreement’s objectives. Curr. Opin. Environ. Sustain. 2018, 30, 138–150.
- Hodge, J.; Haltrecht, J. BedZED Monitoring Report 2007; BioRegional: London, UK, 2009.
- Twinn, C. BedZED. Arup Journal 2003. pp. 10–16. Available online: https://www.researchgate.net/profile/Chris-Twinn/publication/281980973_BedZED/links/56d95fc508aee73df6cf5096/BedZED.pdf (accessed on 25 October 2021).
- Bioregional. BedZED—The UK’s First Major Zero-Carbon Community. Available online: https://www.bioregional.com/projects-and-services/case-studies/bedzed-the-uks-first-large-scale-eco-village (accessed on 23 September 2021).
- Schoon, N. The BedZED Story: The UK’s First Large-Scale, Mixed-Use Eco-Village; BioRegional: Wallington, UK, 2016.
- Lazarus, N. BedZED: Toolkit Part II: A Practical Guide to Producing Affordable Carbon Neutral Developments; BioRegional: Wallington, UK, 2003.
More
Information
Subjects:
Green & Sustainable Science & Technology
Contributors
MDPI registered users' name will be linked to their SciProfiles pages. To register with us, please refer to https://encyclopedia.pub/register
:
View Times:
1.7K
Revisions:
4 times
(View History)
Update Date:
12 Nov 2021
Table of Contents


Notice
You are not a member of the advisory board for this topic. If you want to update advisory board member profile, please contact office@encyclopedia.pub.
OK
Confirm
Only members of the Encyclopedia advisory board for this topic are allowed to note entries. Would you like to become an advisory board member of the Encyclopedia?
Yes
No
${ textCharacter }/${ maxCharacter }
Submit
Cancel
Back
Comments
${ item }
|
${ item.createdUser.fullName }
${ item.createdAt }
${ item.vote }
${ item.reply }
Delete
${ reply.createdUser.fullName }
${ reply.createdAt }
${ reply.vote }
Delete
There is no reply to this comment~
${ item.replyTextCharacter }/${ item.replyMaxCharacter }
Submit
Cancel
More
No more~
There is no comment~
${ textCharacter }/${ maxCharacter }
Submit
Cancel
${ selectedItem.replyTextCharacter }/${ selectedItem.replyMaxCharacter }
Submit
Cancel
Confirm
Are you sure to Delete?
Yes
No