Your browser does not fully support modern features. Please upgrade for a smoother experience.
Submitted Successfully!
 +1 credit
Thank you for your contribution! You can also upload a video entry or images related to this topic.
For video creation, please contact our Academic Video Service.
| Version | Summary | Created by | Modification | Content Size | Created at | Operation |
|---|---|---|---|---|---|---|
| 1 | Ryo Ishibashi | + 701 word(s) | 701 | 2021-10-29 07:44:23 |
Video Upload Options
We provide professional Academic Video Service to translate complex research into visually appealing presentations. Would you like to try it?
Cite
If you have any further questions, please contact Encyclopedia Editorial Office.
Ishibashi, R. Genome by Multidimensional Scaling. Encyclopedia. Available online: https://encyclopedia.pub/entry/15575 (accessed on 24 June 2026).
Ishibashi R. Genome by Multidimensional Scaling. Encyclopedia. Available at: https://encyclopedia.pub/entry/15575. Accessed June 24, 2026.
Ishibashi, Ryo. "Genome by Multidimensional Scaling" Encyclopedia, https://encyclopedia.pub/entry/15575 (accessed June 24, 2026).
Ishibashi, R. (2021, October 31). Genome by Multidimensional Scaling. In Encyclopedia. https://encyclopedia.pub/entry/15575
Ishibashi, Ryo. "Genome by Multidimensional Scaling." Encyclopedia. Web. 31 October, 2021.
Copy Citation
The positions of enhancers and promoters on genomic DNA remain poorly understood. Chromosomes cannot be observed during the cell division cycle because the genome forms a chromatin structure and spreads within the nucleus. However, high-throughput chromosome conformation capture (Hi-C) measures the physical interactions of genomes. In previous studies, DNA extrusion loops were directly derived from Hi-C heat maps. By using Multidimensional Scaling (MDS), we can easily locate enhancers and promoters more precisely.
multidimensional scaling
high-throughput chromosome conformation capture
enhancer
promoter
1. Introduction
For cells to utilize genetic information, many genes must be expressed in a coordinated manner. The accessibility of genomic information depends on how DNA is packed into the chromatin. Chromatin is the basis of various biological processes, including cell cycle regulation and, DNA replication, repair, and maintenance [1]. Euchromatin is a genome region consisting of DNA with a relatively loose structure. The open structure allows RNA polymerase and other proteins to access the genome for DNA transcription. Enhancers and promoters also approach the euchromatin region to form DNA loops. Gene expression is controlled by promoters near the gene and by gene regulatory sites named as enhancers that are distant from the gene. However, how promoters and enhancers interact with each other to regulate gene expression is not well understood. High-throughput chromosome conformation capture (Hi-C) can be used to analyze the 3D structure of a genome by detecting genomic regions that are spatially close to each other using next-generation sequencing [2]. This conventional method led to an approximation of the genome structure from the Hi-C heat map [3]. We demonstrated the potential of using this method for identifying enhancers and promoters by applying multi-dimensional scaling (MDS).
2. Hypothetical Chromosomes
Figure 1 shows a heat map of Hi-C data after arranging these data as shown in Equation 1 below.

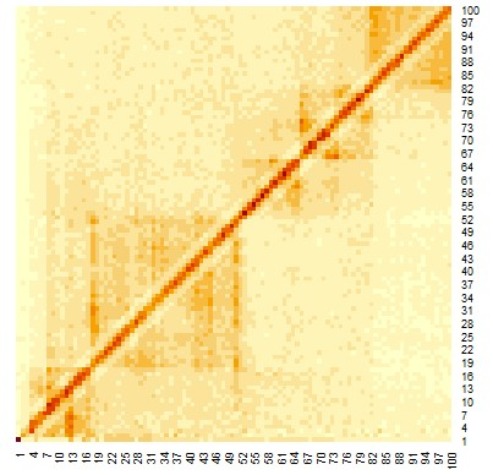
Figure 1. Heat map of Hi-C data after adding weighting.
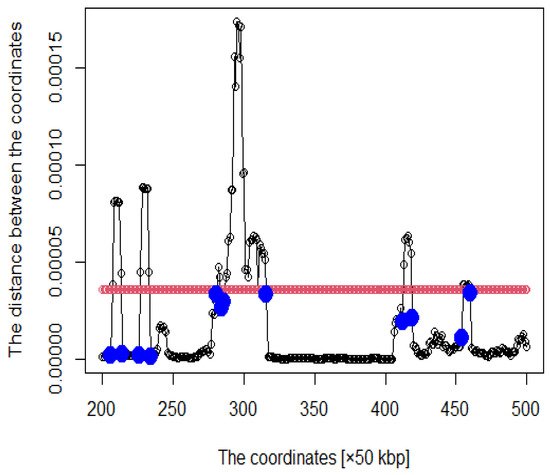
Figure 2. Distance plot between coordinates (The red line is the threshold and blue points are roots).
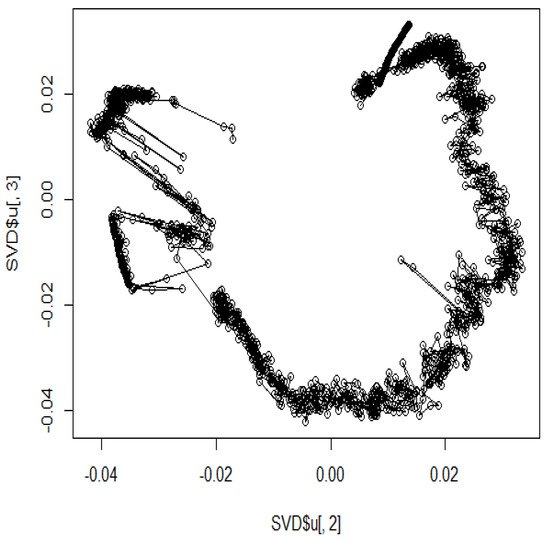
Figure 3. The hypothetical chromosomes 18 (0 bp–86,000 kbp).
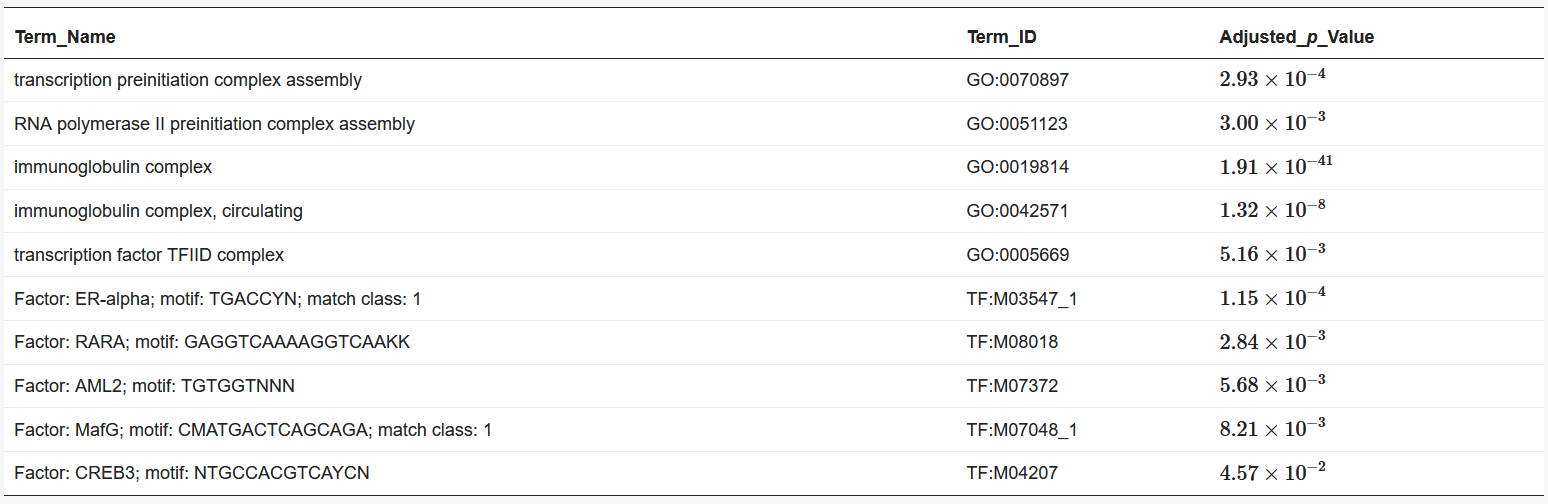
3. Enrichment Analysis
We used BiomaRt [4] in R to retrieve genes from the obtained coordinates. Finally, the obtained euchromatin regions were subjected to enrichment analysis using g: Profiler [5]. The results are presented in Table 1 and Table 2. The functions and processes involved in transcription were also determined such as the pre-transcriptional initiation complex and RNA polymerase II initiation complex, and transcription factors involved in cancer, such as CAMP responsive element binding protein 3 (CREB3) [6] and forkhead box M1 (FOXM1) [7].
Table 1. Results of enrichment analysis of 90 min Hi-C data by g:Profiler.
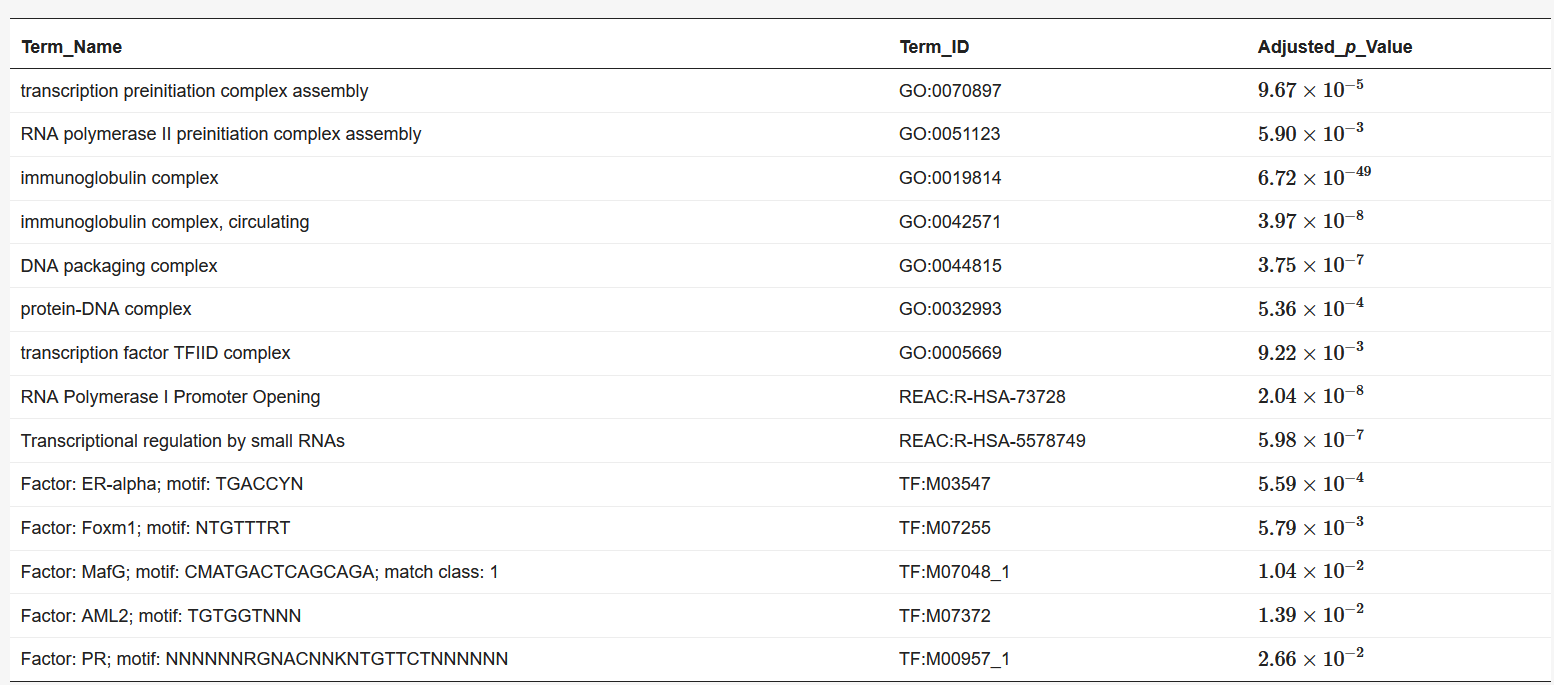
Table 2. Results of enrichment analysis of 120 min Hi-C data by g:Profiler.
4. Comparison with Previous Studies
In addition, several studies have used MDS to analyze Hi-C data for accurately reproducing 3D genome structures. The framework for predicting 3D genomic structures using t-distributed stochastic neighbor embedding (t-SNE) is named as StoHi-C [8]. MDS has inherent problems with very sparse high-dimensional Hi-C datasets, whereas tSNE overcomes these limitations. This method can reproduce the characteristics of chromosome 3D structures more clearly than MDS in yeast Hi-C data. The distances between the coordinates obtained from the 3D structure reproduced by the StoHi-C method are shown in Figure 4. As shown in Figure 4, attempts to precisely reproduce the 3D structure resulted in no significant difference in the distance between coordinates, even when acquiring DNA loops with a threshold value. Therefore, the enhancers and promoters cannot be precisely identified. We focused on the ones with a large number of Hi-C detections, although the distance between coordinates is large because the goal of this study was to identify enhancers and promoters. Therefore, we added weights as shown in Equation (1).
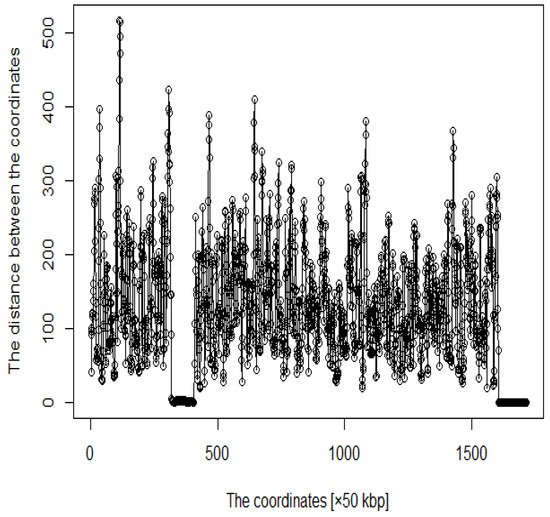
Figure 4. Distance plot between coordinates by StoHi-C.
Based on our results, it is useful to obtain DNA loops by automatically visualizing the chromosome structure using MDS, as performed in this study.
This cover illustration is Attribution 2.0 Generic (CC BY 2.0).
References
- Job Dekker; Leonid Mirny; The 3D Genome as Moderator of Chromosomal Communication. Cell 2016, 164, 1110-1121, 10.1016/j.cell.2016.02.007.
- Hyeseon Kang; Maxim N. Shokhirev; Zhichao Xu; Sahaana Chandran; Jesse R. Dixon; Martin W. Hetzer; Dynamic regulation of histone modifications and long-range chromosomal interactions during postmitotic transcriptional reactivation. Genes & Development 2020, 34, 913-930, 10.1101/gad.335794.119.
- Irene Mota-Gómez; Darío G. Lupiáñez; A (3D-Nuclear) Space Odyssey: Making Sense of Hi-C Maps.. Genes 2019, 10, 415, 10.3390/genes10060415.
- Steffen Durinck; Paul T Spellman; Ewan Birney; Wolfgang Huber; Mapping identifiers for the integration of genomic datasets with the R/Bioconductor package biomaRt. Nature Protocols 2009, 4, 1184-1191, 10.1038/nprot.2009.97.
- Uku Raudvere; Liis Kolberg; Ivan Kuzmin; Tambet Arak; Priit Adler; Hedi Peterson; Jaak Vilo; g:Profiler: a web server for functional enrichment analysis and conversions of gene lists (2019 update). Nucleic Acids Research 2019, 47, W191-W198, 10.1093/nar/gkz369.
- Yizheng Wu; Ziang Xie; Junxin Chen; Jiaxin Chen; Weiyu Ni; Yan Ma; Kangmao Huang; Gangliang Wang; Jiying Wang; Jianjun Ma; et al.Shuying ShenShunWu Fan Circular RNA circTADA2A promotes osteosarcoma progression and metastasis by sponging miR-203a-3p and regulating CREB3 expression. Molecular Cancer 2019, 18, 1-20, 10.1186/s12943-019-1007-1.
- Inken Wierstra; Jürgen Alves; FOXM1, a typical proliferation-associated transcription factor. Biological Chemistry 2007, 388, 1257-74, 10.1515/bc.2007.159.
- Mackay, K.; Kusalik, A. StoHi-C: Using t-distributed stochastic neighbor embedding (t-SNE) to predict 3D genome structure from Hi-C Data. bioRxiv 2020.
More
Information
Subjects:
Mathematical & Computational Biology
Contributor
MDPI registered users' name will be linked to their SciProfiles pages. To register with us, please refer to https://encyclopedia.pub/register
:
View Times:
963
Revision:
1 time
(View History)
Update Date:
31 Oct 2021
Table of Contents


Notice
You are not a member of the advisory board for this topic. If you want to update advisory board member profile, please contact office@encyclopedia.pub.
OK
Confirm
Only members of the Encyclopedia advisory board for this topic are allowed to note entries. Would you like to become an advisory board member of the Encyclopedia?
Yes
No
${ textCharacter }/${ maxCharacter }
Submit
Cancel
Back
Comments
${ item }
|
${ item.createdUser.fullName }
${ item.createdAt }
${ item.vote }
${ item.reply }
Delete
${ reply.createdUser.fullName }
${ reply.createdAt }
${ reply.vote }
Delete
There is no reply to this comment~
${ item.replyTextCharacter }/${ item.replyMaxCharacter }
Submit
Cancel
More
No more~
There is no comment~
${ textCharacter }/${ maxCharacter }
Submit
Cancel
${ selectedItem.replyTextCharacter }/${ selectedItem.replyMaxCharacter }
Submit
Cancel
Confirm
Are you sure to Delete?
Yes
No