 +1 credit
| Version | Summary | Created by | Modification | Content Size | Created at | Operation |
|---|---|---|---|---|---|---|
| 1 | Ho Sim | + 3403 word(s) | 3403 | 2021-10-26 06:11:39 | | | |
| 2 | Amina Yu | Meta information modification | 3403 | 2021-10-28 03:36:35 | | | | |
| 3 | Amina Yu | Meta information modification | 3403 | 2021-10-29 09:45:24 | | | | |
| 4 | Catherine Yang | Meta information modification | 3403 | 2021-11-11 03:05:21 | | |
Video Upload Options
The Illite-Age-Analysis (IAA) method was first proposed by Pevear (1992, 1999)for the catalytic dating of sedimentary basins. After van der Pluijm et al. (2001) discovered a new application for defining the age of fault-thrust development with the IAA method, it has been applied to the shallow faults of various tectonic environments by a number of researchers for the past 20 years, and has played a decisive role in the study of tectonic evolution and understanding of seismic phenomena. In particular, the development of the WILDFIRE© program by Reynolds (1994)has made great strides in the quantitative analysis of illite polytype by simulating the 1M/1Mdpolytype patterns.
1. Introduction
The Illite-Age-Analysis (IAA) method was first proposed by Pevear (1992, 1999) [1][2] for the catalytic dating of sedimentary basins. After van der Pluijm et al. (2001) discovered a new application for defining the age of fault-thrust development with the IAA method [3], it has been applied to the shallow faults of various tectonic environments by a number of researchers for the past 20 years, and has played a decisive role in the study of tectonic evolution and understanding of seismic phenomena. In particular, the development of the WILDFIRE© program by Reynolds (1994) [4] has made great strides in the quantitative analysis of illite polytype by simulating the 1M/1M d polytype patterns. Moreover, the incorporation of micro-encapsulation in the 40Ar- 39Ar method [3] and the improvement of the K-Ar method with a small amount of sample have greatly enhanced the reliability of the IAA method.
The relative content of illite polytype is a key variable that determines the reliability of the IAA method. Most researchers have applied X-ray diffraction (XRD) analysis and the illite quantification method based on the WILDFIRE© program, but there are some differences in the XRD analysis conditions and the method of using the simulated pattern generated by WILDFIRE©. For example, since the XRD pattern of illite has a layer structure, the relative intensity of peaks may be distorted due to the preferred orientation of the particles. However, the back-/side-packing method applied in most studies to minimize this effect is difficult to consistently guarantee the state of the analyzed sample for each researcher, so it may become an error factor in the quantitative analysis value. This will be discussed further in Section 4 . As another example, in the WILDFIRE©-based quantitative analysis method used in most IAA studies, there is a difference depending on the researcher in the method of using the simulated XRD pattern. This will be discussed further in Section 5 .
Furthermore, there may be some error factors in the process of determining the absolute age of each particle size. Both the radiometric K-Ar or Ar-Ar methods have advantages and disadvantages, and this problem is still debated. This will be discussed further in Section 6 . In addition, the state of each fraction, such as the presence of K-containing minerals other than illite, and the presence of K + in the exchangeable site of layer silicates, can also be an important factor that can affect the dating results.
Although there are fault activity dating methods such as U-Pb dating and Rb-Sr dating for carbonate minerals, the IAA method, which has a wider application range, is still a highly useful method for determining the absolute age of a shallow fault activity. Therefore, in order to obtain reasonable and consistent dating results by applying it, a systematic process should be established in consideration of the aforementioned influencing factors (i.e., mineralogy of sample, error factors in the particle size separation process, preferred orientation of the sample, polytype quantification method, selection of dating method, etc.). In this paper, we summarize the studies on fault dating using the IAA method, and review the differences in the applied quantification method in detail and their results. Based on this, we would like to suggest a direction for improvement and a systematic IAA application procedure to minimize the error and error range of the IAA chronology and to obtain reliable results.
2. Basic Concept of IAA and Previous Studies
Fault gouges, a product of fault activity, generally appear as a mixture of 1M/1M d illite generated due to fault activity and detrital 2M 1 illite derived from surrounding rocks [3]. This is a factor that makes it difficult to determine the age of fault activity using fault gouges. IAA is a method proposed to solve this problem, and to determine the generation age of only 1M/1M d illite generated by fault activity. The basic concept of IAA is to obtain the y -axis intercept of 0% detrital 2M 1 illite from linear extrapolation through a graphical plot of the dating data ( y -axis) of three or more size fractions separated from one fault gouge, versus the relative content of 2M 1 illite of each fraction ( x -axis) in the binary system between 1M/1M d − 2M 1 illite.
Ar(d): Radiogenic argon content of detrital mica Argon content.
Therefore, the accuracy and precision of the IAA method depend on (1) how to reasonably quantify the relative content of 1M/1M d illite generated from fault activity compared to detrital 2M 1 illite in the size fractions of the fault gouge, and (2) how to minimize the error factors in K-Ar or Ar-Ar radiometric dating analysis. In the 20 years since it was first applied to shallow faults by van der Pluijm et al. (2001) [3], many fault-dating studies have been conducted. Table 1 lists previous studies using IAA and the respective experimental and methodological setup, including selected size fractions, XRD conditions (type of equipment, aluminum holder/capillary tube, detector type, etc.), illite polytype quantification method, and dating method for each study result.
In most studies, <2 μm particle size was separated into 3 to 4 particle size fractions [3][5][6][7][8][9][10][11][12][13][14][15][16][17][18][19][20][21][22][23][24][25][26][27], but in some studies, >2 μm fraction was also separated [28][29][30][31][32]. The particle size range for each fraction is slightly different depending on the research ( Table 1 ). The XRD equipment used in most studies is the conventional powder diffractometry, and it seems to have been loaded by back/side-packing the powder sample in an aluminum holder and measured [3][5][6][7][8][9][10][11][12][17][18][21][25][27][28][29][31]. Contrary to this, some studies used capillary tubes as sample holders to minimize the preferred orientation effect of grains [13][14][15][16][19][20][22][23][24][26][30][32]. Illite polytype quantification is the most important factor in determining the reliability of IAA results, but there are differences among researchers in the experimental set-ups of quantitative analysis. Therefore, each experimental set-up applied in the IAA process will be discussed in more detail below. Several methods have been proposed so far, and most are based on simulated XRD patterns generated with WILDFIRE© [3][5][6][7][8][9][10][11][12][13][14][15][16][17][18][19][20][21][22][23][25][26][27][30][31][32]. Both K-Ar and Ar-Ar methods were used as radiometric dating methods ( Table 1 ).
| No. | Fault Name | Size Fractions (µm) | XRD Equipment with Sample Holder | Illute Polytype Quantification | Radiometric Dating | Year | Ref. No |
|---|---|---|---|---|---|---|---|
| 1 | Lewis thrust | <0.02, 0.02–0.2, 0.2–2 | Conventional | Grathoff and Moore (1996) method using WILDFIRE | 40Ar/39Ar | 2001 | 3 |
| 2 | Moab Fault, Utah | <0.05, 0.05–0.5, 0.5–2 | Conventional | Grathoff and Moore (1996) method using WILDFIRE | 40Ar/39Ar | 2005 | 5 |
| 3 | Faults in Canadian Rocky Mountains | <0.02, 0.02–0.2, 0.2–2 | Conventional | Grathoff and Moore (1996) method using WILDFIRE | 40Ar/39Ar | 2006 | 6 |
| 4 | Anatolian Fault | <0.2, 0.2–0.5, 0.5–1, 1–2, >2 | Conventional | Grathoff and Moore (1996) method using WILDFIRE | K-Ar | 2006 | 7 |
| 5 | Sierra Mazatan detachment fault | <0.05, 0.05–0.1, 0.1–0.5, 0.5–1, 1–2 | Conventional | Lowest-variance approach using WILDFIRE | 40Ar/39Ar | 2008 | 8 |
| 6 | Fault of the Ruby Mountains | <0.05, 0.05–0.4, 0.4–2 | Conventional | Lowest-variance approach using WILDFIRE | 40Ar/39Ar | 2009 | 9 |
| 7 | San Andreas fault, Parkfield, Califonia | <0.02, 0.02–0.2, 0.2–2 | Conventional | Lowest-variance approach using WILDFIRE | 40Ar/39Ar | 2010 | 10 |
| 8 | Faults in AlpTransit deep tunnel site | <0.1, 0.1–0.4, 0.4–2, 2–6, 6–10 | Conventional | SIROQUANT from Sietronics Pty Ltd. | K-Ar | 2010 | 28 |
| 9 | West Qinling fault | <0.05, 0.05–0.2, 0.2–2 | Conventional | Lowest-variance approach using WILDFIRE | 40Ar/39Ar | 2011 | 11 |
| 10 | Pyrenean thrusts | <0.05, 0.05–0.4, 0.4–2 | Conventional | Lowest-variance approach using WILDFIRE | 40Ar/39Ar | 2011 | 12 |
| 11 | Deokpori Thrust | <0.1, 0.1–0.4, 0.4–2, 2–6, 6–10 | Conventional | not mentioned in detail | K-Ar | 2011 | 29 |
| 12 | Chugaryeong fault zone, Korea | <0.1, 0.1–0.4, 0.4–1, 1–2 | Micro-focused with capillary, 2D detector | Iterative full-pattern-fitting with the WILDFIRE | K-Ar | 2014 | 13 |
| 13 | Daegwangri fault, Korea | <0.1, 0.1–0.4, 0.4–1, 1–2 | Micro-focused with capillary, 2D detector | Iterative full-pattern-fitting with the WILDFIRE | K-Ar | 2014 | 14 |
| 14 | Inje fault, Korea | <0.1, 0.1–0.4, 0.4–1, 1–2 | Micro-focused with capillary, 2D detector | Iterative full-pattern-fitting with the WILDFIRE | K-Ar | 2015 | 15 |
| 15 | Red River Fault, Vietnam | <0.1, 0.1–0.4, 0.4–1, 1–2 | Micro-focused with capillary, 2D detector | Iterative full-pattern-fitting with the WILDFIRE | K-Ar | 2016 | 16 |
| 16 | Mexican Fold-Thrust Belt | <0.05, 0.05–0.2, 0.2–1, 1–2 | Conventional | Lowest-variance approach using WILDFIRE | 40Ar/39Ar | 2016 | 17 |
| 17 | Faults in Death Valley and Panamint Valley | <0.05, 0.05–0.2, 0.2–2 | Conventional | Lowest-variance approach using WILDFIRE | 40Ar/39Ar | 2016 | 18 |
| 18 | Yangsan Fault in the Sangcheon-ri, Korea | <0.1, 0.1–0.4, 0.4–1, 1–2 | Micro-focused with capillary, 2D detector | Iterative full-pattern-fitting with the WILDFIRE | K-Ar | 2016 | 19 |
| 19 | Minami-Awa Fault | <0.2, 0.2–0.5, 0.5–1, 1–2, 2–4 | X’Pert Pro Multi-purpose with capillary | Iterative full-pattern-fitting with the WILDFIRE | K-Ar | 2016 | 30 |
| 20 | Dien Bien Phu Fault, Vietnam | <0.1, 0.1–0.4, 0.4–1, 1–2 | Micro-focused with capillary, 2D detector | Iterative full-pattern-fitting with the WILDFIRE | K-Ar | 2017 | 20 |
| 21 | Alpine Fault, New Zealand | <0.1, 0.1–0.2, 0.2–0.5, 0.5–1 | Conventional | Grathoff and Moore (1996) method using WILDFIRE | 40Ar/39Ar | 2017 | 21 |
| 22 | Yangsan Fault in the Pohang Area, Korea | <0.1, 0.1–0.4, 0.4–1, 1–2 | Micro-focused with capillary, 2D detector | Iterative full-pattern-fitting with the WILDFIRE | K-Ar | 2017 | 22 |
| 23 | Faults in Yeongwol are, Korea | <0.1, 0.1–0.4, 0.4–1, 1–2 | Micro-focused with capillary, 2D detector | Iterative full-pattern-fitting with the WILDFIRE | K-Ar | 2018 | 23 |
| 24 | Río Grío, Vallès-Penedès Faults | <0.1, 0.1–0.4, 0.4–2, 2–6, 6–10 | Conventional | Integrated peak areas, using calibration constant for standard | 40Ar/39Ar | 2019 | 31 |
| 25 | Faults within Shimanto accretionary complex | <0.2, 0.2–0.5, 0.5–1, 1–2, 2–4 | X’Pert Pro Multi-purpose with capillary | Iterative full-pattern-fitting with the WILDFIRE | K-Ar | 2019 | 32 |
| 26 | Sronlairig Fault | <0.05, 0.05–0.1, 0.1–0.2, 0.2–2 | X’Pert Pro Multi-purpose with capillary | corrected peak-area-measurement, Dalla Torre et al. (1994) | K-Ar | 2019 | 24 |
| 27 | Sevier fold–thrust | <0.05, 0.05–0.1, 0.1–0.5, 0.5–1, 1–2 | Conventional | Lowest-variance approach using WILDFIRE | 40Ar/39Ar | 2019 | 25 |
| 28 | Faults in Chungnam Basin, Korea | <0.1, 0.1–0.4, 0.4–1, 1–2 | Micro-focused with capillary, 2D detector | Iterative full-pattern-fitting with the WILDFIRE | K-Ar | 2019 | 26 |
| 29 | Faults in West Sarawak, Borneo | <0.2–0.5, 0.5–1, 1–2 | Conventional | Iterative full-pattern-fitting with the WILDFIRE | K-Ar | 2021 | 27 |
3. X-ray Diffractometry Procedure for IAA
The key to XRD analysis of size fractions is how to obtain all ( hkl ) reflections of the illite polytype with an ideal peak-intensity ratio. This indicates that XRD analysis should be performed by minimizing the inevitable preferred orientation effect in the layer crystal structure. Therefore, samples for XRD analysis should be loaded as randomly as possible.
The back-/side-packing method using the aluminum holder increases randomness rather than the simple top-packing method. However, because of the difference in the amount of sample per unit volume used and the packing strength for each case, there is an inevitable difference in the degree of randomness for each case.
On the other hand, the capillary tube can maximize randomness and reduce the difference between researchers. In addition, the capillary tube can be analyzed with only a small amount of sample, so it is more useful for fine-size fractions where it is difficult to secure a sufficient amount of sample.
Although the type of XRD equipment is less important, micro-focused XRD equipment with a 2D-detector (image plate) can obtain an XRD pattern with good peak-selectivity, targeting a microscopic area of a thin capillary tube even with an extremely small amount of sample. Therefore, the micro-focused XRD equipment is optimized for XRD analysis for IAA, and the accuracy and precision of illite polytype quantification results can be enhanced. Indeed, Song et al. (2014) [14] successfully obtained high-resolution ( hkl ) reflections in a random state for the first time using micro-focused XRD equipment with a 2D-image plate attached to an extremely small amount of sample loaded into a thin capillary tube (0.6 mm in diameter). This method has been applied recently in several studies [13][14][15][16][20][22][23][26].
4. IAA (Illite-Age-Analysis) for Fault Dating
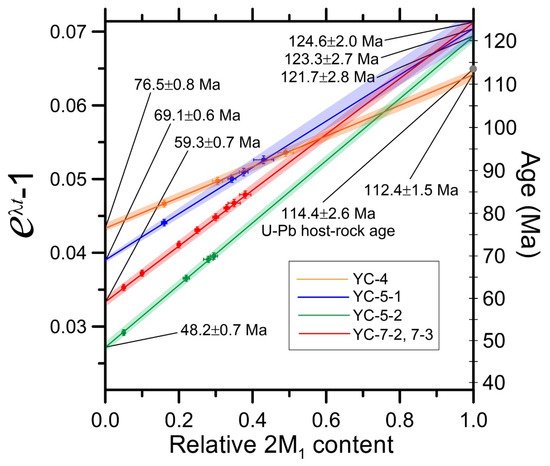
In the IAA (Illite-Age-Analysis) method, the first step is to graphically plot the dating data ( y -axis) of three or more size fractions versus the relative content of 2M 1 illite in each fraction ( x -axis). From the simple linear extrapolation of the plots, the y-intercept value with a detrital 2M 1 illite content of 0% is calculated. This y-intercept value is the generation age of 1M/1M d illite, that is, the fault activity age. Here, as the y -axis data, the value of exp(λt) − 1, which is a linear relationship with the radiogenic 40Ar/K ratio, rather than the age value, should be plotted against the relative content of 2M 1 illite in each size fraction [1][2][3][5][6][7][8][9][10][11][12][13][14][15][16][17][18][19][20][21][22][23][24][25][26][27][28][29][30][31][32].
The error of the fault dating result can be calculated from the value indicating the degree of fitting between the simulated pattern and the measured pattern in the polytype quantitative analysis process. The J value of Ylagan et al. (2002) [33] and the R % value of Song et al. (2014) [14] are values showing the degree of full-pattern-fitting. Song et al. (2014) [14] treated the R % value as the error range of the quantitative value determined for each fraction, and calculated the y-intercept value determined through its extrapolation as the error range of the 1M d illite generation age. In Figure 1 , the IAA plot published in Song et al. (2014) [14] are presented as an example.
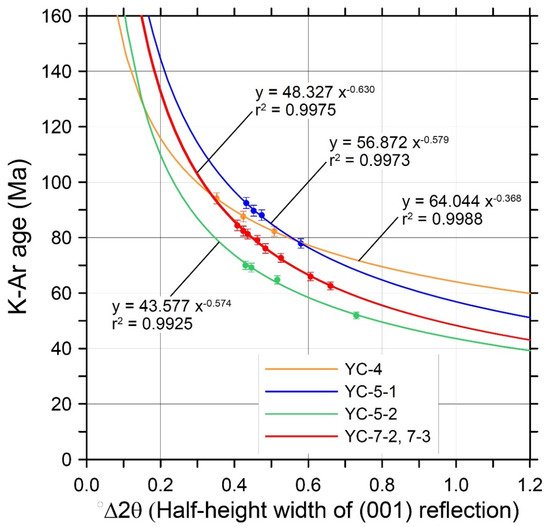
In addition, it is possible to confirm the reliability of the fault dating value by plotting the apparent K–Ar age value of each fraction against the illite crystallinity index (or Kübler index, defined as the half-height width (°∆2θ) of the illite (001) reflection of about 10 Å) [34], and by whether it is fitted with hyperbolic curves of negative correlations. In Figure 2 , the K-Ar age value versus illite crystallinity index of each fraction published in Song et al. (2014) [14] are presented as examples.
- Pevear, R. Illite age analysis, a new tool for basin thermal history analysis. In Water-Rock Interaction; Kharaka, Y.K., Maest, A.S., Eds.; Balkema: Rotterdam, The Netherlands, 1992; pp. 1251–1254.
- Pevear, R. Illite and hydrocarbon exploration. Proc. Natl. Acad. Sci. USA 1999, 96, 3440–3446.
- van der Pluijm, A.; Hall, C.M.; Vrolijk, P.J.; Pevear, D.R.; Covey, M.C. The dating of shallow faults in the Earth’s crust. Nature 2001, 412, 172–175.
- Reynolds, C., Jr. WILDFIRE: A Computer Program for the Calculation of Three-Dimensional X-Ray Diffraction Patterns of Mica Polytypes and Their Disordered Variation; Jr, 8 Brook Rd, Hanover, NH, USA, 1994.
- Solum, G.; van der Pluijm, B.A.; Peacor, D.R. Neocrystallization, fabrics and age of clay minerals from an exposure of the Moab Fault, Utah. J. Struct. Geol. 2005, 27, 1563–1576.
- van der Pluijm, A.; Vrolijk, P.J.; Pevear, D.R.; Hall, C.M.; Solum, J.G. Fault dating in the Canadian Rocky Mountains; Evidence for late Cretaceous and early Eocene orogenic pulse. Geology 2006, 34, 837–840.
- Uysal, T.; Mutlu, H.; Altunel, E.; Karabacak, V.; Golding, S.D. Clay mineralogical and isotopic (K–Ar, δ18O, δD) constraints on the evolution of the North Anatolian Fault Zone, Turkey. Earth Planet. Sci. Lett. 2006, 243, 181–194.
- Haines, H.; van der Pluijm, B.A. Clay quantification and Ar-Ar dating of synthetic and natural gouge: Application to the Miocene Sierra Mazatan detachment fault, Sonora, Mexico. J. Struct. Geol. 2008, 30, 525–538.
- Haines, H.; van der Pluijm, B.A. Dating the detachment fault system of the Ruby Mountains, Nevada: Significance for the kinematics of low‐angle normal faults. Tectonics 2010, 29, TC4028, doi:10.1029/2009TC002552.
- Schleicher, M.; van der Pluijm, B.A.; Warr, L.N. Nanocoatings of clay and creep of the San Andreas fault at Perkfield, California. Geology 2010, 38, 667–670.
- Duvall, R.; Clark, M.K.; van der Pluijm, B.A.; Li, C. Direct dating of Eocene reverse faulting in northeastern Tibet using Ar-dating of fault clays and low-temperature thermochronometry. Earth Planet. Sci. Lett. 2011, 304, 520–526.
- Rahl, M.; Haines, S.H.; van der Pluijm, B.A. Links between orogenic wedge deformation and erosional exhumation: Evidence from illite age analysis of fault rock and detrital thermochronology of syn-tectonic conglomerates in the Spanish Pyrenees. Earth Planet. Sci. Lett. 2011, 307, 180–190.
- Chung, ; Song, Y.; Park, C.-Y.; Kang, I.-M.; Choi, S.-J.; Khulganakhuu, C. Reactivated Timings of Some Major Faults in the Chugaryeong Fault Zone since the Cretaceous Period. Econ. Environ. Geol. 2014, 47, 29–38. (In Korean with English abstract)
- Song, ; Chung, D.; Choi, S.-J.; Kang, I.-M.; Park, C.; Itaya, T.; Yi, K. K-Ar illite dating to constrain multiple events in shallow crustal rocks: Implications for the Late Phanerozoic evolution of NE Asia. J. Asian Earth Sci. 2014, 95, 313–322.
- Khulganakhuu, ; Song, Y.; Chung, D.; Park, C.; Choi, S.-J.; Kang, I.-M.; Yi, K. Reactivated Timings of Inje Fault since the Mesozoic Era. Econ. Environ. Geol. 2015, 48, 41–49. (In Korean with English abstract)
- Bui, B.; Ngo, X.T.; Song, Y.; Itaya, T.; Yagi, K.; Khuong, T.H.; Nguyen, T.D. K-Ar Dating of Fault Gouges from the Red River Fault Zone of Vietnam. Acta Geol. Sin. (Engl. Ed.) 2016, 90, 1801–1811.
- Fitz-Dıaz, ; Hall, C.M.; van der Pluijm, B.A. XRD-based 40Ar/39Ar age correction for fine-grained illite, with application to folded carbonates in the Monterrey Salient (northern Mexico). Geochim. Cosmochim. Acta 2016, 181, 201–216.
- Haines, ; Lynch, E.; Mulch, A.; Valley, J.W.; van der Pluijm, B.A. Meteoric fluid infiltration in crustal-scale normal fault systems as indicated by d18O and d2H geochemistry and 40Ar/39Ar dating of neoformed clays in brittle fault rocks. Lithosphere 2016, 8, 587–600.
- Song, ; Park, C.; Sim, H.; Choi, W.; Son, M.; Khulganakhuu, C. Reactivated Timings of Yangsan Fault in the Sangcheon-ri Area, Korea. Econ. Environ. Geol. 2016, 49, 97–104. (In Korean with English abstract)
- Bui, B.; Ngo, X.T.; Khuing, T.H.; Golonka, J.; Nguyen, T.D.; Song, Y.; Itaya, T.; Yagi, K. Episodes of brittle deformation within the Dien Bien Phu Fault zone, Vietnam: Evidence from K-Ar age dating of authigenic illite. Tectonophysics 2017, 695, 53–63.
- Ring, ; Uysal, I.T.; Glodny, J.; Cox, S.C.; Little, T.; Thomson, S.N.; Stübner, K.; Bozkaya, Ö. Fault-gouge dating in the Southern Alps, New Zealand. Tectonophysics 2017, 717, 321–338.
- Sim, ; Song, Y.; Son, M.; Park, C.; Choi, W.; Khulganakhuu, C. Reactivated Timings of Yangsan Fault in the Northern Pohang Area, Korea. Econ. Environ. Geol. 2017, 50, 97–104. (In Korean with English abstract)
- Jang, ; Kwon, S.; Song, Y.; Kim, S.W.; Kwon, Y.K.; Yi, K. Phanerozoic polyphase orogenies recorded in the northeastern Okcheon Belt, Korea from SHRIMP U-Pb detrital zircon and K-Ar illite geochronologies. J. Asian Earth Sci. 2018, 157, 198–217.
- Kemp, J.; Gillespie, M.R.; Leslie, G.A.; Zwingmann, H.; Campbell, S.D.G. Clay mineral dating of displacement on the Sronlairig Fault: Implications for Mesozoic and Cenozoic tectonic evolution in northern Scotland. Clay Miner. 2019, 54, 181–196.
- Lynch, A.; Mulch, A.; Yonkee, A.; van der Pluijm, B.A. Surface fluids in the evolving Sevier fold–thrust belt of ID–WY indicated by hydrogen isotopes in dated, authigenic clay minerals. Earth Planet. Sci. Lett. 2019, 513, 29–39.
- Park, -I.; Noh, J.; Cheong, H.J.; Kwon, S.; Song, Y.; Inversion of two-phase extensional basin systems during subduction of the Paleo-Pacific Plate in the SW Korean Peninsula: Implication for the Mesozoic “Laramide-style” orogeny along East Asian continental margin. Geosci. Front. 2019, 10, 909–925.
- Zhao, ; Yan, Y.; Tonai, S.; Tomioka, N.; Clift, P.D.; Hassan, M.H.A.; Aziz, J.H.B.A. A new K-Ar illite dating application to constrain the timing of subduction in West Sarawak, Borneo. GSA Bull. 2021, doi:10.1130/B35895.1.
- Zwingmann, ; Mancktelow, N.; Antognini, M.; Lucchini, R. Dating of shallow faults: New constraints from the AlpTransit tunnel site (Switzerland). Geology 2010, 38, 487–490.
- Zwingmann, ; Han, R.; Ree, J.-H. Cretaceous reactivation of the Deokpori Thrust, Taebaeksan Basin, South Korea, constrained by K‐Ar dating of clayey fault gouge. Tectonics 2011, 30, TC5015, doi:10.1029/2010TC002829.
- Tonai, ; Ito, S.; Hashimoto, Y.; Tamura, H.; Tomioka, N. Complete 40Ar resetting in an ultracataclasite by reactivation of a fossil seismogenic fault along the subducting plate interface in the Mugi Melange of the Shimanto accretionary complex, southwest Japan. J. Struct. Geol. 2016, 89, 19–29.
- Aledga, ; Viola, G.; Casas-Sainz, A.; Marcén, M.; Román-Berdiel, T.; van der Lelij, R. Unraveling multiple thermotectonic events accommodated by crustal‐scale faults in northern Iberia, Spain: Insights from K‐Ar dating of clay gouges. Tectonics 2019, 38, 3629–3651.
- Fisher, M.; Tonai, S.; Hashimoto, Y.; Tomioka, N.; Oakley, D. K-Ar dating of fossil seismogenic thrusts in the Shimanto Accretionary Complex, Southwest Japan. Tectonics 2019, 38, 3866–3880.
- Grathoff, ; Moore, D. Illite polytype quantification using WILDFIRE© calculated X-ray diffraction pat terns. Clays Clay Miner. 2016, 44, 835–842.
- Ylagan, F.; Kim, C.S.; Pevear, D.R.; Vrolijk, P.J. Illite polytype quantification for accurate K-Ar age determination. Am. Mineral. 2002, 87, 1536–1545.
- Boles, ; Schleicher, A.M.; Solum, J.; van der Pluijm, B. Quantitative X-ray powder diffraction and the illite polytype analysis method for direct fault rock dating: A comparison of analytical techniques. Clays Clay Miner. 2018, 66, 220–232.
- Chung, ; Song, Y.; Kang, I.-M.; Park, C.-Y. Optimization of illite polytype quantification method. Econ. Environ. Geol. 2013, 46, 1–9 (In Korean with English abstract)
- Clauer, ; Zwingmann, H.; Liewig, N.; Wendling, R. Comparative 40Ar–39Ar and K–Ar dating of illite-type clay minerals: A tentative explanation for age identities and differences. Earth-Sci. Rev. 2012, 115, 76–96.
- Kübler, Les indicateurs des transformations physiques etchimiquesdans la diagènese, température et calorimétrie. In Thermométrie et Barométriegéologiques; Lagache, M., Ed.; French Society of Mineralogy and Crystallography: Paris, France, 1084; pp. 489–596.
References
- Pevear, D.R. Illite age analysis, a new tool for basin thermal history analysis. In Water-Rock Interaction; Kharaka, Y.K., Maest, A.S., Eds.; Balkema: Rotterdam, The Netherlands, 1992; pp. 1251–1254.
- Pevear, D.R. Illite and hydrocarbon exploration. Proc. Natl. Acad. Sci. USA 1999, 96, 3440–3446.
- Van der Pluijm, B.A.; Hall, C.M.; Vrolijk, P.J.; Pevear, D.R.; Covey, M.C. The dating of shallow faults in the Earth’s crust. Nature 2001, 412, 172–175.
- Reynolds, R.C., Jr. WILDFIRE: A Computer Program for the Calculation of Three-Dimensional X-ray Diffraction Patterns of Mica Polytypes and Their Disordered Variation; Wildfire©: Hanover, NH, USA, 1994.
- Solum, J.G.; van der Pluijm, B.A.; Peacor, D.R. Neocrystallization, fabrics and age of clay minerals from an exposure of the Moab Fault, Utah. J. Struct. Geol. 2005, 27, 1563–1576.
- Van der Pluijm, B.A.; Vrolijk, P.J.; Pevear, D.R.; Hall, C.M.; Solum, J.G. Fault dating in the Canadian Rocky Mountains; Evidence for late Cretaceous and early Eocene orogenic pulse. Geology 2006, 34, 837–840.
- Uysal, I.T.; Mutlu, H.; Altunel, E.; Karabacak, V.; Golding, S.D. Clay mineralogical and isotopic (K–Ar, δ18O, δD) constraints on the evolution of the North Anatolian Fault Zone, Turkey. Earth Planet. Sci. Lett. 2006, 243, 181–194.
- Haines, S.H.; van der Pluijm, B.A. Clay quantification and Ar-Ar dating of synthetic and natural gouge: Application to the Miocene Sierra Mazatan detachment fault, Sonora, Mexico. J. Struct. Geol. 2008, 30, 525–538.
- Haines, S.H.; van der Pluijm, B.A. Dating the detachment fault system of the Ruby Mountains, Nevada: Significance for the kinematics of low-angle normal faults. Tectonics 2010, 29, TC4028.
- Schleicher, A.M.; van der Pluijm, B.A.; Warr, L.N. Nanocoatings of clay and creep of the San Andreas fault at Perkfield, California. Geology 2010, 38, 667–670.
- Duvall, A.R.; Clark, M.K.; van der Pluijm, B.A.; Li, C. Direct dating of Eocene reverse faulting in northeastern Tibet using Ar-dating of fault clays and low-temperature thermochronometry. Earth Planet. Sci. Lett. 2011, 304, 520–526.
- Rahl, J.M.; Haines, S.H.; van der Pluijm, B.A. Links between orogenic wedge deformation and erosional exhumation: Evidence from illite age analysis of fault rock and detrital thermochronology of syn-tectonic conglomerates in the Spanish Pyrenees. Earth Planet. Sci. Lett. 2011, 307, 180–190.
- Chung, D.; Song, Y.; Park, C.-Y.; Kang, I.-M.; Choi, S.-J.; Khulganakhuu, C. Reactivated Timings of Some Major Faults in the Chugaryeong Fault Zone since the Cretaceous Period. Econ. Environ. Geol. 2014, 47, 29–38, (In Korean with English Abstract).
- Song, Y.; Chung, D.; Choi, S.-J.; Kang, I.-M.; Park, C.; Itaya, T.; Yi, K. K-Ar illite dating to constrain multiple events in shallow crustal rocks: Implications for the Late Phanerozoic evolution of NE Asia. J. Asian Earth Sci. 2014, 95, 313–322.
- Khulganakhuu, C.; Song, Y.; Chung, D.; Park, C.; Choi, S.-J.; Kang, I.-M.; Yi, K. Reactivated Timings of Inje Fault since the Mesozoic Era. Econ. Environ. Geol. 2015, 48, 41–49, (In Korean with English Abstract).
- Bui, H.B.; Ngo, X.T.; Song, Y.; Itaya, T.; Yagi, K.; Khuong, T.H.; Nguyen, T.D. K-Ar Dating of Fault Gouges from the Red River Fault Zone of Vietnam. Acta Geol. Sin. (Engl. Ed.) 2016, 90, 1801–1811.
- Fitz-Dıaz, E.; Hall, C.M.; van der Pluijm, B.A. XRD-based 40Ar/39Ar age correction for fine-grained illite, with application to folded carbonates in the Monterrey Salient (northern Mexico). Geochim. Cosmochim. Acta 2016, 181, 201–216.
- Haines, S.; Lynch, E.; Mulch, A.; Valley, J.W.; van der Pluijm, B.A. Meteoric fluid infiltration in crustal-scale normal fault systems as indicated by d18O and d2H geochemistry and 40Ar/39Ar dating of neoformed clays in brittle fault rocks. Lithosphere 2016, 8, 587–600.
- Song, Y.; Park, C.; Sim, H.; Choi, W.; Son, M.; Khulganakhuu, C. Reactivated Timings of Yangsan Fault in the Sangcheon-ri Area, Korea. Econ. Environ. Geol. 2016, 49, 97–104, (In Korean with English Abstract).
- Bui, H.B.; Ngo, X.T.; Khuing, T.H.; Golonka, J.; Nguyen, T.D.; Song, Y.; Itaya, T.; Yagi, K. Episodes of brittle deformation within the Dien Bien Phu Fault zone, Vietnam: Evidence from K-Ar age dating of authigenic illite. Tectonophysics 2017, 695, 53–63.
- Ring, U.; Uysal, I.T.; Glodny, J.; Cox, S.C.; Little, T.; Thomson, S.N.; Stübner, K.; Bozkaya, Ö. Fault-gouge dating in the Southern Alps, New Zealand. Tectonophysics 2017, 717, 321–338.
- Sim, H.; Song, Y.; Son, M.; Park, C.; Choi, W.; Khulganakhuu, C. Reactivated Timings of Yangsan Fault in the Northern Pohang Area, Korea. Econ. Environ. Geol. 2017, 50, 97–104, (In Korean with English Abstract).
- Jang, Y.; Kwon, S.; Song, Y.; Kim, S.W.; Kwon, Y.K.; Yi, K. Phanerozoic polyphase orogenies recorded in the northeastern Okcheon Belt, Korea from SHRIMP U-Pb detrital zircon and K-Ar illite geochronologies. J. Asian Earth Sci. 2018, 157, 198–217.
- Kemp, S.J.; Gillespie, M.R.; Leslie, G.A.; Zwingmann, H.; Campbell, S.D.G. Clay mineral dating of displacement on the Sronlairig Fault: Implications for Mesozoic and Cenozoic tectonic evolution in northern Scotland. Clay Miner. 2019, 54, 181–196.
- Lynch, E.A.; Mulch, A.; Yonkee, A.; van der Pluijm, B.A. Surface fluids in the evolving Sevier fold–thrust belt of ID–WY indicated by hydrogen isotopes in dated, authigenic clay minerals. Earth Planet. Sci. Lett. 2019, 513, 29–39.
- Park, S.-I.; Noh, J.; Cheong, H.J.; Kwon, S.; Song, Y.; Kim, S.W.; Santosh, M. Inversion of two-phase extensional basin systems during subduction of the Paleo-Pacific Plate in the SW Korean Peninsula: Implication for the Mesozoic “Laramide-style” orogeny along East Asian continental margin. Geosci. Front. 2019, 10, 909–925.
- Zhao, Q.; Yan, Y.; Tonai, S.; Tomioka, N.; Clift, P.D.; Hassan, M.H.A.; Aziz, J.H.B.A. A new K-Ar illite dating application to constrain the timing of subduction in West Sarawak, Borneo. GSA Bull. 2021.
- Zwingmann, H.; Mancktelow, N.; Antognini, M.; Lucchini, R. Dating of shallow faults: New constraints from the AlpTransit tunnel site (Switzerland). Geology 2010, 38, 487–490.
- Zwingmann, H.; Han, R.; Ree, J.-H. Cretaceous reactivation of the Deokpori Thrust, Taebaeksan Basin, South Korea, constrained by K-Ar dating of clayey fault gouge. Tectonics 2011, 30, TC5015.
- Tonai, S.; Ito, S.; Hashimoto, Y.; Tamura, H.; Tomioka, N. Complete 40Ar resetting in an ultracataclasite by reactivation of a fossil seismogenic fault along the subducting plate interface in the Mugi Melange of the Shimanto accretionary complex, southwest Japan. J. Struct. Geol. 2016, 89, 19–29.
- Aledga, L.; Viola, G.; Casas-Sainz, A.; Marcén, M.; Román-Berdiel, T.; van der Lelij, R. Unraveling multiple thermotectonic events accommodated by crustal-scale faults in northern Iberia, Spain: Insights from K-Ar dating of clay gouges. Tectonics 2019, 38, 3629–3651.
- Fisher, D.M.; Tonai, S.; Hashimoto, Y.; Tomioka, N.; Oakley, D. K-Ar dating of fossil seismogenic thrusts in the Shimanto Accretionary Complex, Southwest Japan. Tectonics 2019, 38, 3866–3880.
- Ylagan, R.F.; Kim, C.S.; Pevear, D.R.; Vrolijk, P.J. Illite polytype quantification for accurate K-Ar age determination. Am. Mineral. 2002, 87, 1536–1545.
- Kübler, B. Les indicateurs des transformations physiques etchimiquesdans la diagènese, température et calorimétrie. In Thermométrie et Barométriegéologiques; Lagache, M., Ed.; French Society of Mineralogy and Crystallography: Paris, France, 1084; pp. 489–596.

