 +1 credit
| Version | Summary | Created by | Modification | Content Size | Created at | Operation |
|---|---|---|---|---|---|---|
| 1 | Houda Laghouaouta | + 1381 word(s) | 1381 | 2021-10-22 07:59:33 | | | |
| 2 | Amina Yu | Meta information modification | 1381 | 2021-10-25 11:52:54 | | |
Video Upload Options
Resilience can be defined as the ability of the animal to rapidly recover its productivity despite the perturbations that might occur during its productive life.
1. Introduction
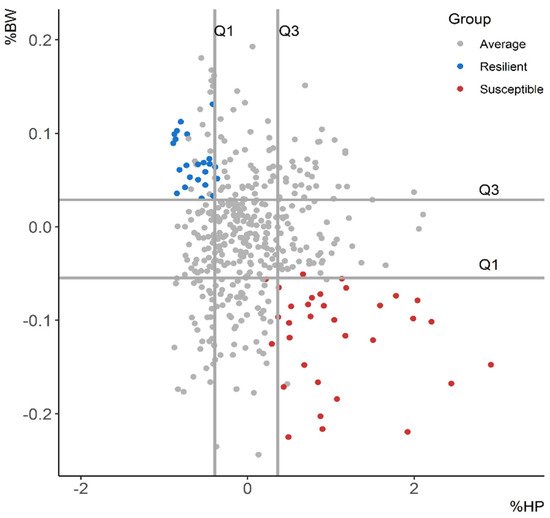
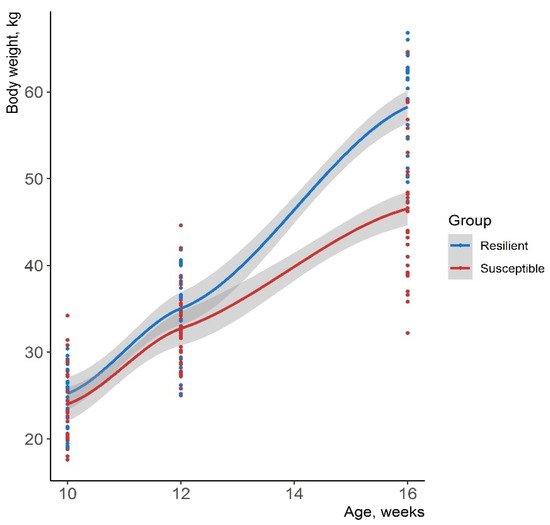
Selective breeding for improved resilience would provide resistant animals with robust phenotypes [1]. Thus, it would increase the profitability and the sustainability of the production systems. However, there is no straightforward quantification method for resilience. Resilience indicators have been elaborated based on productivity-related traits [2][3][4][5] and immune phenotypes [6][7] in several livestock species. In this review, a total of 445 commercial Duroc pigs were challenged with an attenuated Aujeszky vaccine at 12 weeks of age (experimental group) and 95 pigs were inoculated with phosphate-buffered saline (control group). The deviation from the expected body weight given the growth curve of control pigs (∆BW) and the increment of the acute-phase protein haptoglobin (∆HP) at 4 days post-vaccination (DPV) were suggested as resilience indicators in growing pigs. Challenged pigs that maintained their productivity and had a minor activation of the acute-phase protein haptoglobin were deemed resilient, whereas pigs that had low ∆BW values and high activation of haptoglobin were deemed susceptible. Pigs were also classified based on ∆BW relative to the expected body weight (BW) at 28 DPV (%BW) and ∆HP relative to the basal level of haptoglobin (%HP).
2. Descriptive Statistics for the Novel Resilience Indicators
| Trait | Mean | SD 1 | Min | Max |
|---|---|---|---|---|
| ∆BW 2 (kg) | −0.68 | 3.64 | −13.2 | +10.1 |
| %BW 3 (%) | −1.42 | 7.26 | −24.4 | +19.3 |
| ∆HP 4 (mg/mL) | +0.03 | 0.70 | −1.41 | +2.65 |
| %HP 5 (%) | +5.40 | 60.4 | −89.2 | +292 |
1 Standard deviation; 2 Body weight deviation from the expected growth curve of control pigs at 28 days post-vaccination (DPV); 3 Ratio between ∆BW and the expected body weight at 28 DPV given the growth curve of control pigs; 4 Haptoglobin increment at 4 DPV; 5 Ratio between ∆HP and the basal level of haptoglobin.
Phenotypic correlations between the resilience indicators are reported in Table 2. A negative and low correlation was reported between ∆BW and ∆HP (r = −0.09, p < 0.05), suggesting that they capture different aspects of resilience.
| Trait | ∆BW 1 | ∆HP 2 | %BW 3 | %HP 4 |
|---|---|---|---|---|
| ∆BW | 1 | −0.09 * | 0.99 *** | −0.14 ** |
| ∆HP | 1 | −0.09 ns | 0.94 *** | |
| %BW | 1 | −0.14 ** | ||
| %HP | 1 |
1 Body weight deviation from the expected growth curve of non-vaccinated pigs at 28 days post-vaccination (DPV); 2 Haptoglobin increment at 4 DPV; 3 Ratio between ∆BW and the expected body weight at 28 DPV given the growth curve of control pigs. 4 Ratio between ∆HP and the basal level of haptoglobin; 5 * p < 0.05; ** p < 0.01; *** p < 0.001; ns non-significant.
3. Classification of Pigs’ Resilience
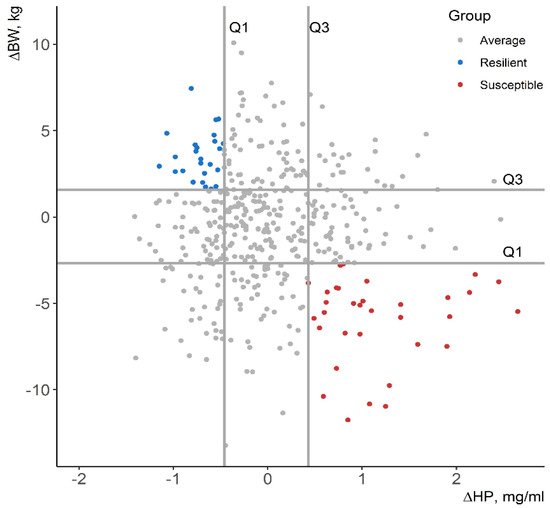
| Trait | Group | Mean | SD |
|---|---|---|---|
| ∆BW 1 (kg) | R | +3.54 | 1.42 |
| S | −6.00 | 2.44 | |
| %BW 2 (%) | R | +6.60 | 2.81 |
| S | −11.7 | 5.13 | |
| ∆HP 3 (mg/mL) | R | −0.71 | 0.18 |
| S | +1.17 | 0.61 | |
| %HP 4 (%) | R | −61.2 | 18.9 |
| S | +108.4 | 68.2 |
1 Body weight deviation from the expected growth curve of control pigs at 28 days post-vaccination (DPV); 2 Ratio between ∆BW and the expected body weight at 28 DPV given the growth curve of control pigs; 3 Haptoglobin increment at 4 DPV; 4 Ratio between ∆HP and the basal level of haptoglobin.
4. Heritability Estimates
| Trait | Mean 1 | P0.10 2 | HPD95% 3 |
|---|---|---|---|
| ∆BW 4 | 0.33 | 0.94 | 0.02–0.65 |
| %BW 5 | 0.37 | 0.93 | 0.02–0.74 |
| ∆HP 6 | 0.16 | 0.66 | 0.00–0.38 |
| %HP 7 | 0.13 | 0.53 | 0.00–0.32 |
1 Mean of the marginal posterior distribution of the heritability; 2 Probability of the heritability estimate being greater than 0.10; 3 Highest posterior density interval at 95% of probability; 4 Body weight deviation from the expected growth curve of non-vaccinated pigs at 28 days post-vaccination (DPV); 5 Ratio between ∆BW and the expected body weight at 28 DPV given the growth curve of control pigs; 6 Haptoglobin increment at 4 DPV; 7 Ratio between ∆HP and the basal level of haptoglobin.
5. Conclusions
Altogether, we propose ∆BW and ∆HP as novel resilience indicators in growing pigs. The suggested indicators are easy to measure, genetically controlled and show substantial variability between animals. Thus, they may be improved through selective breeding. This approach may be applied to quantify resilience in other species using different infectious and non-infectious challenges. Moreover, genomic studies on resilient and susceptible animals can help in elucidating the molecular basis of the resilient response.
References
- H. A. Mulder; H. Rashidi; Selection on resilience improves disease resistance and tolerance to infections. Journal of Animal Science 2017, 95, 3346-3358, 10.2527/jas2017.1479.
- Tom V.L. Berghof; Henk Bovenhuis; Han A. Mulder; Body Weight Deviations as Indicator for Resilience in Layer Chickens. Frontiers in Genetics 2019, 10, 1216, 10.3389/fgene.2019.01216.
- Austin M. Putz; John C. S. Harding; Michael K. Dyck; F. Fortin; Graham S. Plastow; Jack C. M. Dekkers; PigGen Canada; Novel Resilience Phenotypes Using Feed Intake Data From a Natural Disease Challenge Model in Wean-to-Finish Pigs. Frontiers in Genetics 2019, 9, 660, 10.3389/fgene.2018.00660.
- M. J. Argente; M. L. García; K. Zbyňovská; P. Petruška; Marcela Capcarova; A. Blasco; Correlated response to selection for litter size environmental variability in rabbits’ resilience. Animal 2019, 13, 2348-2355, 10.1017/s1751731119000302.
- G.G. Elgersma; G. De Jong; R. Van Der Linde; H.A. Mulder; Fluctuations in milk yield are heritable and can be used as a resilience indicator to breed healthy cows. Journal of Dairy Science 2018, 101, 1240-1250, 10.3168/jds.2017-13270.
- Sarita Z Y Guy; Li Li; Peter C Thomson; Susanne Hermesch; Quantifying the health challenges in an Australian piggery using medication records for the definition of disease resilience1. Journal of Animal Science 2019, 97, 1076-1089, 10.1093/jas/skz025.
- Yulu Chen; Laura E. Tibbs Cortes; Carolyn Ashley; Austin M. Putz; Kyu-Sang Lim; Michael K. Dyck; Frederic Fortin; Graham S. Plastow; Jack C. M. Dekkers; John C. S. Harding; et al.Pig Gen Canada The genetic basis of natural antibody titers of young healthy pigs and relationships with disease resilience. BMC Genomics 2020, 21, 1-17, 10.1186/s12864-020-06994-0.
- Roger Ros-Freixedes; J. Reixach; M. Tor; Joan Estany; Expected genetic response for oleic acid content in pork1. Journal of Animal Science 2012, 90, 4230-4238, 10.2527/jas.2011-5063.
- Mary Clapperton; Abigail B Diack; Oswald Matika; Elizabeth J Glass; Christy D Gladney; Martha A Mellencamp; Annabelle Hoste; Stephen C Bishop; Traits associated with innate and adaptive immunity in pigs: heritability and associations with performance under different health status conditions. Genetics Selection Evolution 2009, 41, 54-54, 10.1186/1297-9686-41-54.
- M. Henryon; P. M. H. Heegaard; J. Nielsen; P. Berg; H. R. Juul-Madsen; Immunological traits have the potential to improve selection of pigs for resistance to clinical and subclinical disease. Animal Science 2006, 82, 597-606, 10.1079/asc200671.

