 +1 credit
| Version | Summary | Created by | Modification | Content Size | Created at | Operation |
|---|---|---|---|---|---|---|
| 1 | Anssi Ahtikoski | + 1858 word(s) | 1858 | 2021-10-21 11:01:40 | | | |
| 2 | Rita Xu | Meta information modification | 1858 | 2021-10-22 04:46:23 | | | | |
| 3 | Rita Xu | -61 word(s) | 1797 | 2021-10-22 04:47:04 | | |
Video Upload Options
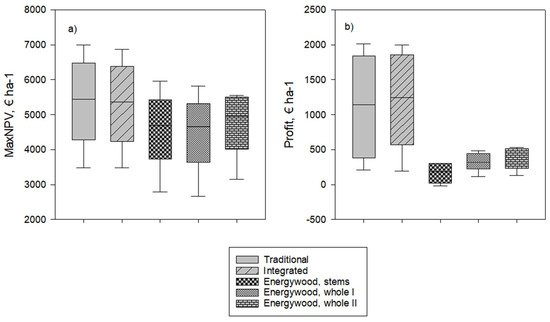
There is a vast backlog of conducted first commercial thinnings (FCTs) in Finland. The reasons are many, but probably the most crucial would be the lack of simultaneous economic incentives for participating agents, i.e., private forest owners and forest machine contractors. In this study an FCT was executed accruing to five predetermined management options: (1) Industrial wood thinning with only two timber assortments, pulpwood and saw logs, (2) Integrated procurement of industrial and energy wood, (3) Energy wood thinning solely consisting of delimbed stems, (4) Whole-tree energy wood thinning with an energy price of 3 € m−3 and (5) Whole-tree energy wood thinning with energy price of 8 € m−3. Then, a two-phase financial analysis consisting of stand-level optimization (private forest owners) and profitability assessment (contractor) was conducted in order to find out whether there would be simultaneous economic incentives for both participants of FCT. The stand-level optimization revealed the financially best management options for a private forest owner, and then, for a contractor, the profitability assessment exposed the profit (or loss) associated with the particular management option.
1. Introduction
2. Forest Data
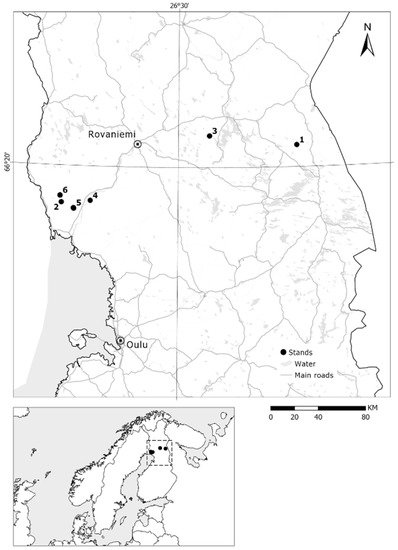
| Stand Number | Main Tree Species | Site Type * | Stem Number/ha | Basal Area, m2/ha | Mean Height, m | Mean DBH **, cm |
|---|---|---|---|---|---|---|
| 1 | Scots pine | MT | 2044 | 24.63 | 9.58 | 15.13 |
| 2 | Norway spruce | MT | 1434 | 33.28 | 14.05 | 19.70 |
| 3 | Scots pine | MT | 1664 | 25.98 | 10.57 | 15.58 |
| 4 | Norway spruce | MT | 1689 | 35.68 | 13.67 | 18.33 |
| 5 | Norway spruce | Mtkg | 1320 | 32.95 | 14.29 | 20.21 |
| 6 | Norway spruce | Mtkg | 1481 | 26.72 | 12.47 | 17.71 |
* Myrtillus type (MT) on mineral soils and the corresponding site type on peatlands Myrtillus type (Mtkg) both indicate a fertile site type. For the Finnish forest site type classification, see [33]. ** Mean diameter at breast height.
3. Growth and Yield
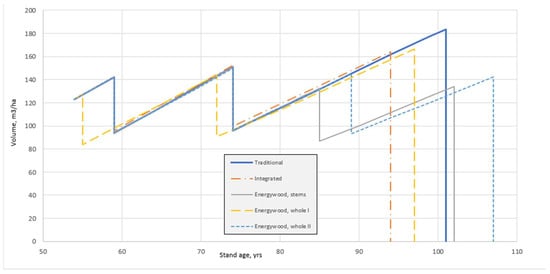
| Stand | Management option | Cutting Removal of the 1st Thinning, m3 ha−1 | Total Cutting Removal m3 ha−1 Ongoing b Future c |
Rotation Period, yrs Ongoing Future |
||
|---|---|---|---|---|---|---|
| Stand 1 | Traditional | 45.0 (0.0) | 279.1 | 324.0 | 101 | 98 |
| Integrated | 54.0 (10.7) a | 266.2 | 356.3 | 94 | 104 | |
| Energywood stems | 46.0 (46.0) | 275.2 | 304.7 | 102 | 95 | |
| Energywood whole I | 52.0 (52.0) | 268.9 | 346.3 | 101 | 102 | |
| Energywood whole II | 52.0 (52.0) | 299.2 | 314.4 | 107 | 96 | |
| Stand 2 | Traditional | 76.0 (0.0) | 303.7 | 404.3 | 110 | 78 |
| Integrated | 88.0 (12.5) | 312.8 | 381.0 | 110 | 78 | |
| Energywood stems | 52.0 (52.0) | 311.9 | 426.0 | 111 | 81 | |
| Energywood whole I | 59.0 (59.0) | 319.2 | 442.6 | 111 | 83 | |
| Energywood whole II | 60.0 (60.0) | 315.8 | 420.3 | 110 | 80 | |
| Stand 3 | Traditional | 58.0 (0.0) | 352.0 | 355.9 | 91 | 87 |
| Integrated | 69.0 (11.6) | 361.6 | 369.9 | 91 | 89 | |
| Energywood stems | 47.0 (46.6) | 352.3 | 363.0 | 91 | 87 | |
| Energywood whole I | 57.0 (56.8) | 362.8 | 388.1 | 91 | 91 | |
| Energywood whole II | 68.0 (67.9) | 364.0 | 391.6 | 91 | 92 | |
| Stand 4 | Traditional | 82.0 (0.0) | 325.3 | 390.8 | 112 | 79 |
| Integrated | 95.0 (13.5) | 330.3 | 414.6 | 111 | 82 | |
| Energywood stems | 64.5 (64.5) | 320.9 | 413.1 | 110 | 82 | |
| Energywood whole I | 76.0 (75.7) | 335.9 | 437.8 | 112 | 85 | |
| Energywood whole II | 75.5 (75.5) | 332.4 | 423.3 | 111 | 83 | |
| Stand 5 | Traditional | 79.0 (0.0) | 304.7 | 402.6 | 110 | 78 |
| Integrated | 91.0 (13.3) | 317.0 | 413.8 | 111 | 79 | |
| Energywood Stems | 51.0 (50.9) | 317.6 | 425.7 | 112 | 81 | |
| Energywood whole I | 63.0 (62.5) | 323.3 | 442.8 | 112 | 83 | |
| Energywood whole II | 75.0 (74.5) | 332.4 | 423.3 | 111 | 83 | |
| Stand 6 | Traditional | 48.0 (0.0) | 295.7 | 381.2 | 111 | 77 |
| Integrated | 58.0 (9.5) | 325.5 | 428.7 | 111 | 81 | |
| Energywood Stems | 45.2 (45.0) | 298.2 | 372.4 | 111 | 76 | |
| Energywood whole I | 53.3 (53.0) | 303.8 | 385.8 | 111 | 78 | |
| Energywood whole II | 54.0 (53.6) | 312.6 | 399.2 | 114 | 80 | |
| Traditional | 64.4 (0.0) d | 310.1 | 376.5 | 105.8 | 82.8 | |
| Integrated | 75.8 (11.8) | 318.9 | 395.4 | 104.7 | 85.5 | |
| Average | Energywood stems | 50.8 (50.8) | 312.7 | 384.2 | 106.3 | 83.7 |
| Energywood whole I | 59.9 (59.9) | 319.0 | 407.2 | 106.3 | 87.0 | |
| Energywood whole II | 64.9 (64.9) | 326.1 | 395.3 | 107.3 | 85.7 | |
4. Financial Performance
References
- Ihalainen, A.; Mäki-Simola, E.; Sauvula-Seppälä, T.; Torvelainen, J.; Uotila, E.; Vaahtera, E.; Ylitalo, E. (Eds.) Finnish Forest Resources; Natural Resources Institute Finland (Luke): Helsinki, Finland, 2019; p. 198.
- Korhonen, K.T.; Ihalainen, A.; Ahola, A.; Heikkinen, J.; Henttonen, H.M.; Hotanen, J.-P.; Nevalainen, S.; Pitkänen, J.; Strandström, M.; Viiri, H. (Eds.) Suomen Metsät 2009–2013 ja Niiden Kehitys 1921–2013; Natural Research Institute Finland: Helsinki, Finland, 2017; p. 86.
- Korhonen, K.T.; Ihalainen, A.; Strandström, M.; Salminen, O.; Hirvelä, H.; Härkönen, K. Riittääkö puu—VMI-tulokset. In 61. Lapin Metsätalouspäivät, Rovaniemi; METO—Metsäalan Asiantuntijat ry: Helsinki, Finland, February 2019.
- Ahtikoski, A.; Hökkä, H. Intensive forest management—Does it financially pay off on drained peatlands? Can. J. For. Res. 2019, 49, 1101–1113.
- Karttunen, K.; Ahtikoski, A.; Kujala, S.; Törmä, H.; Kinnunen, J.; Salminen, H.; Huuskonen, S.; Kojola, S.; Lehtonen, M.; Hynynen, J.; et al. Regional socio-economic impacts of intensive forest management, a CGE approach. Biomass Bionerg. 2018, 118, 8–15.
- Assman, E. The Principles of Forest Yield Study—Studies in the Organic Production, Structure, Increment and Yield of Forest Stands; Pergamon Press: Oxford, UK, 1970; pp. 1–506.
- Hakkila, P. Ensiharvennuspuun hyödyntäminen (Utilization of roundwood from first thinnings). Folia Forestalia 1996, 428–433.
- Stöd, R.; Siren, M.; Tanttu, V.; Verkasalo, E. Jäävän puuston ja poistuman tekninen laatu ensiharvennusmänniköissä (Technical quality of remaining trees after first thinning). Metsätieteen Aikakauskirja 2003, 2003, 6110.
- Nuutinen, Y.; Kärhä, K.; Laitila, J.; Jylhä, P.; Keskinen, S. Productivity of whole-tree bundler in energy wood and pulpwood harvesting from early thinnings. Scand. J. For. Res. 2011, 26, 329–338.
- Mäkinen, H.; Hynynen, J. Wood density and tracheid properties of Scots pine: Responses to repeated fertilization and timing of the first commercial thinning. Forestry 2014, 87, 437–447.
- Laitila, J.; Heikkilä, J.; Anttila, P. Harvesting alternatives, accumulation and procurement cost of small-diameter thinning wood for fuel in Central-Finland. Silva Fenn. 2010, 44, 465–480.
- Laitila, J.; Väätäinen, K. Truck transportation and chipping productivity of whole trees and delimbed energy wood in Finland. Croat. J. For. Eng. 2012, 33, 199–210.
- Petty, A. Opportunities for Cost Mitigation and Efficiency Improvements through Ration Alization of Small-Diameter Energy Wood Supply Chains. Ph.D. Thesis, University of Eastern Finland, Joensuu, Finland, 2014.
- Karttunen, K.; Laitila, J.; Ranta, T. First-thinning harvesting alternatives for industrial or energy purposes based on regional Scots pine stand simulations in Finland. Silva Fenn. 2016, 50, 16.
- Kärhä, K.; Jouhiaho, A.; Mutikainen, A.; Mattila, M. Mechanized energy wood harvesting from early thinnings. Int. J. For. Eng. 2005, 16, 15–26.
- Heikkilä, J.; Siren, M.; Äijälä, O. Management alternatives of energy wood thinning stands. Biomass Bioenerg. 2007, 31, 255–266.
- Ahtikoski, A.; Heikkilä, J.; Alenius, V.; Siren, M. Economic viability of utilizing biomass energy from young stands—The case of Finland. Biomass Bioenerg. 2008, 32, 988–996.
- Laitila, J.; Väätäinen, K. Productivity and cost of harvesting overgrowth brushwood from roadsides and field edges. Int. J. For. Eng. 2021, 32, 140–154.
- Heikkilä, J.; Sirén, M.; Ahtikoski, A.; Hynynen, J.; Sauvula, T.; Lehtonen, M. Energy wood thinning as a part of the stand management of Scots pine and Norway spruce. Silva Fenn. 2009, 43, 129–146.
- Kärhä, K. Integrated harvesting of energy wood and pulpwood in first thinnings using the two-pile cutting method. Biomass Bioenerg. 2011, 35, 3397–3403.
- Laitila, J.; Väätäinen, K. Hakkuutyön tuottavuus metsävarustellulla turvetuotantotraktorilla karsitun aines- ja energiapuun korjuussa (The cutting productivity in integrated harvesting of pulpwood and delimbed energy wood with a forestry-equipped peat harvesting tractor). Suo Mires Peat 2013, 64, 97–112.
- Kärhä, K.; Jylhä, P.; Laitila, J. Integrated procurement of pulpwood and energy wood from early wood from early thinnings using whole-tree bundling. Biomass Bioenerg. 2011, 35, 3389–3396.
- Nuutinen, Y.; Björheden, R. Productivity and work processes of small-tree bundler Fixteri FX15a in energy wood harvesting from early pine dominated thinnings. Int. J. For. Eng. 2016, 27, 29–42.
- Petty, A.; Kärhä, K. Effect of subsidies on the profitability of energy wood production of wood chips from early thinnings in Finland. For. Policy Econ. 2011, 12, 575–581.
- Ministry of Agriculture and Forestry of Finland. Available online: https://mmm.fi/en/forests (accessed on 19 May 2021).
- Amacher, G.S.; Ollikainen, M.; Koskela, E. Economics of Forest Resources; The MIT Press: Cambridge, MA, USA, 2009; pp. 1–448.
- Niinimäki, S.; Tahvonen, O.; Mäkelä, A. Applying a process-based model in Norway spruce management. For. Ecol. Manag. 2012, 265, 102–115.
- Faustmann, M. Berechnung des Werthes, welchen Waldboden, sowie noch nicht haubare Holzbestände für die Waldwirthschaft besitzen. (Calculation of the value which forest land and immature stands possess for forestry). Allgemeine For. Jagd Zeitung 1849, 25, 441–455.
- Parkatti, V.-P.; Assmuth, A.; Rämö, J.; Tahvonen, O. Economics of boreal conifer species in continuous cover and rotation forestry. For. Policy Econ. 2019, 100, 55–67.
- Finnish Forest Centre. Open Database on NIPFs’ Forests Including Silvicultural Status Associated with Each Stand. 2019. Available online: https://www.metsakeskus.fi/en/open-forest-and-nature-information/information-about-finnish-forests (accessed on 17 October 2019).
- Ahtikoski, A.; Karhu, J.; Ahtikoski, R.; Haapanen, M.; Hynynen, J.; Kärkkäinen, K. Financial assessment of alternative breeding goals using stand-level optimization and data envelopment analysis. Scand. J. For. Res. 2020, 35, 262–273.
- Tharakan, P.J.; Volk, T.A.; Lindsey, C.A.; Abrahamson, L.P.; White, E.H. Evaluating the impact of three incentive program on the economics of cofiring willow biomass with coal in New York State. Energ. Policy 2005, 33, 337–347.
- Tonteri, T.; Hotanen, J.P.; Kuusipalo, J. The Finnish forest site type approach: Ordination and classification studies of mesic forest sites in southern Finland. Vegetatio 1990, 87, 85–98.

