Submitted Successfully!
To reward your contribution, here is a gift for you: A free trial for our video production service.
Thank you for your contribution! You can also upload a video entry or images related to this topic.
Version Summary Created by Modification Content Size Created at Operation
1 + 1830 word(s) 1830 2021-09-29 08:17:07 |
2 update layout and reference Meta information modification 1830 2021-10-19 10:50:04 | |
3 update layout Meta information modification 1830 2021-10-19 10:51:16 |

Video Upload Options

Do you have a full video?

Confirm

Are you sure to Delete?
Cite
If you have any further questions, please contact Encyclopedia Editorial Office.
Ilie, D.E. Milk Somatic Cell Score. Encyclopedia. Available online: https://encyclopedia.pub/entry/15127 (accessed on 27 July 2024).
Ilie DE. Milk Somatic Cell Score. Encyclopedia. Available at: https://encyclopedia.pub/entry/15127. Accessed July 27, 2024.
Ilie, Daniela Elena. "Milk Somatic Cell Score" Encyclopedia, https://encyclopedia.pub/entry/15127 (accessed July 27, 2024).
Ilie, D.E. (2021, October 19). Milk Somatic Cell Score. In Encyclopedia. https://encyclopedia.pub/entry/15127
Ilie, Daniela Elena. "Milk Somatic Cell Score." Encyclopedia. Web. 19 October, 2021.
Milk Somatic Cell Score
Edit

Mastitis is one of the most frequently encountered diseases in dairy cattle, negatively affecting animal welfare and milk production. For this reason, contributions to understanding its genomic architecture are of great interest. Genome-wide association studies (GWAS) have identified multiple loci associated with somatic cell score (SCS) and mastitis in cattle.

genome-wide association study (GWAS) mastitis Romanian cattle

1. Introduction

In recent decades, the prevalence of clinical mastitis in cattle has increased significantly [1] in most of developed agricultural countries where farming practices are more intensive. This tendency is manifested in parallel with a higher selection pressure for high milk yields in modern dairy breeds. Therefore, improving the understatement of the genetic base of mastitis and its indicator traits represents a major goal for the dairy cattle breeding industry as it can improve udder health and increase the milk quality, while also reducing early involuntary culling, discarded milk, veterinary services and labor costs.
In dairy cattle, many studies have been conducted in different parts of the world on various breeds in order to investigate the genetic base of mastitis. Research results from more than two decades have shown the association between the major histocompatibility complex (MHC) and susceptibility or resistance to intramammary infection [2]. In the beginning, most of the studies focused on MHC genes, particularly the DRB region, for which various associations between allelic variants and immune response and mastitis resistance have been reported by several authors [3][4][5][6]. Later, quantitative trait loci (QTL) responsible for clinical mastitis and somatic cell counts (SCC) have been identified in the majority of the chromosomes. Among these, QTL on chromosome 1, 3, 7, 8, 14, 18, 21 and 23 were confirmed in different separate studies [1]. Moreover, the technological developments of molecular genetics from the last decade, followed by sequencing of the Bos taurus genome in 2009 [7], enabled the identification of several molecular markers responsible for susceptibility or resistance to mastitis. The appearance of high-throughput genotyping technologies allowed genome-wide association studies to be carried out in cattle [8]. By the application of new genetic analysis methods and genome-wide association studies (GWAS), exploring the genetic architecture of the important traits in different cattle breeds [9] and detecting the significant single nucleotide polymorphisms (SNPs) or genomic regions associated with mastitis in dairy cattle became possible. For instance, Meredith et al. [8] used 773 Holstein-Friesian AI sires with progeny genotyped by using the Illumina BovineSNP50 Genotyping Beadchip and identified nine SNPs that were significantly associated with somatic cell score (SCS), of which three were located on chromosomes 6 and 10 within known QTL regions for SCS, and six SNPs placed outside known QTL regions for SCS were located on chromosomes 6, 15 and 20. One year later, the same author [10], by using 702 Holstein-Friesian sires that were genotyped for 777,962 SNPs on the Illumina High-density Bovine BeadChip, detected 28 QTL regions associated with SCS, with 138 SNPs located across 15 chromosomes (1, 3, 4, 5, 6, 9, 10, 13, 17, 20, 21, 22, 23, 24, 25 and 26). Strillacci et al. [11] conducted a GWAS for SCS in Valdostana Red Pied cattle and found genes involved in mastitis resistance or variation of SCS in QTL on chromosomes 9, 13, 15, 17, 19, 21 and 22. Another study [12] analyzed 544 Holstein and Holstein × Jersey cows and identified six SNPs on chromosomes 1, 5, 10, 18 and 26 that were associated with traits derived from SCC. Recently, a genome-wide association study [9] found three significant SNPs on chromosomes 5, 8 and 22 that were associated with SCS in 2410 Xinjiang Brown cows. According to the current release of the Cattle Quantitative Trait Loci (QTL) Database of Animal QTLdb (The Animal Quantitative Trait Loci Database, https://www.animalgenome.org/cgi-bin/QTLdb/BT/index, accessed on 20 May 2021 [13]), a total of 2401 QTLs, spread on most bovine chromosomes, were found to be associated with mastitis.

2. Animals and Phenotypes

This study was conducted on 723 dairy cattle out of which 601 were RS (Romanian Spotted) and 122 were RB (Romanian Brown) cattle. The animals involved were managed in three breeding herds: two experimental herds belonging to the Romanian Academy of Agricultural Science (the Research and Development Station for Bovine Arad and the Research and Development Station for Bovine Sighetu Marmatiei) and one commercial herd located in Berliste. All cows involved in the study were kept under comparable housing and feeding conditions, with similar milking and sanitary conditions, and were mechanically milked twice a day. All the animals had at least 3 monthly test-day records per lactation. Only data corresponding to the first three lactations were included in the analysis.
Phenotypic data consisted of 33,330 SCC records, of which 24,295 were for RS and 9035 were for RB cattle. For SCC determination, milk records were conducted every 28 days by the Official Dairy Control service. The milk samples were analyzed for SCC determination in the laboratory of the Milk Quality Control Foundation (Cluj-Napoca, Romania) by using CombiFoss™ FT + integrating MilkoScan™ FT + and Fossomatic™ FC.
In order to achieve a normal distribution of the data, the values of SCC were transformed to SCS according to the formula of Wiggans and Shook [14] as SCS = log2 (SCC/100,000) + 3, specified by the international standard (Interbull Code of Practice. https://interbull.org/ib/codeofpractice, accessed on 25 August 2021 [15]).

3. Principal Component Analysis

The animals involved in this study came from two breeds and three breeding herds. Thus, in order to assess population stratification, we performed principal component analysis. The PCA plot revealed a clear population structure for the animals in the two cattle breeds included in the study, showing a clear separation between individuals, according to breed (Figure 1). Clusters of the same color represent individuals from the same breed. All animals from the RB breed clustered together in all pairwise scatter plots of the first three principal components, but they were separated from the RS individuals. From the three plots in Figure 1, we observed that PC1 separates the individuals from the two breeds, whereas PC2 and PC3 divide individuals within the RS breed. The individuals from the RS breed split into several subgroups that were best observed in the scatterplot of PC2 and PC3 (Figure 1b). We have conducted a separate investigation into the origins of these different clusters (data not shown) and concluded that one subgroup consists of cows with paternity from one single sire and the rest of the subgroups consist of cows from several different sires.
Figure 1. Population structure from the principal component analysis of the 40,305 single nucleotide polymorphisms (SNPs) and 690 cattle. Population structure is presented as pairwise scatter plots (ac) of the first three principal components (PC), with green and orange dots representing the two breeds (Romanian Spotted in orange and Romanian Brown in green). (a) PC1 vs. PC2; (b) PC2 vs. PC3; (c) PC1 vs. PC3.

4. Significant SNPs Associated with SCS

To investigate the genetic variation that underlies the SCS, GWAS was performed in roder to identify the associated SNP loci in cattle. The Manhattan plots for SCS in the RS and RB breeds are shown in Figure 2. The upper horizontal lines represent the Bonferroni-adjusted genome-wide significance threshold −log10 (p) ≥ 5.89, and the inferior horizontal lines represent the suggestive threshold of −log10 (p) ≥ 4.00, which was set to report further significant associations that were not observed under Bonferroni corrections. The suggestive threshold was chosen according to previous studies where researchers defined a suggestive threshold between p < 10−5 and p < 10−3 [16][17]. The candidate genes were detected by verifying whether significant or suggestive SNPs overlapped a gene or were located within 1 MBp upstream or downstream from a gene. The genomic positions were based on the UMD3.1 genome assembly of Bos taurus [7].
Figure 2. Manhattan plots for somatic cell score (SCS) in the Romanian Spotted (left) and Romanian Brown breed (right). The blue line indicates the suggestive p value threshold of −log10 (p) ≥ 4.00. The red line indicates the Bonferroni genome-wide significance p value threshold at −log10 (p) ≥ 5.89. The y-axis shows the −log10 (p) of 40,305 SNPs, and the x-axis shows the chromosomal positions. (a) First lactation; (b) Second lactation; (c) Third lactation.

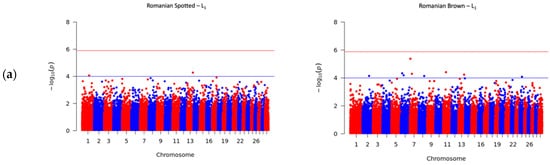
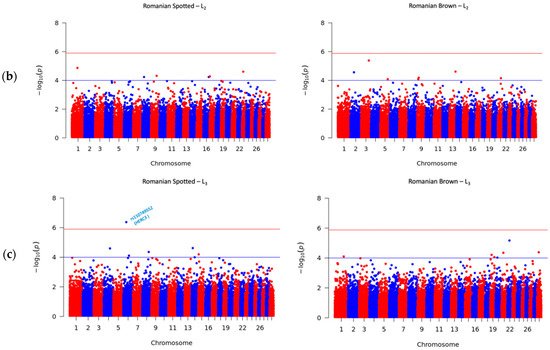
A total number of 41 SNPs were detected in the RS and RB breeds, of which 40 SNPs passed the suggestive threshold and, ultimately, one SNP passed the significance threshold after Bonferroni correction and was associated with SCS in the RS breed in L3 (Figure 2c, left side). For the RS breed, 3 out of 15 SNPs were located near three known genes, and one SNP overlapped the HERC3 gene. Of the fifteen SNPs in the RS breed, AX-106761943 (rs110749552) was located on chromosome 6 within the HERC3 gene (HECT and RLD domain containing E3 ubiquitin protein ligase 3) and was the most significant SNP for SCS (log10 (p) = 6.37). In the RB breed, the genome-wide analysis detected 26 SNPs that reached genome-wide significance for association with SCS. Among these SNPs, 14 out of 26 SNPs were located near 12 known genes; two SNPs, AX-106741653 and AX-115114947, were located near the AKAP8 gene, and two other SNPs, AX-106735825 (rs43585636) and AX- 117085949 (rs43585209) were located near the COL12A1 gene, respectively. None of the 15 detected SNPs in the RS breed were in common with the detected 26 SNPs that reached genome-wide significance for association with SCS in the RB breed.

This study revealed that different markers and candidate genes were found for the two breeds in our study. In addition, all identified SNPs have been distinct among the three parities, denoting that SCS is influenced by different genes according to parity. The different sets of markers discovered in this work compared to studies reported in the literature can be attributed to various factors. We can assume that the power of detecting SNPs can be lower in the RB breed compared to the RS breed as a consequence of the comparatively lower number of genotyped RB animals used in the analysis. Furthermore, previously known mastitis related genes such as LUZP2, AKAP8 and MEGF10 were also identified in our study as candidate genes for SCS in the RB breed. For this specific case in the RB breed, further studies using larger sample sizes should be performed in order to validate previous results. Finally, an additional factor that may influence the different sets of candidate SNPs/breed is the distinct genetic backgrounds of the two breeds as they have different levels of clustering, as shown in previous studies on Romanian cattle breeds.

The specific novel SNPs and candidate genes located around them reported in the present study can be considered as candidates involved in SCS and mastitis resistance; how- ever, these need to be kept in perspective, and polymorphisms in those genes should be fur- ther analyzed to highlight whether they influence the ability of dairy cows to resist mastitis.

5. Conclusions

Our study represents the first GWAS for SCS in Romanian dairy cattle and, thus, provides new perspective into the genetic architecture of udder infections in these native dairy cattle. We identified 41 SNPs and detected their significant associations with variation in SCS in dairy cattle. In both breeds, the SNPs and position of association signals were distinct among the three parities, denoting that mastitis is influenced by different genes according to parity. The results contribute to an increase in knowledge regarding the proportion of genetic variability explained by SNPs for SCS in dairy cattle and, particularly, in Romanian native cattle. However, further large-scale studies of a vast number of native dairy cattle breeds are needed in order to investigate others markers and genes that could be involved in mastitis.

References

  1. Rupp, R.; Boichard, D. Genetics of resistance to mastitis in dairy cattle. Vet. Res. 2003, 34, 671–688.
  2. Aarestrup, F.M.; Jensen, N.E.; Ostergård, H. Analysis of associations between major histocompatibility complex (BoLA) class I haplotypes and subclinical mastitis of dairy cows. J. Dairy Sci. 1995, 78, 1684–1692.
  3. Dietz, A.B.; Cohen, N.D.; Timms, L.; Kehrli, M.E., Jr. Bovine lymphocyte antigen class II alleles as risk factors for high somatic cell counts in milk of lactating dairy cows. J. Dairy Sci. 1997, 80, 406–412.
  4. Kelm, S.C.; Detilleux, J.C.; Freeman, A.E.; Kehrli, M.E., Jr.; Dietz, A.B.; Fox, L.K.; Butler, J.E.; Kasckovics, I.; Kelley, D.H. Genetic association between parameters of innate immunity and measures of mastitis in periparturient Holstein cattle. J. Dairy Sci. 1997, 80, 1767–1775.
  5. Gilliespie, B.E.; Jayarao, B.M.; Dowlen, H.H.; Oliver, S.P. Analysis and frequency of bovine lymphocyte antigen DRB3.2 alleles in Jersey cows. J. Dairy Sci. 1999, 82, 2049–2053.
  6. Takeshima, S.; Nakai, Y.; Ohta, M.; Aida, Y. Characterization of DRB3 alleles in the MHC of Japanese Shorthorn Cattle by polymerase chain reaction-sequence-based typing. J. Dairy Sci. 2002, 85, 1630–1632.
  7. Zimin, A.V.; Delcher, A.L.; Florea, L.; Kelley, D.R.; Schatz, M.C.; Puiu, D.; Hanrahan, F.; Pertea, G.; Van Tassell, C.P.; Sonstegard, T.S.; et al. A whole-genome assembly of the domestic cow, Bos taurus. Genome Biol. 2009, 10, R42.
  8. Meredith, B.K.; Kearney, F.J.; Finlay, E.K.; Bradley, D.G.; Fahey, A.G.; Berry, D.P.; Lynn, D.J. Genome-wide associations for milk production and somatic cell score in Holstein-Friesian cattle in Ireland. BMC Genet. 2012, 13, 21.
  9. Zhou, J.; Liu, L.; Chen, C.J.; Zhang, M.; Lu, X.; Zhang, Z.; Huang, X.; Shi, Y. Genome-wide association study of milk and reproductive traits in dual-purpose Xinjiang Brown cattle. BMC Genom. 2019, 20, 827.
  10. Meredith, B.K.; Berry, D.P.; Kearney, F.; Finlay, E.K.; Fahey, A.G.; Bradley, D.G.; Lynn, D.J. A genome-wide association study for somatic cell score using the Illumina high-density bovine beadchip identifies several novel QTL potentially related to mastitis susceptibility. Front. Genet. 2013, 4, 229.
  11. Strillacci, M.G.; Frigo, E.; Schiavini, F.; Samoré, A.B.; Canavesi, F.; Vevey, M.; Cozzi, M.C.; Soller, M.; Lipkin, E.; Bagnato, A. Genome-wide association study for somatic cell score in Valdostana Red Pied cattle breed using pooled DNA. BMC Genet. 2014, 15, 106.
  12. Nani, J.P.; Raschia, M.A.; Poli, M.A.; Calvinho, L.F.; Amadio, A.F. Genome-wide association study for somatic cell score in Argentinean dairy cattle. Livest. Sci. 2015, 175, 1–9.
  13. The Animal Quantitative Trait Loci (QTL) Database. Available online: https://www.animalgenome.org/cgi-bin/QTLdb/BT/index (accessed on 20 May 2021).
  14. Wiggans, G.R.; Shook, G.E. A lactation measure of somatic-cell count. J. Dairy Sci. 1987, 70, 2666–2672.
  15. Interbull. Code of Practice. Available online: https://interbull.org/ib/codeofpractice (accessed on 25 August 2021).
  16. Parker Gaddis, K.L.; Null, D.J.; Cole, J.B. Explorations in genome-wide association studies and network analyses with dairy cattle fertility traits. J. Dairy Sci. 2016, 99, 6420–6435.
  17. Welderufael, B.G.; Løvendahl, P.; de Koning, D.J.; Janss, L.L.G.; Fikse, W.F. Genome-Wide Association Study for Susceptibility to and Recoverability from Mastitis in Danish Holstein Cows. Front. Genet. 2018, 9, 141.
More
Information
Contributor MDPI registered users' name will be linked to their SciProfiles pages. To register with us, please refer to https://encyclopedia.pub/register :
View Times: 470
Revisions: 3 times (View History)
Update Date: 19 Oct 2021
1000/1000
Video Production Service