 +1 credit
| Version | Summary | Created by | Modification | Content Size | Created at | Operation |
|---|---|---|---|---|---|---|
| 1 | Jianwei Shuai | + 1670 word(s) | 1670 | 2021-09-27 08:41:49 | | | |
| 2 | Amina Yu | Meta information modification | 1670 | 2021-10-11 04:30:27 | | |
Video Upload Options
Multiple types of sleep arousal account for a large proportion of the causes of sleep disorders. The detection of sleep arousals is very important for diagnosing sleep disorders and reducing the risk of further complications including heart disease and cognitive impairment. Sleep arousal scoring is manually completed by sleep experts by checking the recordings of several periods of sleep polysomnography (PSG), which is a time-consuming and tedious work. The development of efficient, fast, and reliable automatic sleep arousal detection system from PSG may provide powerful help for clinicians. This paper reviews the automatic arousal detection methods in recent years, which are based on statistical rules and deep learning methods.
1. Introduction
The appearance of sleep arousals (also known as microarousals) reflects the interruption and fragmentation of sleep and is a harbinger of the presence of somnipathy. Frequent microarousals can cause sleep disruption, sleep fragmentation, sleep disorder, aggravating daytime sleepiness, and other symptoms [1]. An increasing amount of evidence indicates that sleep arousals diseases are the concomitant symptoms of other diseases, including weight gain, depression, heart diseases, and diabetes. Therefore, advancing our current understanding of microarousals neurophysiology is not only a challenging research issue but also a public health issue.
Microarousals can also be spontaneous, caused by grinding teeth, partial airway obstruction, or even snoring [2]. A certain amount of spontaneous arousals seems to be an intrinsic part of physiological sleep [3][4], but excessive arousals can disrupt healthy sleep.
Polysomnography (PSG) collects all of the vital signs in a multidimensional time series. The vital signs include electroencephalogram (EEG), electromyography (EMG), electrocardiography (ECG), electrooculography (EOG), blood oxygen saturation level (SaO 2), respiratory airflow (airflow), and respiratory movement (chest ABD). Normal and abnormal brain activities are typically picked up by EEG. Some neuropathic disorders leave their signature on EEG [5][6][7]. PSG is the gold standard for detecting sleep disorders.
The physiological band of interest for PSG signals usually ranges from 0.01 to several hundred cycles per second. The lowest band in conventional EEG studies has a lower limit of 0.5 Hz or 1.0 Hz as the ‘slow frequency’ and ‘sub-slow’ EEG bands, while 100 Hz corresponds to the highest frequency of the EEG band [8][9]. The ECG spectrum is generally considered to be 0.05–100 Hz [10]. Jarvis et al. [11] suggested that ECG frequency associated with sleep apnea can be reduced to 0.02 Hz. EMG ranges from 5.0 Hz to higher frequencies up to 450 Hz [12]. Respiration movements, airflow, and other forms of SaO2 are low-frequency phenomena with activity ranging from 0.05 Hz to 0.35 Hz [13].
2. Micro arousal Detection with Traditional Machine Learning Methods
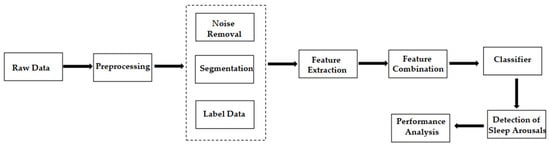
The general workflow in this field is shown in Figure 1 . Data scientists first extract the domain-specific features of PSG signals. Then, they use machine learning methods to classify them into non-arousal and arousal fragments.
Designing hand-made features and then finding the best combination of these features to improve the classifier performance are difficult and time-consuming, because the process requires extensive domain knowledge, such as feature selection or dimensionality reduction techniques. Even so, the automatic detection with manual feature extraction does not guarantee optimal identification for tasks.
Another obstacle for automatic detection with traditional machine learning methods is that the classifier needs to work for many different patients whose signals may have different relevant statistics. Therefore, the same algorithm can produce different results, depending on how its criteria match the data for a particular patient. Table 1 summarizes the different automatic or semi-automatic detection algorithms with wide spread machine learning methods.
| Author (Year) [Reference] | Database | Data Preprocessing | Machine Learning Model | Results |
|---|---|---|---|---|
| Huupponen et al. (1996) [14] | Local dataset | FFT, average power | MLP | Accuracy = 41% |
| Patanerli et al. (1999) [15] | Naya University | Wavelet transform, moving average, filter | SAS software; STEPDISC program | Sensitivity = 88.1%, Selectivity = 74.5% |
| Gouveia et al. (2003) [16] | Local dataset | FFT, frequency analysis | A set of scoring rules | Detection rate = 70% |
| Cho et al. (2005) [17] | South Korea’s Asan Medical Center | Filtering, power spectrum, FFT | SVM | Sensitivity = 75.26%, Specificity = 93.08% |
| Agarwal et al. (2006) [18] | Local dataset (two patients) | Second-order adaptive filter, frequency, MAA, etc. | A set of decisional rules | Sensitivity = 76.15% |
| David et al. (2006) [19] | National Institutes of Health (NIH) Sleep Disorders Research Plan | 1. Bi-directional recursive filtering, 2. peak detection 3. relative trough position |
Passive ballistocardiograph-based system | Sensitivity = 77.3%, Specificity = 96.2% |
| Shmiel et al. (2009) [20] | Aviv’s Assuta Medical Center | FFT, critical points, etc. | Sequential pattern discovery field | Sensitivity = 75.2%, positive predictive value = 76.5% |
| Foussier et al. (2013) [21] | Self-bulit database | HRV, MD, 72 features | Linear mixed mode | MD=1.16, χ2=16,633 |
| Espiritu et al. (2015) [22] | Texas State Sleep Center | Savitzky-Golay filter, energy power/entropy, zero-crossing rate, etc. |
Decision tree | Accuracy = 81.63% |
| Shahrbabaki et al. (2015) [23] | Self-bulit database (6 male, 3 female) |
Butterworth filter, Welch’s algorithm, 32 features |
KNN | Accuracy = 93.6% |
| Wallant et al. (2016) [24] | Self-bulit database (35 healthy volunteers) | PSD, filtering data, segmentation, maximal amplitude, and slope | Adapted thresholds | Sensitivity = 83% |
| Subramanian et al. (2018) [25] | PhysioNet 2018 | 28 features | GLM, RF | Highest AUROC = 0.847, highest AUPRC = 0.630 |
| Ugur et al. (2019) [26] | SHHS | CWT | SVM | Accuracy = 98.2%, positive predictive value = 97.93% |
| Liu et al. (2020) [27] | PhysioNet 2018 | ICA, double density DWT algorithm, FIR filter | CNN with RF | AUPRC = 0.552 |
MLP = multilayer perceptron neural network; SVM = support vector machine; MAA = maximum absolute amplitude; HRV = heart rate variability; RF = random forest; SCL = skin conductance level; GLM = generalized linear model; CWT = continuous wavelet transforms; ICA = independent component correlation algorithm; DWT = discrete wavelet transformation; AUROC = area under the receiver operating characteristic curve; AUPRC = area under the precision-recall curve.
3. Microarousal Detection with Deep Learning Methods
Different from the manual feature extraction, neural networks can automatically learn variations and trends in the signal by carrying out feature extraction procedures through an abstract method. Deep learning methods possess the strong capability to learn complex features by directly applying them to raw data without extracting any hand-crafted features. Only recently have researchers begun to show a preference for deep learning methods, such as CNN [28][29][30][31], ResNet [32], the Siamese architecture network [30], RNN, and LSTM [33][34][35], over traditional machine learning methods in arousal detection.
The CNN makes it easier to extract different features of the input PSG data through convolution kernels. The models using CNN reviewed in this paper are summarized in Table 2 .
| Author (Year) | Database | Preprocessing | Results |
|---|---|---|---|
| Dongya et al. (2018) [28] | PhysioNet 2018 | Welch algorithm | AUPRC = 0.114 |
| Varga et al. (2018) [29] | PhysioNet 2018 | 68 features | AUPRC = 0.42 |
| Patane et al. (2018) [30] | PhysioNet 2018 | Filter, data augmentation | AUPRC =0.40 |
| Miller et al. (2018) [36] | PhysioNet 2018 | - | AUPRC = 0.37 |
| Zabihi et al. (2018) [31] | PhysioNet 2018 | - | AUPRC = 0.31 |
| Olesen et al. (2020) [37] | National Sleep Research Resource | Resampled, baseline model | F1-score = 0.682 |
| Zhou et al. (2020) [38] | PhysioNet 2018 | Re-sample, Fourier transform | AUPRC= 0.39 |
| Jia et al. (2020) [32] | Beijing Tongren Hospital | Down-sampled | Recall = 86.0% |
KSS = Karolinska sleepiness scale, F1-score = harmonic mean of precision and recall.
Common time series models include the RNN, LSTM, and bidirectional LSTM (Bi-LSTM). RNN and LSTM are networks that contain loops to connect previous information to current tasks. The models with LSTM reviewed in this paper are shown in Table 3 and Table 4.
| Author (Year) | Database | Data Preprocessing | AUPRC |
|---|---|---|---|
| Warrick et al. (2018) [34] | PhysioNet 2018 | ST algorithm, logarithmic filters | 0.36 |
| Már Þráinsson et al. (2018) [33] | PhysioNet 2018 | Energy, Hjorth parameters, WPD | 0.45 |
| Kim et al. (2019) [35] | PhysioNet 2018 | MFCC | 0.458 |
ST = scattering transform; WPD = wavelet packet decomposition; MFCC = Mel-Frequency Cepstral Coefficient.
| Author (Year) [Reference] | Database | Data Preprocessing | Model | AUPRC |
|---|---|---|---|---|
| Li et al. (2018) [39] | PhysioNet 2018 | Signal segmentation | CNN+BiLSTM | 0.42 |
| Sridhar et al. (2018) [40] | PhysioNet 2018 | Feature time-series | LSTM | 0.573 |
| Howe-Patterson et al. (2018) [41] | PhysioNet 2018 | FFT, down-sampled | DNN+BiLSTM | 0.54 |
| Warrick et al. (2019) [42] | PhysioNet 2018 | - | ST-LSTM | 0.36 |
| Achuth et al. (2019) [43] | Local dataset | Filters, RF | DNN+LSTM | 0.50 |
Author (Year) [Reference] |
Number of Channels | Model | AUPRC |
|---|---|---|---|
| Sridhar et al. (2018) [40] | 13 | CNN+RNN | 0.573 |
| Howe-Patterson et al. (2018) [41] | 12 | CNN+LSTM | 0.54 |
| Pourbabaee et al. (2019) [44] | 12 | DNN+LSTM | 0.543 |
| Már Þráinsson et al. (2018) [33] | 13 | Bi-LSTM | 0.45 |
| Li et al. (2018) [39] | 13 | DNN+LSTM | 0.43 |
| Varga et al. (2018) [29] | 13 | CNN | 0.42 |
| Patane et al. (2018) [30] | 5 | CNN | 0.40 |
| Miller et al. (2018) [36] | 13 | CNN | 0.36 |
| Warrick et al. (2018) [34] | 13 | RNN | 0.36 |
| Zabihi et al. (2019) [31] | 5 | CNN | 0.31 |
Note: Submitted inside the time frame of the official phase of the 2018 PhysioNet Challenge. AUPRC is for their internal test set and the official blind test set.
4. Automated Detection of CAP
CAP reflects the instability of sleep through EEG, which is accompanied by some dynamic events in the process of sleep (falling asleep, conversion of different sleep periods, and awakening in sleep). It is suggested that when there are external or internal sleep interference factors, the A1 subtype in CAP marks the brain’s efforts to continue to sleep. When sleep becomes increasingly unstable and the brain cannot maintain continuous sleep, EEG arousal will accompany or replace the slow activity with high amplitude. Therefore, A2 and A3 subtypes constitute the arousal of the central nervous system.
Methods for automated detection of CAP are listed in Table 6.
Table 6. Automated detection of CAP
Author(Year) [Reference] |
Database |
Data Preprocessing |
Model |
Results |
Mariani et al. (2012) [45] |
Parma Sleep Disorders Center |
Hjorth activity; EEG variance |
Discriminant classifier |
Accuracy=84.9% |
Chindhade et al. (2018) [46] |
CAP Sleep Database |
Differential moving average |
Logistic regression |
AUROC=0.512;Accuracy = 58% |
Hui et al.(2021) [47] |
CAP Sleep Database |
- |
CNN |
Sensitivity=80.29%;Accuracy = 74.43% |
Mendona et al.(2021) [108] |
CAP Sleep Database |
Lowpass filter |
LSTM |
Accuracy=81.3%;Sensitivity=73.7%;Specificity=81.7% |
5. Conclusion
Reliable diagnosis of arousal is the most essential prerequisite of sleep disorder treatment. The ‘gold standard’ for sleep disorders was developed manually by experienced experts, which is a time consuming and costly process. Accurate automated scoring models could assist doctors to identify medical images faster and more accurately, free doctors from tedious work, and ultimately improve the efficiency of laboratory and home sleep diagnostic methods.
This review showed that deep learning models can complete complex tasks, and are more accurate than traditional machine learning models. Deep learning has the powerful function of learning complex features by directly applying them to original data without extracting any manual features. Because the changes in various physiological parameters usually occur in a period of time before arousal, RNN and LSTM can learn the temporal relation in PSG signals. Therefore, using deep learning methods to detect the features of sleep arousals has become a mainstream trend in the field of PSG signals.
References
- Anonymous. EEG arousals: Scoring rules and examples: A preliminary report from the Sleep Disorders Atlas Task Force of the American Sleep Disorders Association. Sleep 1992, 15, 173.
- Ghassemi, M.; Moody, B.; Lehman, L.-W.; Song, C.; Li, Q.; Sun, H.; Westover, B.; Clifford, G. You Snooze, You Win: The PhysioNet/Computing in Cardiology Challenge 2018. In Proceedings of the 2018 Computing in Cardiology Conference (CinC), Maastricht, The Netherlands, 23–26 September 2018.
- Mathur, R.; Douglas, N.J.S. Frequency of EEG arousals from nocturnal sleep in normal subjects. Sleep 1995, 18, 330–333.
- Boselli, M.; Parrino, L.; Smerieri, A.; Terzano, M.G.J.S. Effect of age on EEG arousals in normal sleep. Sleep 1998, 21, 361–367.
- Kabir, E.; Siuly, S.; Cao, J.; Wang, H. A computer aided analysis scheme for detecting epileptic seizure from EEG data. Int. J. Comput. Intell. Syst. 2018, 11, 663–671.
- Siuly, S.; Li, Y.; Zhang, Y. EEG signal analysis and classification. Health Inf. Sci. 2016, 11, 141–144.
- Diykh, M.; Li, Y.; Wen, P. EEG Sleep Stages Classification Based on Time Domain Features and Structural Graph Similarity. IEEE Trans. Neural Syst. Rehabil. Eng. 2016, 24, 1159–1168.
- Henry, J.C.J.N. Electroencephalography: Basic principles, clinical applications, and related fields. Neurology 2006, 67, 2092.
- Hiltunen, T.; Kantola, J.; Abou Elseoud, A.; Lepola, P.; Suominen, K.; Starck, T.; Nikkinen, J.; Remes, J.; Tervonen, O.; Palva, S. Infra-slow EEG fluctuations are correlated with resting-state network dynamics in fMRI. J. Neurosci. 2014, 34, 356–362.
- Clifford, G.D.; Azuaje, F.; McSharry, P. Advanced Methods and Tools for ECG Data Analysis; Artech House Boston: Norwood, MA, USA, 2006.
- Jarvis, M.; Mitra, P. Apnea patients characterized by 0.02 Hz peak in the multitaper spectrogram of electrocardiogram signals. In Proceedings of the Computers in Cardiology 2000. Vol.27 (Cat. 00CH37163), Cambridge, MA, USA, 24–27 September 2000; Volume 27, pp. 769–772.
- Viitasalo, J.H.; Komi, P.V. Signal characteristics of EMG during fatigue. Eur. J. Appl. Physiol. Occup. Physiol. 1977, 37, 111–121.
- Nino, C.L.; Rodriguez-Martinez, C.E.; Gutierrez, M.J.; Singareddi, R.; Nino, G. Robust spectral analysis of thoraco-abdominal motion and oxymetry in obstructive sleep apnea. In Proceedings of the 2013 35th Annual International Conference of the IEEE Engineering in Medicine and Biology Society (EMBC), Osaka, Japan, 3–7 July 2013; pp. 2906–2910.
- Huupponen, E.; Vaerri, A.; Hasan, J.; Saarinen, J.; Kaski, K. Sleep arousal detection with neural network. In Medical & Biological Engineering & Computing, Proceedings of the 1st International Conference on Bioelectromagnetism; Tampere, Finland, 9–13 June 1996, Volume 34, pp. 219–220.
- De Carli, F.; Nobili, L.; Gelcich, P.; Ferrillo, F. A Method for the Automatic Detection of Arousals During Sleep. Sleep 1999, 22, 561–572.
- Gouveia, P.; Oliveira, R.; Rosa, A. Sleep apnea related micro-arousal detection with EEG analysis. In Proceedings of the BioEng 2003 7th Portuguese Conference on Biomedical Engineering, Lisbon, Portugal, 15 April 2003.
- Cho, S.; Lee, J.; Park, H.; Lee, K. Detection of arousals in patients with respiratory sleep disorders using a single channel EEG. In Proceedings of the 2005 IEEE Engineering in Medicine and Biology 27th Annual Conference, Shanghai, China, 17–18 January 2006; pp. 2733–2735.
- Agarwal, R. Automatic detection of micro-arousals. In Proceedings of the 2005 IEEE Engineering in Medicine and Biology 27th Annual Conference, Shanghai, China, 2 September 2005; pp. 1158–1161.
- Mack, D.C.; Alwan, M.; Turner, B.; Suratt, P.; Felder, R.A. A passive and portable system for monitoring heart rate and detecting sleep apnea and arousals: Preliminary validation. In Proceedings of the 1st Transdisciplinary Conference on Distributed Diagnosis and Home Healthcare, 2006, D2H2, Arlington, VA, USA, 2–4 April 2006; pp. 51–54.
- Shmiel, O.; Shmiel, T.; Dagan, Y.; Teicher, M. Data mining techniques for detection of sleep arousals. J. Neurosci. Methods 2009, 179, 331–337.
- Foussier, J.; Fonseca, P.; Long, X.; Misgeld, B.; Leonhardt, S. Combining HRV features for automatic arousal detection. In Proceedings of the Computing in Cardiology, Zaragoza, Spain, 22–25 September 2013.
- Espiritu, H.; Metsis, V. Automated detection of sleep disorder-related events from polysomnographic data. In Proceedings of the International Conference on Healthcare Informatics, Dallas, TX, USA, 21–23 October 2015; pp. 562–569.
- Shahrbabaki, S.S.; Dissanayaka, C.; Patti, C.R.; Cvetkovic, D. Automatic detection of sleep arousal events from polysomnographic biosignals. In Proceedings of the 2015 IEEE Biomedical Circuits and Systems Conference (BioCAS), Atlanta, GA, USA, 22–24 October 2015; pp. 1–4.
- Wallant, D.C.T.; Muto, V.; Gaggioni, G.; Jaspar, M.; Phillips, C. Automatic artifacts and arousals detection in whole-night sleep EEG recordings. J. Neurosci. Methods 2016, 258, 124–133.
- Subramanian, S.; Chamadia, S.; Chakravarty, S. Arousal Detection in Obstructive Sleep Apnea using Physiology-Driven Features. In Proceedings of the 2018 Computing in Cardiology Conference, Maastricht, The Netherlands, 23–26 September 2018.
- Ugur, T.K.; Erdamar, A. An efficient automatic arousals detection algorithm in single channel EEG. Comput. Methods Programs Biomed. 2019, 173, 131–138.
- Liu, Y.; Liu, H.; Yang, B.J.I.A. Automatic Sleep Arousals Detection From Polysomnography Using Multi-Convolution Neural Network and Random Forest. IEEE Access 2020, 8, 176343–176350.
- Dongya, J.; Yu, S.; Yan, C.; Zhao, W.; Hu, J.; Wang, H.; You, T. Deep Learning with Convolutional Neural Networks for Sleep Arousal Detection. In Proceedings of the 2018 Computing in Cardiology Conference (CinC), Maastricht, The Netherlands, 23–26 September 2018.
- Varga, B.; Görög, M.; Hajas, P. Using Auxiliary Loss to Improve Sleep Arousal Detection With Neural Network. In Proceedings of the 2018 Computing in Cardiology Conference (CinC), Maastricht, The Netherlands, 23–26 September 2018.
- Patane, A.; Ghiasi, S.; Pasquale Scilingo, E.; Kwiatkowska, M. Automated Recognition of Sleep Arousal Using Multimodal and Personalized Deep Ensembles of Neural Networks. In Proceedings of the 2018 Computing in Cardiology Conference (CinC), Maastricht, The Netherlands, 23–26 September 2018.
- Zabihi, M.; Rad, A.B.; Kiranyaz, S.; Särkkä, S.; Gabbouj, M. 1D convolutional neural network models for sleep arousal detection. arXiv 2019, arXiv:1903.0155.
- Jia, Z.; Wang, X.; Zhang, X.; Xu, M. Automatic Arousal Detection Using Multi-model Deep Neural Network. In Proceedings of the 2020 5th International Conference on Computer and Communication Systems (ICCCS), Shanghai, China, 15–18 May 2020.
- Már Þráinsson, H.; Ragnarsdóttir, H.; Fannar Kristjansson, G.; Marinósson, B.; Finnsson, E.; Gunnlaugsson, E.; Ægir Jónsson, S.; Skírnir Ágústsson, J.; Helgadóttir, H. Automatic Detection of Target Regions of Respiratory Effort-Related Arousals Using Recurrent Neural Networks. In Proceedings of the 2018 Computing in Cardiology Conference (CinC), Montreal, QC, Canada, 20–24 July 2020.
- Warrick, P.; Homsi, M.N. Sleep arousal detection from polysomnography using the scattering transform and recurrent neural networks. In Proceedings of the 2018 Computing in Cardiology Conference (CinC), Maastricht, The Netherlands, 23–26 September 2018; pp. 1–4.
- Kim, H.; Jun, T.J.; Nguyen, G.; Kim, D. Bidirectional LSTM with MFCC Feature Extraction for Sleep Arousal Detection in Multi-channel Signal Data. In ICONIP 2019: Neural Information Processing; Springer: Berlin/Heidelberg, Germany, 2019; pp. 442–453.
- Miller, D.; Ward, A.; Bambos, N. Automatic sleep arousal identification from physiological waveforms using deep learning. In Proceedings of the 2018 Computing in Cardiology Conference (CinC), Maastricht, The Netherlands, 23–26 September 2018; pp. 1–4.
- Olesen, A.N.; Jennum, P.; Mignot, E.; Sorensen, H.B.D. Deep transfer learning for improving single-EEG arousal detection. In Proceedings of the 2020 42nd Annual International Conference of the IEEE Engineering in Medicine & Biology Society (EMBC), Montreal, QC, Canada, 20–24 July 2020; pp. 99–103.
- Zhou, G.; Li, R.; Zhang, S.; Wang, J.; Ma, J. Multimodal Sleep Signals-Based Automated Sleep Arousal Detection. IEEE Access 2020, 8, 106157–106164.
- He, R.; Wang, K.; Liu, Y.; Zhao, N.; Yuan, Y.; Li, Q.; Zhang, H. Identification of Arousals With Deep Neural Networks Using Different Physiological Signals. In Proceedings of the 2018 Computing in Cardiology Conference (CinC), Maastricht, The Netherlands, 23–26 September 2018.
- Sridhar, N.; Shoeb, A. Evaluating Convolutional and Recurrent Neural Network Architectures for Respiratory-Effort Related Arousal Detection during Sleep. In Proceedings of the 2018 Computing in Cardiology Conference (CinC), Maastricht, The Netherlands, 23–26 September 2018.
- Howe-Patterson, M.; Pourbabaee, B.; Benard, F. Automated Detection of Sleep Arousals From Polysomnography Data Using a Dense Convolutional Neural Network. In Proceedings of the 2018 Computing in Cardiology Conference, Maastricht, The Netherlands, 23–26 September 2018.
- Warrick, P.A.; Lostanlen, V.; Nabhan Homsi, M. Hybrid scattering-LSTM networks for automated detection of sleep arousals. Physiol. Meas. 2019, 40, 074001.
- Achuth, R.M.V.; Ghosh, P.K.; Bhattacharjee, T.; Choudhury, A.D. Trend Statistics Network and Channel invariant EEG Network for sleep arousal study. In Proceedings of the 2019 41st Annual International Conference of the IEEE Engineering in Medicine & Biology Society (EMBC), Berlin, Germany, 23–27 July 2019.
- Pourbabaee, B.; Patterson, M.H.; Patterson, M.R.; Benard, F. SleepNet: Automated sleep analysis via dense convolutional neural network using physiological time series. Physiol. Meas. 2019, 40, 084005.
- Mariani, S.; Manfredini, E.; Rosso, V.; Grassi, A.; Mendez, M.O.; Alba, A.; Matteucci, M.; Parrino, L.; Terzano, M.G.; Cerutti, S. Efficient automatic classifiers for the detection of A phases of the cyclic alternating pattern in sleep. Med. Biol. Eng. Comput. 2012, 50, 359–372.
- Chindhade, A.; Alshi, A.; Bhatia, A.; Dabhadkar, K.; Menon, P.S. A machine learning model for identifying cyclic alternating patterns in the sleeping brain. arXiv 2018, arXiv:1804.08750.
- Hui, W.L.; Ooi, C.P.; Dhok, S.G.; Sharma, M.; Acharya, U.R. Automated detection of cyclic alternating pattern and classification of sleep stages using deep neural network. Appl. Intell. 2021, 1–15.

