 +1 credit
| Version | Summary | Created by | Modification | Content Size | Created at | Operation |
|---|---|---|---|---|---|---|
| 1 | Célia M. Silveira | + 4104 word(s) | 4104 | 2021-08-17 05:24:35 | | | |
| 2 | Célia M. Silveira | Meta information modification | 4104 | 2021-10-06 12:31:10 | | |
Video Upload Options
Vibrational spectroscopy and in particular, resonance Raman (RR) spectroscopy can provide molecular details on metalloproteins, including those containing multiple cofactors, which are often challenging for other spectroscopies. Due to distinct spectroscopic fingerprints, RR spectroscopy has a unique capacity to monitor simultaneously and independently different metal cofactors that can have particular roles in metalloproteins. These include e.g., (i) different types of hemes, as well as their spin and redox states, (ii) different types of Fe-S clusters, and (iii) bi-metallic center and electron transfer (ET) Fe-S cluster in hydrogenases. IR spectroscopy can provide un-matched molecular details on specific enzymes like hydrogenases that possess catalytic centers coordinated by CO and CN- ligands, which exhibit spectrally well separated IR bands.
1. Introduction
Vibrational spectroscopy has, over the past couple of decades, provided valuable information on structure – function relationship in metalloproteins, contributing to the elucidation of molecular mechanisms, dynamics and interactions on the level that goes beyond high resolution crystallographic structures. It does not depend on size or paramagnetic properties of the protein like nuclear magnetic resonance (NMR) and electron paramagnetic resonance (EPR) spectroscopies, and furthermore, it can be coupled with electrochemical methods and employed in time-resolved mode, offering the possibility to probe redox and transient molecular events down to femto-second time scale.[1]
1.1 Resonance Raman and surface-enhanced (resonance) Raman spectroscopy
In the case of metalloproteins, the intrinsically low sensitivity and the selectivity of Raman spectroscopy are strongly increased when the energy of the incident laser light is in resonance with an electronic transition of the chromophore. The resultant resonance Raman (RR) spectra display several orders of magnitude higher intensity for the vibrational modes of the cofactor, regardless of the size of the protein matrix.[1] RR spectroscopic studies have mainly focused onto metalloproteins containing iron and copper ions, but they have also been reported for other transition metals like nickel, cobalt and molybdenum.[2][3][4][5] In particular, the studies of heme and non-heme iron, iron-sulfur cluster and copper center containing metalloproteins have provided a wealth of details on their active sites, hence contributing to understanding of their mechanistic properties.
RR spectra of heme proteins obtained upon Soret-band excitation are, in the high frequency (1300–1700 cm-1) region, dominated by the core-size marker bands νi (ν4, ν3, ν2 and ν10) originating from complex porphyrin vibrations that are sensitive to the redox, spin, and coordination state of the heme iron (Figure 1 and Table 1). The spectral distinction between LS and HS heme populations is therefore straightforward in RR spectra, which has helped addressing e.g., processes at catalytic HS vs. electron transfer (ET) LS hemes in oxygen and nitrite reductases and the activation mechanism of cytochrome c peroxidases (CcPs).[6][7][8][9] Similarly the capacity of RR spectroscopy to distinguish between ferric and ferrous heme populations contributed to disentangling of the ET processes in numerous metalloproteins, as well as those that involve semi-reduced forms of Complex III and dihemic bacterial CcPs.[9][10]
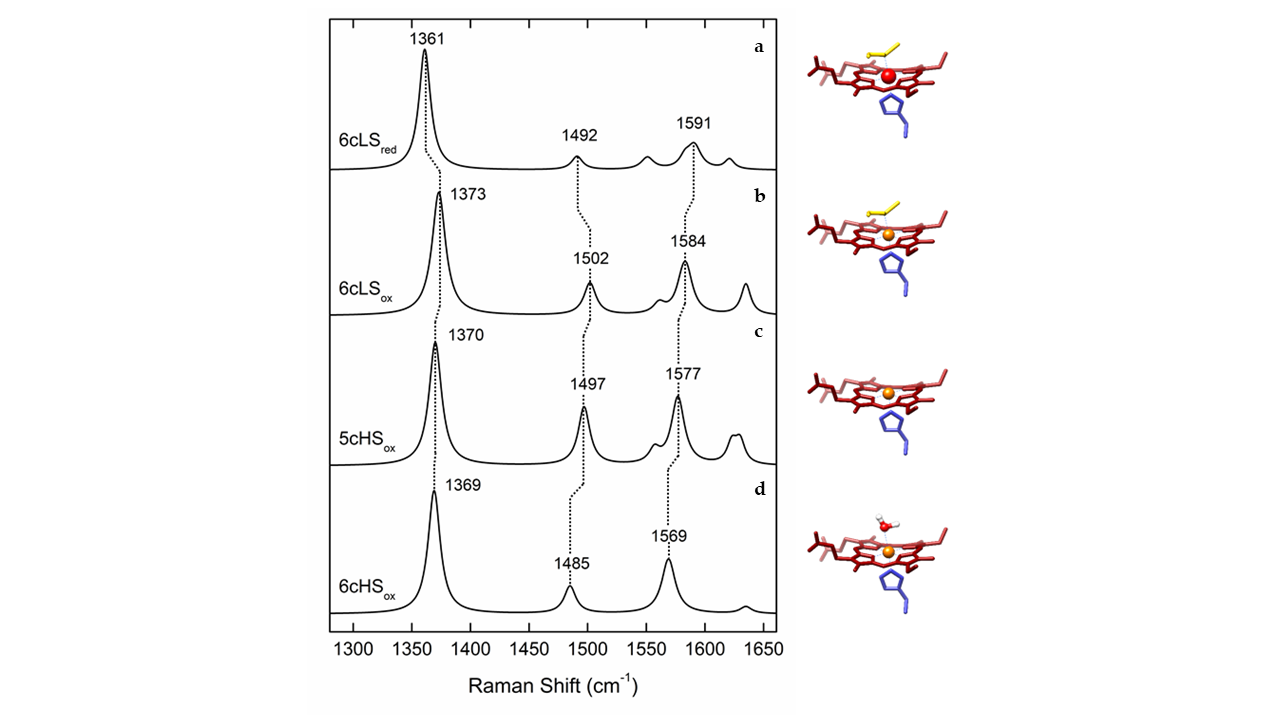
Figure 1. Simulated Resonance Raman (RR) spectra of different oxidation, spin and coordination states of cytochrome c, with depicted marker bands, left and corresponding heme configurations, right. (a) Ferrous (Fe2+) heme in low spin (LS) state, coordinated by distal methionine and proximal histidine (6cLS). (b) Ferric (Fe3+) heme in 6cLS state, coordinated by distal methionine and proximal histidine. (c) Ferric heme in a high spin (HS) state, coordinated by proximal histidine and vacant 6th axial position (5cHS). (d) Ferric heme in 6cHS state, coordinated by a distal water molecule and proximal histidine.
Table 1. Frequencies of characteristic (resonance) Raman and IR active vibrational modes of metalloprotein cofactors. Heme proteins - typical frequency range of the marker bands (νi) of ferric and ferrous His/Met and His/- coordinated c-type heme in RR spectra. Iron-sulfur proteins - typical frequency range of predominantly bridging (b) and terminal (t) Fe-S RR modes for different cluster types. Hydrogenases - typical frequency regions of IR and RR bands for metal bound CO and CN ligand vibrations.
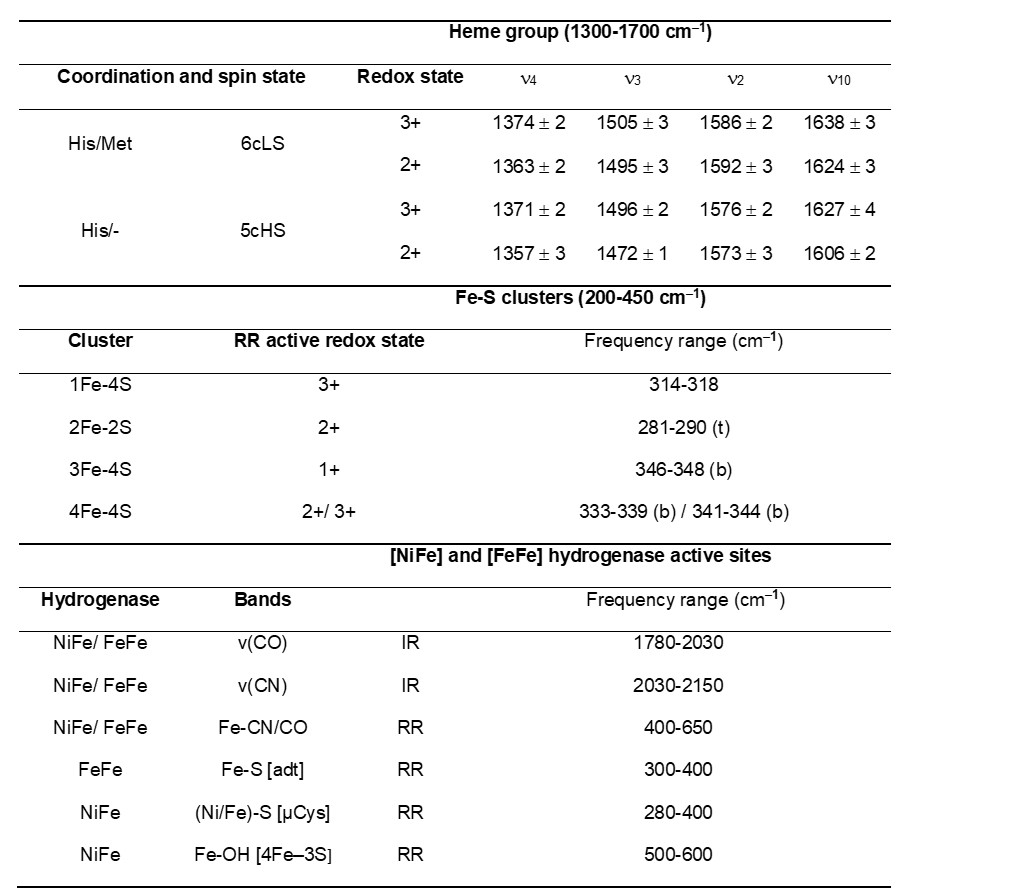
RR spectra of Fe-S cluster containing proteins, obtained with a laser wavelength that matches the energy of S → Fe charge transfer transitions, show selectively enhanced modes involving the metal–ligand stretching coordinates in the low-frequency (200–450 cm−1) region (Table 1). The spectra are sensitive to the cluster type, structure and symmetry and moreover allow for distinguishing between bridging vs. terminal Fe-S vibrational modes that involve inorganic and cysteine bound S atom in each cluster, respectively.[11] Unlike in the case of heme proteins, in Fe-S proteins only one redox state is usually RR active; [2Fe–2S]2+, [3Fe–4S]1+ and [4Fe–4S]2+ (and [4Fe–4S]3+ in HiPIPs). RR spectroscopy can simultaneously probe different types of clusters present in the same protein, alongside with process that account for their interconversion.[11]
Large enhancements of Raman signals are obtained by measuring the spectra of molecules in close proximity to plasmonic metals (e.g. Ag and Au), due to the surface enhanced Raman (SER) scattering effect.[1] Accordingly, SER spectroscopy can provide sensitive (bio)chemical information about the studied system, and is therefore viewed as a promising analytical tool for e.g. medical diagnostics.[12][13][14] The combination of the SER and RR effects (SERR spectroscopy) enables further enhancement of the signal by selectively probing the chromophoric part of molecule attached to SER active metal surfaces.[1] SERR spectroscopy can provide specific molecular information about proteins that perform their physiological function in the immobilized state (e.g. membrane proteins). The nanostructured metal that amplifies the signals can serve as a working electrode, allowing for spectro-electrochemical SERR studies capable of monitoring the changes of the heme group as a consequence of variations of the electrode potential.[1][15]
1.2 Infrared (IR) and surface-enhanced IR absorption spectroscopy
Infrared (IR) spectroscopy most commonly provides information on the secondary structure of proteins based on the analysis of the amide I (1600–1700 cm-1) and amide II (1480–1580 cm-1) bands.[1] However, when measured in the difference mode, IR spectra can probe structural changes of individual cofactors and sensitively detect redox-linked structural changes, protonation events or amino acids and specific groups upon isotopic labeling (e.g. 13C and 15N labeled heme).[16] Analogous to SERR, surface enhanced infrared absorption (SEIRA) spectroscopy probes protein molecules that are found in the vicinity of nanostructured metal surfaces deposited on a transmission window or an inert ATR (attenuated total reflection) crystal, experiencing an enhanced absorption of the incident IR radiation. SEIRA can be used to control the protein attachment and orientation at the biocompatible surface upon immobilization, but more importantly it can also provide fine details about redox-linked changes of the secondary structural elements when employed in spectro-electrochemical mode (vide supra).[1][15] For certain metalloenzymes, where the active site harbors ligands that possess spectrally isolated IR absorption bands, such as hydrogenases that contain bimetallic catalytic centers with unusual CO and CN- ligands, IR (transmission) spectroscopy and its surface sensitive variants offer unique insights in the redox behavior of the catalytic center.[17]
2. Heme Proteins
2.1. Nitrite reductases (NiR)
NrfHA menaquinol: nitrite oxidoreductase complex catalyzes the six-electron reduction of nitrite to ammonia in a reaction that involves eight protons. It houses a total of 28 heme groups in the biological unit and, as such, represents a challenge for every experimental approach. 22 of heme groups have 6cLS and 6 have 5cHS configuration; two of the HS hemes are membrane-integrated and the other four represent catalytic sites. The HS and LS hemes can be easily distinguished in the RR spectra of NrfHA, with redox sensitive ν4 and redox/spin state sensitive ν3 modes of the HS species at 1366 and 1493 cm-1, and of the LS at 1373 and 1501 cm-1, allowing for independent monitoring of the processes that involve these two populations. Binding of nitrite to the catalytic HS hemes and the resulting spin configuration of the initial enzyme / substrate complex have profound consequences for the reaction mechanism of nitrite reduction, indicating whether the N-O bond cleavage follows homolytic or heterolytic route, and the subsequent steps of the catalytic cycle. RR data have provided the first experimental evidence that nitrite binding to NrfHA active site HS hemes causes a spin conversion from HS to LS configuration, which implies that the heterolytic cleavage of the N-O bond is favored in the first step of the catalytic reaction.[18]
SERR spectro-electrochemistry helped disentangle the ET pathway in NrfHA. Potentiometric titrations of NrfHA immobilized on biocompatible Ag electrode, followed by the analysis of the ν4 band of the HS hemes provided the redox potentials of the catalytic and the non-catalytic HS centers, revealing the first evidence for the downhill biological electron flow in the integral NrfHA.[6]
2.2. Heme containing respiratory chain and analogous complexes
Complex III (ubiquinol : cyt c oxidoreductase or bc1 complex) catalyzes the transfer of two electrons from ubiquinol to two cyt c molecules. bc1 complexes are formed by a minimum of three subunits; one contains a c1-type heme (or structurally and functionally analogous cytochrome f in plants, cyanobacteria and green algae that house cytochrome b6f complex), one holds a Rieske type [2Fe–2S] cluster, and the third one contains two LS b-type hemes, designated bL and bH.[10] RR spectroscopy has been employed in the initial characterization of heme groups of the complex at different stages of reduction. Namely, due to the differences in midpoint redox potentials of the heme c1, low potential heme b (bL) and high potential heme b (bH), it is possible to selectively reduce the higher potential sites (heme c1 and bH). A selective resonance enhancement using multiple excitation lines and sequential stoichiometric reduction of the complex allowed for spectral distinction between the c and b-type hemes, providing insights into the differences in peripheral heme-protein interactions, and in particular to the conformation of vinyl substituents of the pyrrole rings.[10]
RR spectra of cyt c1 and cyt f containing subunits of bc1 and b6f complexes employing Q-band (550 nm) excitation effectively probe the respective local heme environments of these sites, indicating remarkably similar macrocycle geometry of the two hemes.[19] Cyt b6f participates in the oxygenic photosynthesis as a redox link between the two reaction center complexes. RR spectroscopy initially helped identify the chromophoric groups in b6f complexes isolated from different species, revealing a presence of chlorophyll a, β-carotene and an additional 5cHS c1-type heme.[20][21] A functional analogue to bc1 complex carrying two b- and one a-type heme was found in an archaeon. RR spectroscopy helped characterize the three heme groups in this enzyme that shows bc1 complex activity.[22]
IR difference spectroscopic studies of bc1 complex and more recently, ATR-IR spectroscopy of thin layers of bovine bc1 complex that have been deposited on the surface of a silicon microprism revealed redox-induced structural changes in these enzymes. Redox-sensitive IR absorption bands in the potential-induced difference spectra of c1, bH and bL hemes, ubiquinone and surrounding protein were identified upon separation by selective reduction. A similar approach was used to probe the [2Fe–2S] cluster of the complex.[23][24][25]
Oxygen reductase - Complex IV (cyt c : oxygen oxidoreductase, CcO, or heme copper oxygen reductase, or heme copper oxidase, HCO) catalyzes the reduction of molecular oxygen to water by utilizing four electrons and four protons. This is one of the most fundamental reactions in living organisms. HCOs pump protons from the N to the P side of the membrane, contributing to the generation of transmembrane electrochemical potential, which drives the ATP synthesis.[26] The catalytic reaction occurs at a binuclear center formed by a HS heme (e.g. heme a3 in mitochondrial enzyme, here designated as CcO) and a copper atom (CuB). The ET to the binuclear center is mediated by a LS heme group in the catalytic subunit (heme a in CcO) and a copper center in the non-catalytic subunit, which is composed of two copper atoms (CuA) that hold one redox equivalent. The number of non-catalytic subunits and their cofactors vary in HCOs. Bacteria and archaea have complexes that are simpler than the mammalian CcO, and if required, the expression of the appropriate HCO (e.g. aa3-, cbb3- or ba3- type) can be fine-tuned as a function of oxygen levels in the environment. RR spectroscopy played a fundamental role in identification and description of the cofactors in these enzymes, such as the type and spin, oxidation and coordination state of the heme groups in structurally diverse HCOs of different origin [27][28][29][30][31] as well as interactions, conformations and the dynamics of small ligand (CO, CN-, N3, NO) binding.[32][33][34][35][36][37][38] The low frequency region of RR spectra has provided unprecedented details on (i) mechanistic properties of HCOs, including detection and identification of the short living catalytic intermediates formed upon oxygen binding to the catalytic HS heme (i.e. a3, b3, o3) and (ii) molecular environment and conformation of the catalytic site, based on correlation of Fe-CO and Fe-C-O stretching mode frequencies of HS heme-CO adduct.[39][40]
Reduced HCOs bind molecular oxygen via formation of short living A, P, F, and H intermediates,[41] which were initially only tentatively described by electronic absorption spectroscopy. RR experiments performed independently by the groups of Kitagawa, Rousseau and Babcock led to a consistent mechanistic model of HCOs, employing isotopic labeling, mutagenesis studies, a number of structurally different HCOs and individually developed TR RR experimental approaches.[26][41][42][43][44][45] In particular, iron-oxygen stretching frequencies obtained by TR RR 16O2 -18O2 difference spectra, measured in H2O and D2O media, helped identifying proton coupled ET reactions and established structural fingerprints of each catalytic intermediate. A presence of a-type hemes in some HCOs offers further advantages as the effect of mutations and other molecular perturbations can be monitored via porphyrin formyl stretching C=O modes, which are well resolved in RR spectra of both ferrous HS and LS hemes at 1661 and 1628 cm-1, respectively.[46]
IR difference spectroscopy recorded under steady state conditions and in the TR mode identified protonation/deprotonation and re-protonation events during the catalytic cycle of aa3-type HCO. The IR data in particular point out the role of a proton shuttle of glutamic acid found at ~ 11 Å from the active site, which changes its protonation state a number of times during the catalytic cycle. The role of the Tyr, located in the proximity of the binuclear center, in the splitting of the O-O bond during the catalysis was also highlighted by IR spectroscopy.[41]
More recently, SERR spectroscopy has provided a novel platform for investigations of HCOs under conditions that can mimic some basic features of their natural environment. Since these enzymes exert their function integrated into a phospholipid bilayer under i) restricted mobility, ii) directionalized ET from electron donor to LS heme and binuclear site and iii) influence of strong interfacial electric fields, the immobilization onto biocompatible electrodes mimics far better these conditions than the solution studies.[47] Furthermore, SERR potentiometric titrations represent a powerful alternative to common methods for the determination of the E0 value, which is a prerequisite for understanding the ET pathway in these enzymes. The determination of E0 of the individual heme groups in HCOs by conventional electronic absorption titrations is hampered by strong overlapping of the spectra of individual hemes and by complex cooperative effects that modulate the electroprotonic energy transduction.[47] Deconvolution of the (SE)RR spectra of aa3-type quinol oxidase (aa3 QO) by component analysis allowed separation of the contributions from the LS and the HS hemes based on their respective ν3 and νC=O modes, among over 40 vibrational modes originating from the two hemes.[47] The potential dependence of these spin and redox-state sensitive marker bands allowed for determined midpoint potentials of hemes a (E0 = 320 mV vs. NHE) and a3 (E0 = 390 mV vs. NHE), which reveal a reversed order of reduction compared to mitochondrial-like HCOs. This suggests a distinct mechanism of electroprotonic energy transduction in aa3 QO in comparison with e.g. CcO. A downhill ET is already guaranteed by the order of the midpoint potentials at the onset of enzyme reduction, indicating that this enzyme does not require a complex network of cooperativities to ensure exergonicity. SERR studies of redox properties of aa3-type and a more complex, pentahemic cbb3-type HCOs employed enzymes anchored to nanostructured Ni-NTA coated Ag electrodes and further embedded into lipid bilayer. This strategy allows for even better mimicking of the natural membrane together with the control of the enzyme orientation that can be probed via SEIRA spectroscopy.[48][49][50][51] SERR analysis focusing onto the protonation dependent CH2 propionate bending modes, detected by H2O - D2O (SE)RR difference spectroscopy, supported the hypothesis that heme a3 propionates act as possible proton loading sites in HCOs.[52]
IR difference spectroscopy was employed to specifically probe the heme propionate protonation events using a CcO mutant with 13C labeled propionates to distinguish its signal from possible concomitant changes of CO stretching modes of other carboxylic acids side chains.[16] Differential IR spectra, employing isotopically labeled ligands or different redox states of the protein (e.g. oxidized minus reduced), provided further structural details on active site conformations in HCOs and specific protonatable sites.[53][54] Step-scan IR spectroscopy, using CuB-CO adduct as a probe, showed that the protonation events in the binuclear site of ba3-type HCO involve Tyr residues.[55] Moreover, electrochemical redox titrations of aa3- and caa3-type HCOs, performed using IR spectroscopy in the transmission and the ATR mode, helped identify the redox sensitive bands, originating from heme groups, their ligands, amino acid residues and/or protein backbone.[23][53][56]
Nitric oxide reductase (NOR) catalyzes the two electron reduction of NO to N2O at the di-nuclear heme b3-FeB center. Similarly to the active site of a HCO, the heme b3 is in the HS state, while FeB is a non-hemic iron atom. NORs in addition house c-type and b-type LS hemes. RR spectroscopy provided evidence about NO reduction by monitoring the events that occur upon NO binding to catalytic b3-type heme. Specifically, formation of the N-N bond and the fate of proximal His-heme b3 bond along this process, as well as the recovery of the b3-O-FeB state, have been disentangled by RR spectroscopy.[57]
3. Fe-S proteins
3.1. Hydrogenases
Hydrogenases catalyze the reversible splitting of molecular dihydrogen (H2) into protons and electrons (or hydride species), often with high catalytic rates, and can be classified into [NiFe], [FeFe], and [Fe]-hydrogenases depending on the particular metal composition of their catalytic centers.[58] These metalloenzymes have been extensively studied in recent years revealing new insights on the mechanistic details of the H2 splitting, which are regarded as benchmarks for the development of biomimetic and bioinspired catalysts for H2 production and/or uptake.[59] In this context, vibrational spectroscopy has greatly contributed to the understanding of hydrogenases, targeting inorganic cofactors, such as the particular catalytic site and Fe-S cluster relays, as well as organic protein cofactors (e.g. FAD and FMN) and certain adjacent protein residues (e.g. cysteine, glutamate) all involved in the biological H2 conversion.[60] Thereby, IR spectroscopy has played a major role in the characterization of these enzymes, which is related to the presence of the unusual inorganic carbon monoxide (CO) and cyanide (CN–) ligands coordinated to the particular active sites (Figure 2a, Table 1) that exhibit characteristic IR bands in a spectral region free of other protein absorptions. Noteworthy, the specific band position of the CO (1780 – 2030 cm–1) and CN (2030 – 2150 cm–1) stretching modes (Figure 2b) are particularly sensitive to changes of the local protein environment, oxidation states of the metal centers, as well as external perturbations induced by changes of temperature and pH.[61][62] Solution IR spectro-electrochemical studies[63] were thus extremely helpful for the structural and electronic characterization of the different redox states, providing key insights in the catalytic mechanism. Briefly, the [NiFe]-hydrogenase catalytic cycle comprises four intermediates, i.e. Nia-S, Nia-L, Nia-C and Nia-SR differing in the oxidation state of nickel (Ni1+/2+/3+) while iron retains a Fe2+ LS configuration throughout the entire catalytic cycle. In the [FeFe]-hydrogenase catalytic cycle, the di-iron center, 2FeH, has been isolated in a variety of intermediates, some of which are well understood (Hox, Hred/HredH+, Hhyd) while other presumed intermediates (Hred´H, Hsred, HhydH+, HoxH+) are still matter of intense discussion.[64][65] For understanding the assignment of the catalytic competency of hydrogenase intermediates, a number of studies employing ATR-FTIR[66] and SEIRA,[67] both under the control of gas atmosphere or/and potential, photogating with time-resolved IR spectroscopy,[68] and protein film IR electrochemistry (PFIRE)[69] have been performed.
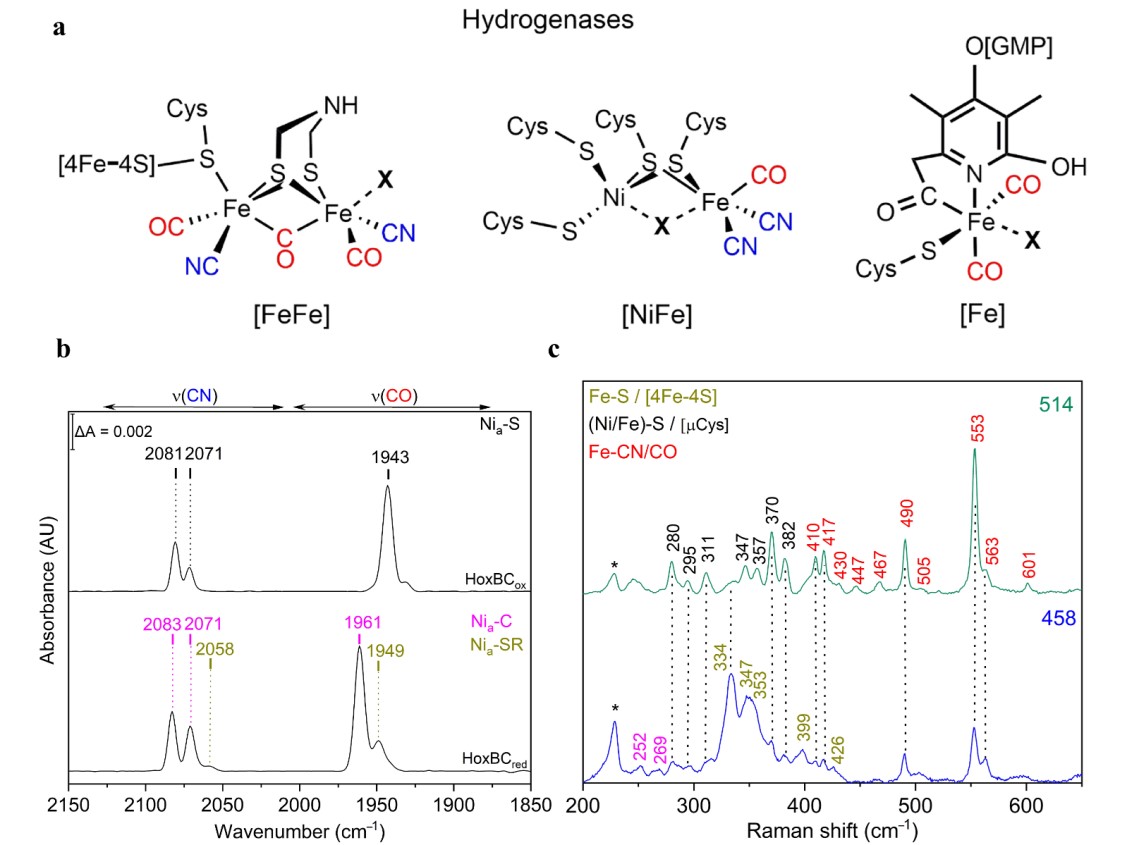
Figure 2. (a) Schematic representation of the active sites of [NiFe]-, [FeFe]- and [Fe]-hydrogenase. In [NiFe]-hydrogenases, the nickel ion is coordinated by four cysteine residues, two of which are shared with the iron ion. One CO and CN– ligands complete the coordination sphere of the iron. In [FeFe]-hydrogenases, the catalytic center is the H-cluster comprising a di-iron (2FeH) and a [4Fe–4S]H site sharing a cysteine coordination. Each iron of the 2FeH is coordinated by one CN– and one CO ligand. A bridging CO and an azadithiolate ligand complete the [2Fe]H coordination. In [Fe]-hydrogenases, the single iron is coordinated by two CO ligands, a cysteine thiolate and a guanylyl pyridinol cofactor bound to the iron via its acyl-carbon and pyridinol-nitrogen. Substrates and inhibitors bind at the coordination site marked by X. (b) IR spectra of as-isolated (top trace, Nia-S intermediate) and H2-reduced (bottom, Nia-C and Nia-SR intermediates) RH (HoxBC) at 283 K displaying the ligand stretching vibrations of the CO and CN− ligands of the active site, located between 1890−2000 cm−1 and 2030−2120 cm−1, respectively. (c) Low temperature RR spectra at 80 K of the regulatory [NiFe] hydrogenase (RH) recorded with excitation at 458 (blue trace) and 514 (green trace) nm in its as-isolated form. Color code of various metal ligand vibrations: Fe-CN/CO (red); Ni/Fe-S of bridging cysteines (black); Fe-S of [4Fe-4S] clusters (dark yellow).
Recently, ultrafast pump-probe and two-dimensional (2D) IR provided novel insights into the dynamic interactions between the hydrogenase CO/CN- ligands and the complex interplay between the [NiFe] site and the protein scaffold.[70] Apart from the distinct CO and CN- markers bands, IR spectroscopy has also unveiled the participation of protein residues in the stabilization of certain intermediates. Combined IR difference spectroscopy and hydrogen/deuterium (H/D) isotopic labeling, allowed for direct monitoring of the changes in the protonation state of conserved glutamate and arginine residues in both [NiFe] and [FeFe] hydrogenases.[71] Noteworthy, the IR detection of S–H/S–D stretching bands at 2505 cm–1 and 1822 cm–1, respectively, confirmed the protonation of a Ni-bound cysteine in the Nia-L intermediate.
Additional mechanistic understanding of hydrogenases has been derived from RR spectroscopy that enables the detection of multiple protein cofactors. RR spectra of the F-420 [NiFe]-hydrogenase revealed the spectral contributions of FAD, Fe-S clusters, and the [NiFe] active site.[72] Notably, 458 nm laser excitation preferentially enhanced the metal-ligand modes of the Fe-S clusters (Figure 2c, blue trace, Table 1), while the excitation lines distant from the S→Fe charge transfer (CT) transition resulted in a preferential enhancement of the active site vibrational modes (Figure 2c, green trace, Table 1).[73][74] Supported by theoretical methods, RR spectroscopy has shown to be highly versatile in unraveling key electronic and structural details of the [NiFe] and [FeFe] bimetallic centers. Additionally, RR and IR spectroscopic studies were successfully performed on the same single hydrogenase crystals, complementing the crystallographic data and facilitating structural assignment of Additional mechanistic ambiguous inhibited and active redox states, such as the oxygen stable Hinact and the hydrogen binding intermediate Nia-S state in [FeFe] and [NiFe] hydrogenases, respectively.[72][75] Notably, well-defined redox states in hydrogenase single crystals for IR imaging have been generated by electrochemical and gas control.[76][77][78][79] Furthermore, Fe-OH ligation at the unprecedented [4Fe–3S] cluster of the O2-tolerant membrane-bound [NiFe] hydrogenase from R. eutropha has been identified by RR spectroscopy and confirmed by theoretical quantum and molecular mechanics methods.[80][81] The corresponding FeS region of the three different clusters in the enzyme has been disentangled recently by RR spectroscopy in combination with protein engineering and X-ray crystallography,[81] while its coupling with the physiological electron acceptor, cytochrome b3, was investigated by SERR spectro-electrochemistry.[69][82]
3.2. Multi-cluster containing ferredoxins
Ferredoxin, Fd, is a small ET Fe-S containing protein in a number of metabolic reactions. Multiple wavelength excitation of di-cluster (e.g., [3Fe–4S] and [4Fe–4S] in Fd) containing Fe-S proteins can assure selective RR enhancement of individual clusters and provide their independent monitoring. IR and RR spectroscopies of a di-cluster Fd have addressed the effect of thermal perturbation on the level of secondary structural elements and the individual clusters, respectively. RR spectroscopy provided fine details about the disassembly of the centers in Fd by using 413, 458 and 514 nm laser excitation lines,[83] which enabled a differential enhancement of the RR bands associated with the [3Fe–4S] and [4Fe–4S] centers. It was shown that the temperature-induced simultaneous degradation of the two metal centers follows the initial loss of the alfa helical structure and triggers major structural changes of the protein matrix, including the loss of tertiary contacts and a secondary structure reorganization.[83]
References
- Siebert, F.; Hildebrandt, P.. Vibrational Spectroscopy in Life Science; Wiley-VCH: Weinheim, 2008; pp. 1.
- Roman S. Czernuszewicz; Grazyna Fraczkiewicz; Adelajda A. Zareba; A Detailed Resonance Raman Spectrum of Nickel(II)-SubstitutedPseudomonasaeruginosaAzurin. Inorganic Chemistry 2005, 44, 5745-5752, 10.1021/ic050553g.
- W. H. Woodruff; T. G. Spiro; T. Yonetani; Resonance Raman Spectra of Cobalt-Substituted Hemoglobin: Cooperativity and Displacement of the Cobalt Atom upon Oxygenation. Proceedings of the National Academy of Sciences 1974, 71, 1065-1069, 10.1073/pnas.71.4.1065.
- William H. Woodruff; David H. Adams; Thomas G. Spiro; Takashi Yonetani; Resonance Raman spectra of cobalt myoglobins and cobalt porphyrins. Evaluation of protein effects on porphyrin structure. Journal of the American Chemical Society 1975, 97, 1695-1698, 10.1021/ja00840a012.
- Shannon D. Garton; Robert M. Garrett; K. V. Rajagopalan; Michael K. Johnson; Resonance Raman Characterization of the Molybdenum Center in Sulfite Oxidase: Identification of MoO Stretching Modes. Journal of the American Chemical Society 1997, 119, 2590-2591, 10.1021/ja963931c.
- Smilja Todorovic; Maria Luísa Rodrigues; Daniela Matos; Inês A. C. Pereira; Redox Properties of Lysine- and Methionine-Coordinated Hemes Ensure Downhill Electron Transfer in NrfH2A4 Nitrite Reductase. The Journal of Physical Chemistry B 2012, 116, 5637-5643, 10.1021/jp301356m.
- ‡ Xianghui Li; § Manliang Feng; ‡ Yongting Wang; § And Hiroyasu Tachikawa; ‡ Victor L. Davidson; Evidence for Redox Cooperativity between c-Type Hemes of MauG Which Is Likely Coupled to Oxygen Activation during Tryptophan Tryptophylquinone Biosynthesis. Biochemistry 2005, 45, 821-828, 10.1021/bi052000n.
- Pauleta, S. R.; Lu, Y.; Goodhew, C. F.; Qiu, Y.; Moura, I.; Pettigrew, G.; Shelnutt, JA.; Structural changes in the calcium-dependent activation of the di-heme cytochrome c peroxidase of Paracoccus pantotrophus. Biophysical Journal 2002, 82 (1), 14A-14A.
- Matthew W. Wolf; Kimberly Rizzolo; Sean J. Elliott; Nicolai Lehnert; Resonance Raman, Electron Paramagnetic Resonance, and Magnetic Circular Dichroism Spectroscopic Investigation of Diheme Cytochrome c Peroxidases from Nitrosomonas europaea and Shewanella oneidensis. Biochemistry 2018, 57, 6416-6433, 10.1021/acs.biochem.8b00732.
- David D. Hobbs; Aidas Kriauciunas; Saadettin Güner; David B. Knaff; Mark R. Ondrias; Resonance Raman spectroscopy of cytochrome bc1 complexes from Rhodospirillum rubrum: Initial characterization and reductive titrations. Biochimica et Biophysica Acta (BBA) - Molecular Cell Research 1990, 1018, 47-54, 10.1016/0005-2728(90)90108-g.
- Smilja Todorovic; Miguel Teixeira; Resonance Raman spectroscopy of Fe–S proteins and their redox properties. JBIC Journal of Biological Inorganic Chemistry 2018, 23, 647-661, 10.1007/s00775-018-1533-0.
- Chonggui Qiu; Ziyi Cheng; Chuanzhu Lv; Rui Wang; Fabiao Yu; Development of bioorthogonal SERS imaging probe in biological and biomedical applications. Chinese Chemical Letters 2021, 32, 2369-2379, 10.1016/j.cclet.2021.03.016.
- Ziyi Cheng; Rui Wang; Yanlong Xing; Linlu Zhao; Jaebum Choo; Fabiao Yu; SERS-based immunoassay using gold-patterned array chips for rapid and sensitive detection of dual cardiac biomarkers. The Analyst 2019, 144, 6533-6540, 10.1039/c9an01260e.
- Smilja Todorovic; Daniel H. Murgida; Surface-Enhanced Raman Scattering of Biological Materials. Encyclopedia of Analytical Chemistry 2016, UK, 1-29, 10.1002/9780470027318.a9574.
- Murat Sezer; Diego Millo; Inez Weidinger; Ingo Zebger; Peter Hildebrandt; Analyzing the catalytic processes of immobilized redox enzymes by vibrational spectroscopies. IUBMB Life 2012, 64, 455-464, 10.1002/iub.1020.
- ‡ Julia Behr; ‡ Hartmut Michel; § And Werner Mäntele; § Petra Hellwig; Functional Properties of the Heme Propionates in Cytochrome c Oxidase from Paracoccus denitrificans. Evidence from FTIR Difference Spectroscopy and Site-Directed Mutagenesis. Biochemistry 2000, 39, 1356-1363, 10.1021/bi991504g.
- Diego Millo; Maria-Eirini Pandelia; Tillmann Utesch; Nattawadee Wisitruangsakul; Maria A. Mroginski; Wolfgang Lubitz; Peter Hildebrandt; Ingo Zebger; Spectroelectrochemical Study of the [NiFe] Hydrogenase from Desulfovibrio vulgaris Miyazaki F in Solution and Immobilized on Biocompatible Gold Surfaces. The Journal of Physical Chemistry B 2009, 113, 15344-15351, 10.1021/jp906575r.
- Gabriel Martins; Luisa Rodrigues; Filipa M. Cunha; Daniela Matos; Peter Hildebrandt; Daniel H. Murgida; Inês A. C. Pereira; Smilja Todorovic; Substrate Binding to a Nitrite Reductase Induces a Spin Transition. The Journal of Physical Chemistry B 2010, 114, 5563-5566, 10.1021/jp9118502.
- F. Gao; H. Qin; D.B. Knaff; L. Zhang; L. Yu; C.A. Yu; K.A. Gray; F. Daldal; M.R. Ondrias; Q-Band resonance Raman investigation of turnip cytochrome f and Rhodobacter capsulatus cytochrome c1. Biochimica et Biophysica Acta (BBA) - Protein Structure and Molecular Enzymology 1999, 1430, 203-213, 10.1016/s0167-4838(98)00284-2.
- Catherine De Vitry; Alain Desbois; Virginie Redeker; Francesca Zito; Francis-André Wollman; Biochemical and Spectroscopic Characterization of the Covalent Binding of Heme to Cytochromeb6†. Biochemistry 2004, 43, 3956-3968, 10.1021/bi036093p.
- Thierry Picaud; Carole Le Moigne; Adrienne Gomez De Gracia; Alain Desbois; Soret-Excited Raman Spectroscopy of the Spinach Cytochromeb6fComplex. Structures of theb- andc-Type Hemes, Chlorophylla, and β-Carotene. Biochemistry 2001, 40, 7309-7317, 10.1021/bi0106641.
- Tiago M. Bandeiras; Patricia N. Refojo; Smilja Todorovic; Daniel H. Murgida; Peter Hildebrandt; Christian Bauer; Manuela M. Pereira; Arnulf Kletzin; Miguel Teixeira; The cytochrome ba complex from the thermoacidophilic crenarchaeote Acidianus ambivalens is an analog of bc1 complexes. Biochimica et Biophysica Acta (BBA) - Molecular Cell Research 2009, 1787, 37-45, 10.1016/j.bbabio.2008.09.009.
- Petra Hellwig; Stefan Grzybek; Julia Behr; Bernd Ludwig; Hartmut Michel; Werner Mäntele; Electrochemical and Ultraviolet/Visible/Infrared Spectroscopic Analysis of Hemeaanda3Redox Reactions in the CytochromecOxidase fromParacoccus denitrificans: Separation of Hemeaanda3Contributions and Assignment of Vibrational Modes†. Biochemistry 1999, 38, 1685-1694, 10.1021/bi982282+.
- Masayo Iwaki; Livia Giotta; Akinyemi O. Akinsiku; Hermann Schägger; Nicholas Fisher; Jacques Breton; Peter R. Rich; Redox-Induced Transitions in Bovine Cytochromebc1Complex Studied by Perfusion-Induced ATR-FTIR Spectroscopy†. Biochemistry 2003, 42, 11109-11119, 10.1021/bi0343020.
- Masayo Iwaki; Gregory Yakovlev; Judy Hirst; Artur Osyczka; P. Leslie Dutton; Douglas Marshall; Peter R. Rich; Direct Observation of Redox-Linked Histidine Protonation Changes in the Iron−Sulfur Protein of the Cytochromebc1Complex by ATR-FTIR Spectroscopy†. Biochemistry 2005, 44, 4230-4237, 10.1021/bi047533v.
- Shelagh Ferguson-Miller; Gerald T. Babcock; Heme/Copper Terminal Oxidases. Chemical Reviews 1996, 96, 2889-2908, 10.1021/cr950051s.
- T Uno; Yoshifumi Nishimura; M Tsuboi; Kiyoshi Kita; Y Anraku; Resonance Raman study of cytochrome b562-o complex, a terminal oxidase of Escherichia coli in its ferric, ferrous, and CO-ligated states.. Journal of Biological Chemistry 1985, 260, 6755-6760, 10.1016/s0021-9258(18)88844-5.
- Jianling Wang; Jon Rumbley; Yuan-Chin Ching; Satoshi Takahashi; Robert B. Gennis; Denis L. Rousseau; Reaction of Cytochrome bo3 with Oxygen: Extra Redox Center(s) are Present in the Protein. Biochemistry 1995, 34, 15504-15511, 10.1021/bi00047a016.
- George E. Heibel; Peter Hildebrandt; Bernd Ludwig; Peter Steinruecke; Tewfik Soulimane; Gerhard Buse; Comparative resonance Raman study of cytochrome c oxidase from beef heart and Paracoccus denitrificans. Biochemistry 1993, 32, 10866-10877, 10.1021/bi00091a042.
- Constantinos Varotsis; Gerald T. Babcock; J. Arturo Garcia-Horsman; Robert B. Gennis; Resonance Raman Spectroscopy of the Heme Groups of Cytochrome cbb3 in Rhodobacter sphaeroides. The Journal of Physical Chemistry 1995, 99, 16817-16820, 10.1021/j100046a004.
- Eftychia Pinakoulaki; Ute Pfitzner; Bernd Ludwig; Constantinos Varotsis; The Role of the Cross-link His-Tyr in the Functional Properties of the Binuclear Center in Cytochrome c Oxidase. Journal of Biological Chemistry 2002, 277, 13563-13568, 10.1074/jbc.m112200200.
- Constantinos Varotsis; Magdalini Vamvouka; Resonance Raman and Fourier Transform Infrared Detection of Azide Binding to the Binuclear Center of Cytochrome bo3 Oxidase from Escherichia coli. The Journal of Physical Chemistry B 1999, 103, 3942-3946, 10.1021/jp984463r.
- Constantinos Varotsis; Magdalini Vamvouka; Resonance Raman and FTIR Studies of Carbon Monoxide-Bound Cytochromeaa3-600 Oxidase ofBacillus subtilis. The Journal of Physical Chemistry B 1998, 102, 7670-7673, 10.1021/jp9824095.
- W. Anthony Oertling; Kristene K. Surerus; Ólöf Einarsdóttir; James A. Fee; R. Brian Dyer; William H. Woodruff; Spectroscopic characterization of cytochrome ba3, a terminal oxidase from Thermus thermophilus: Comparison of the a3/CuB site to that of bovine cytochrome aa3. Biochemistry 1994, 33, 3128-3141, 10.1021/bi00176a048.
- Constantinos Varotsis; Takehiro Ohta; Teizo Kitagawa; Tewfik Soulimane; Eftychia Pinakoulaki; The Structure of the Hyponitrite Species in a Heme Fe-Cu Binuclear Center. Angewandte Chemie International Edition 2007, 46, 2210-2214, 10.1002/anie.200602963.
- Eftychia Pinakoulaki; Magdalini Vamvouka; Constantinos Varotsis; Resonance Raman Detection of the Fe2+−C−N Modes in Heme−Copper Oxidases: A Probe of the Active Site†. Inorganic Chemistry 2004, 43, 4907-4910, 10.1021/ic035216r.
- Tsuyoshi Egawa; Myat T. Lin; Jonathan P. Hosler; Robert B. Gennis; Syun-Ru Yeh; Denis L. Rousseau; Communication between R481 and CuB in Cytochrome bo3 Ubiquinol Oxidase from Escherichia coli. Biochemistry 2009, 48, 12113-12124, 10.1021/bi901187u.
- Marko Lauraeus; Marten Wikstrom; Constantinos Varotsis; Mary M. J. Tecklenburg; Gerald T. Babcock; Optical and resonance Raman spectroscopy of the heme groups of the quinol-oxidizing cytochrome aa3 of Bacillus subtilis. Biochemistry 1992, 31, 10054-10060, 10.1021/bi00156a027.
- Jianling Wang; Kevin A. Gray; Fevzi Daldal; Denis L. Rousseau; The cbb3-Type Cytochrome c Oxidase from Rhodobacter capsulatus Contains a Unique Active Site. Journal of the American Chemical Society 1995, 117, 9363-9364, 10.1021/ja00141a033.
- Hong Ji; Tapan K. Das; Anne Puustinen; Mårten Wikström; Syun-Ru Yeh; Denis L. Rousseau; Modulation of the active site conformation by site-directed mutagenesis in cytochrome c oxidase from Paracoccus denitrificans. Journal of Inorganic Biochemistry 2010, 104, 318-323, 10.1016/j.jinorgbio.2009.11.011.
- Rousseau, D. L.; Han, S. . Time-Resolved Resonance Raman Spectroscopy of Intermediates in Cytochrome Oxidase; Academic Press: United States, 2002; pp. 351-368.
- Takashi Ogura; Teizo Kitagawa; Resonance Raman characterization of the P intermediate in the reaction of bovine cytochrome c oxidase. Biochimica et Biophysica Acta (BBA) - Molecular Cell Research 2004, 1655, 290-297, 10.1016/j.bbabio.2003.10.013.
- Teizo Kitagawa; Structures of reaction intermediates of bovine cytochrome c oxidase probed by time-resolved vibrational spectroscopy. Journal of Inorganic Biochemistry 2000, 82, 9-18, 10.1016/s0162-0134(00)00155-0.
- Sanghwa Han; Satoshi Takahashi; Denis L. Rousseau; Time Dependence of the Catalytic Intermediates in Cytochromec Oxidase. Journal of Biological Chemistry 2000, 275, 1910-1919, 10.1074/jbc.275.3.1910.
- Denis A. Proshlyakov; Michelle A. Pressler; Gerald T. Babcock; Dioxygen activation and bond cleavage by mixed-valence cytochrome c oxidase. Proceedings of the National Academy of Sciences 1998, 95, 8020-8025, 10.1073/pnas.95.14.8020.
- Tapan Das; Cláudio M. Gomes; Tiago M. Bandeiras; Manuela M. Pereira; Miguel Teixeira; Denis L. Rousseau; Active site structure of the aa3 quinol oxidase of Acidianus ambivalens. Biochimica et Biophysica Acta (BBA) - Molecular Cell Research 2004, 1655, 306-320, 10.1016/j.bbabio.2003.08.011.
- † Smilja Todorovic; † Manuela M. Pereira; † Tiago M. Bandeiras; † Miguel Teixeira; † Peter Hildebrandt; † Daniel H. Murgida; Midpoint Potentials of Hemesaanda3in the Quinol Oxidase fromAcidianus ambivalensare Inverted. Journal of the American Chemical Society 2005, 127, 13561-13566, 10.1021/ja052921l.
- Marcel G. Friedrich; Frank Gieβ; Renate Naumann; Wolfgang Knoll; Kenichi Ataka; Joachim Heberle; Jana Hrabakova; Daniel H. Murgida; Peter Hildebrandt; Active site structure and redox processes of cytochrome c oxidase immobilised in a novel biomimetic lipid membrane on an electrode. Chemical Communications 2004, 9, 2376-2377, 10.1039/b410998h.
- Kenichi Ataka; Björn Richter; Joachim Heberle; Orientational Control of the Physiological Reaction of Cytochrome c Oxidase Tethered to a Gold Electrode. The Journal of Physical Chemistry B 2006, 110, 9339-9347, 10.1021/jp0534131.
- Jana Hrabáková; Kenichi Ataka; Joachim Heberle; Peter Hildebrandt; Daniel H. Murgida; Long distance electron transfer in cytochrome c oxidase immobilised on electrodes. A surface enhanced resonance Raman spectroscopic study. Physical Chemistry Chemical Physics 2006, 8, 759-766, 10.1039/b513379n.
- R. M. Nyquist; D. Heitbrink; C. Bolwien; R. B. Gennis; J. Heberle; Direct observation of protonation reactions during the catalytic cycle of cytochrome c oxidase. Proceedings of the National Academy of Sciences 2003, 100, 8715-8720, 10.1073/pnas.1530408100.
- Murat Sezer; Anna-Lena Woelke; Ernst Walter Knapp; Ramona Schlesinger; Maria Andrea Mroginski; Inez Weidinger; Redox induced protonation of heme propionates in cytochrome c oxidase: Insights from surface enhanced resonance Raman spectroscopy and QM/MM calculations. Biochimica et Biophysica Acta (BBA) - Molecular Cell Research 2017, 1858, 103-108, 10.1016/j.bbabio.2016.10.009.
- Petra Hellwig; Tewfik Soulimane; Werner Mäntele; Electrochemical, FT-IR and UV/VIS spectroscopic properties of thecaa3oxidase fromT. thermophilus. JBIC Journal of Biological Inorganic Chemistry 2002, 269, 4830-4838, 10.1046/j.1432-1033.2002.03182.x.
- Petra Hellwig; Cláudio M. Gomes; Miguel Teixeira; FTIR Spectroscopic Characterization of the Cytochromeaa3fromAcidianus ambivalens: Evidence for the Involvement of Acidic Residues in Redox Coupled Proton Translocation†. Biochemistry 2003, 42, 6179-6184, 10.1021/bi0205348.
- Constantinos Koutsoupakis; Olga Kolaj-Robin; Tewfik Soulimane; Constantinos Varotsis; Probing Protonation/Deprotonation of Tyrosine Residues in Cytochrome ba3 Oxidase from Thermus thermophilus by Time-resolved Step-scan Fourier Transform Infrared Spectroscopy. Journal of Biological Chemistry 2011, 286, 30600-30605, 10.1074/jbc.m111.252213.
- Elena A. Gorbikova; Kai Vuorilehto; Mårten Wikström; Michael I. Verkhovsky; Redox Titration of All Electron Carriers of Cytochrome c Oxidase by Fourier Transform Infrared Spectroscopy. Biochemistry 2006, 45, 5641-5649, 10.1021/bi060257v.
- Eftychia Pinakoulaki; Constantinos Varotsis; Resonance Raman Spectroscopy of Nitric Oxide Reductase andcbb3Heme-Copper Oxidase. The Journal of Physical Chemistry B 2008, 112, 1851-1857, 10.1021/jp077295o.
- Wolfgang Lubitz; Hideaki Ogata; Olaf Ruediger; Edward Reijerse; Hydrogenases. Chemical Reviews 2014, 114, 4081-4148, 10.1021/cr4005814.
- Julian T. Kleinhaus; Florian Wittkamp; Shanika Yadav; Daniel Siegmund; Ulf-Peter Apfel; [FeFe]-Hydrogenases: maturation and reactivity of enzymatic systems and overview of biomimetic models. Chemical Society Reviews 2020, 50, 1668-1784, 10.1039/d0cs01089h.
- Philip A. Ash; Ricardo Hidalgo; Kylie A. Vincent; Proton Transfer in the Catalytic Cycle of [NiFe] Hydrogenases: Insight from Vibrational Spectroscopy. ACS Catalysis 2017, 7, 2471-2485, 10.1021/acscatal.6b03182.
- Giorgio Caserta; Vladimir Pelmenschikov; Christian Lorent; Armel F. Tadjoung Waffo; Sagie Katz; Lars Lauterbach; Janna Schoknecht; Hongxin Wang; Yoshitaka Yoda; Kenji Tamasaku; et al.Martin KauppPeter HildebrandtOliver LenzStephen P. CramerIngo Zebger Hydroxy-bridged resting states of a [NiFe]-hydrogenase unraveled by cryogenic vibrational spectroscopy and DFT computations. Chemical Science 2020, 12, 2189-2197, 10.1039/d0sc05022a.
- Christian Lorent; Sagie Katz; Jifu Duan; Catharina Julia Kulka; Giorgio Caserta; Christian Teutloff; Shanika Yadav; Ulf-Peter Apfel; Martin Winkler; Thomas Happe; et al.Marius HorchIngo Zebger Shedding Light on Proton and Electron Dynamics in [FeFe] Hydrogenases. Journal of the American Chemical Society 2020, 142, 5493-5497, 10.1021/jacs.9b13075.
- Patrick S. Corrigan; Jonathan L. Tirsch; Alexey Silakov; Investigation of the Unusual Ability of the [FeFe] Hydrogenase from Clostridium beijerinckii to Access an O2-Protected State. Journal of the American Chemical Society 2020, 142, 12409-12419, 10.1021/jacs.0c04964.
- Patricia Rodríguez-Maciá; Nina Breuer; Serena Debeer; James A. Birrell; Insight into the Redox Behavior of the [4Fe–4S] Subcluster in [FeFe] Hydrogenases. ACS Catalysis 2020, 10, 13084-13095, 10.1021/acscatal.0c02771.
- Henrik Land; Moritz Senger; Gustav Berggren; Sven T. Stripp; Current State of [FeFe]-Hydrogenase Research: Biodiversity and Spectroscopic Investigations. ACS Catalysis 2020, 10, 7069-7086, 10.1021/acscatal.0c01614.
- Moritz Senger; Stefan Mebs; Jifu Duan; Florian Wittkamp; Ulf-Peter Apfel; Joachim Heberle; Michael Haumann; Sven Timo Stripp; Stepwise isotope editing of [FeFe]-hydrogenases exposes cofactor dynamics. Proceedings of the National Academy of Sciences 2016, 113, 8454-8459, 10.1073/pnas.1606178113.
- Nattawadee Wisitruangsakul; Oliver Lenz; Marcus Ludwig; Bärbel Friedrich; Friedhelm Lendzian; Peter Hildebrandt; Ingo Zebger; Monitoring Catalysis of the Membrane-Bound Hydrogenase fromRalstonia eutrophaH16 by Surface-Enhanced IR Absorption Spectroscopy. Angewandte Chemie International Edition 2008, 48, 611-613, 10.1002/anie.200802633.
- Brandon L. Greene; Gregory E. Vansuch; Bryant C. Chica; Michael W. W. Adams; R. Brian Dyer; Applications of Photogating and Time Resolved Spectroscopy to Mechanistic Studies of Hydrogenases. Accounts of Chemical Research 2017, 50, 2718-2726, 10.1021/acs.accounts.7b00356.
- Ricardo Hidalgo; Philip A. Ash; Adam J. Healy; Kylie A. Vincent; Infrared Spectroscopy During Electrocatalytic Turnover Reveals the Ni-L Active Site State During H2Oxidation by a NiFe Hydrogenase. Angewandte Chemie International Edition 2015, 54, 7110-7113, 10.1002/anie.201502338.
- Marius Horch; Janna Schoknecht; Solomon L. D. Wrathall; Gregory M. Greetham; Oliver Lenz; Neil T. Hunt; Understanding the structure and dynamics of hydrogenases by ultrafast and two-dimensional infrared spectroscopy. Chemical Science 2019, 10, 8981-8989, 10.1039/c9sc02851j.
- Hulin Tai; Shun Hirota; Sven T. Stripp; Proton Transfer Mechanisms in Bimetallic Hydrogenases. Accounts of Chemical Research 2020, 54, 232-241, 10.1021/acs.accounts.0c00651.
- Yulia Ilina; Christian Lorent; Sagie Katz; Jae-Hun Jeoung; Seigo Shima; Marius Horch; Ingo Zebger; Holger Dobbek; X‐ray Crystallography and Vibrational Spectroscopy Reveal the Key Determinants of Biocatalytic Dihydrogen Cycling by [NiFe] Hydrogenases. Angewandte Chemie International Edition 2019, 58, 18710-18714, 10.1002/anie.201908258.
- S. Katz; J. Noth; M. Horch; H. S. Shafaat; T. Happe; Peter Hildebrandt; I. Zebger; Vibrational spectroscopy reveals the initial steps of biological hydrogen evolution. Chemical Science 2016, 7, 6746-6752, 10.1039/c6sc01098a.
- Marius Horch; Janna Schoknecht; Maria Andrea Mroginski; Oliver Lenz; Peter Hildebrandt; Ingo Zebger; Resonance Raman Spectroscopy on [NiFe] Hydrogenase Provides Structural Insights into Catalytic Intermediates and Reactions. Journal of the American Chemical Society 2014, 136, 9870-9873, 10.1021/ja505119q.
- Patricia Rodríguez‐Maciá; Lisa M. Galle; Ragnar Bjornsson; Christian Lorent; Ingo Zebger; Yoshitaka Yoda; Stephen P. Cramer; Serena Debeer; Ingrid Span; James A. Birrell; et al. Caught in the H inact : Crystal Structure and Spectroscopy Reveal a Sulfur Bound to the Active Site of an O 2 ‐stable State of [FeFe] Hydrogenase. Angewandte Chemie International Edition 2020, 59, 16786-16794, 10.1002/anie.202005208.
- P. A. Ash; S. B. Carr; H. A. Reeve; Aistė Skorupskaitė; J. S. Rowbotham; Rebecca Shutt; M. D. Frogley; R. M. Evans; G. Cinque; F. A. Armstrong; et al.K. A. Vincent Generating single metalloprotein crystals in well-defined redox states: electrochemical control combined with infrared imaging of a NiFe hydrogenase crystal. Chemical Communications 2017, 53, 5858-5861, 10.1039/c7cc02591b.
- Simone Morra; Jifu Duan; Martin Winkler; Philip A. Ash; Thomas Happe; Kylie A. Vincent; Electrochemical control of [FeFe]-hydrogenase single crystals reveals complex redox populations at the catalytic site. Dalton Transactions 2021, 50, 12655-12663, 10.1039/d1dt02219a.
- Philip A. Ash; Sophie E. T. Kendall-Price; Rhiannon Mari Evans; Stephen B. Carr; Amelia R. Brasnett; Simone Morra; Jack S. Rowbotham; Ricardo Hidalgo; Adam J. Healy; Gianfelice Cinque; et al.Mark D. FrogleyFraser A. ArmstrongKylie A. Vincent The crystalline state as a dynamic system: IR microspectroscopy under electrochemical control for a [NiFe] hydrogenase. Chemical Science 2021, 11, -, 10.1039/d1sc01734a.
- Christian Lorent; Vladimir Pelmenschikov; Stefan Frielingsdorf; Janna Schoknecht; Giorgio Caserta; Yoshitaka Yoda; Hongxin Wang; Kenji Tamasaku; Oliver Lenz; Stephen P. Cramer; et al.Marius HorchLars LauterbachIngo Zebger Exploring Structure and Function of Redox Intermediates in [NiFe]‐Hydrogenases by an Advanced Experimental Approach for Solvated, Lyophilized and Crystallized Metalloenzymes. Angewandte Chemie International Edition 2021, 60, 15854-15862, 10.1002/anie.202100451.
- Stefan Frielingsdorf; Johannes Fritsch; Andrea Schmidt; Mathias Hammer; Julia Löwenstein; Elisabeth Siebert; Vladimir Pelmenschikov; Tina Jaenicke; Jacqueline Kalms; Yvonne Rippers; et al.Friedhelm LendzianIngo ZebgerChristian TeutloffMartin KauppRobert BittlPeter HildebrandtBärbel FriedrichOliver LenzPatrick ScheererVladimir Pelmentschikov Reversible [4Fe-3S] cluster morphing in an O2-tolerant [NiFe] hydrogenase. Nature Chemical Biology 2014, 10, 378-385, 10.1038/nchembio.1500.
- Elisabeth Siebert; Andrea Schmidt; Stefan Frielingsdorf; Jacqueline Kalms; Uwe Kuhlmann; Oliver Lenz; Patrick Scheerer; Ingo Zebger; Peter Hildebrandt; Resonance Raman spectroscopic analysis of the iron–sulfur cluster redox chain of the Ralstonia eutropha membrane‐bound [NiFe]‐hydrogenase. Journal of Raman Spectroscopy 2021, 52, 1-12, 10.1002/jrs.6163.
- Murat Sezer; Stefan Frielingsdorf; Diego Millo; Nina Heidary; Tillman Utesch; Maria-Andrea Mroginski; Bärbel Friedrich; Peter Hildebrandt; Ingo Zebger; Inez M. Weidinger; et al. Role of the HoxZ Subunit in the Electron Transfer Pathway of the Membrane-Bound [NiFe]-Hydrogenase fromRalstonia eutrophaImmobilized on Electrodes. The Journal of Physical Chemistry B 2011, 115, 10368-10374, 10.1021/jp204665r.
- Smilja Todorovic; Sónia S. Leal; Carlos Salgueiro; Ingo Zebger; Peter Hildebrandt; Daniel H. Murgida; Cláudio M. Gomes; A Spectroscopic Study of the Temperature Induced Modifications on Ferredoxin Folding and Iron−Sulfur Moieties. Biochemistry 2007, 46, 10733-10738, 10.1021/bi700967g.

