Submitted Successfully!
To reward your contribution, here is a gift for you: A free trial for our video production service.
Thank you for your contribution! You can also upload a video entry or images related to this topic.
Version Summary Created by Modification Content Size Created at Operation
1 + 2181 word(s) 2181 2021-09-15 10:13:18

Video Upload Options

We provide professional Video Production Services to translate complex research into visually appealing presentations. Would you like to try it?

Confirm

Are you sure to Delete?
Cite
If you have any further questions, please contact Encyclopedia Editorial Office.
Duan, R. Electricity Consumption in China. Encyclopedia. Available online: https://encyclopedia.pub/entry/14236 (accessed on 17 December 2024).
Duan R. Electricity Consumption in China. Encyclopedia. Available at: https://encyclopedia.pub/entry/14236. Accessed December 17, 2024.
Duan, Ruijun. "Electricity Consumption in China" Encyclopedia, https://encyclopedia.pub/entry/14236 (accessed December 17, 2024).
Duan, R. (2021, September 16). Electricity Consumption in China. In Encyclopedia. https://encyclopedia.pub/entry/14236
Duan, Ruijun. "Electricity Consumption in China." Encyclopedia. Web. 16 September, 2021.
Electricity Consumption in China
Edit

China’s electricity consumption presents a significant spatial spill over effect, and the spatial agglomeration of electricity consumption in local regions is mainly HH clusters. A 1% positive change in financial development causes an increase of 0.089% in electricity consumption, but a 1% rise in financial development reduces electricity consumption of neighboring regions by 0.051%. A 1% positive change in trade openness decreases electricity consumption by 0.051%, while the spatial spillover effect of trade openness is not significant. It is also found that financial development has a long-term promoting effect on electricity consumption, while trade openness has a long-term inhibiting effect on electricity consumption. 

electricity consumption financial development trade openness spatial autocorrelation spatial Durbin model PVAR model

1. Introduction

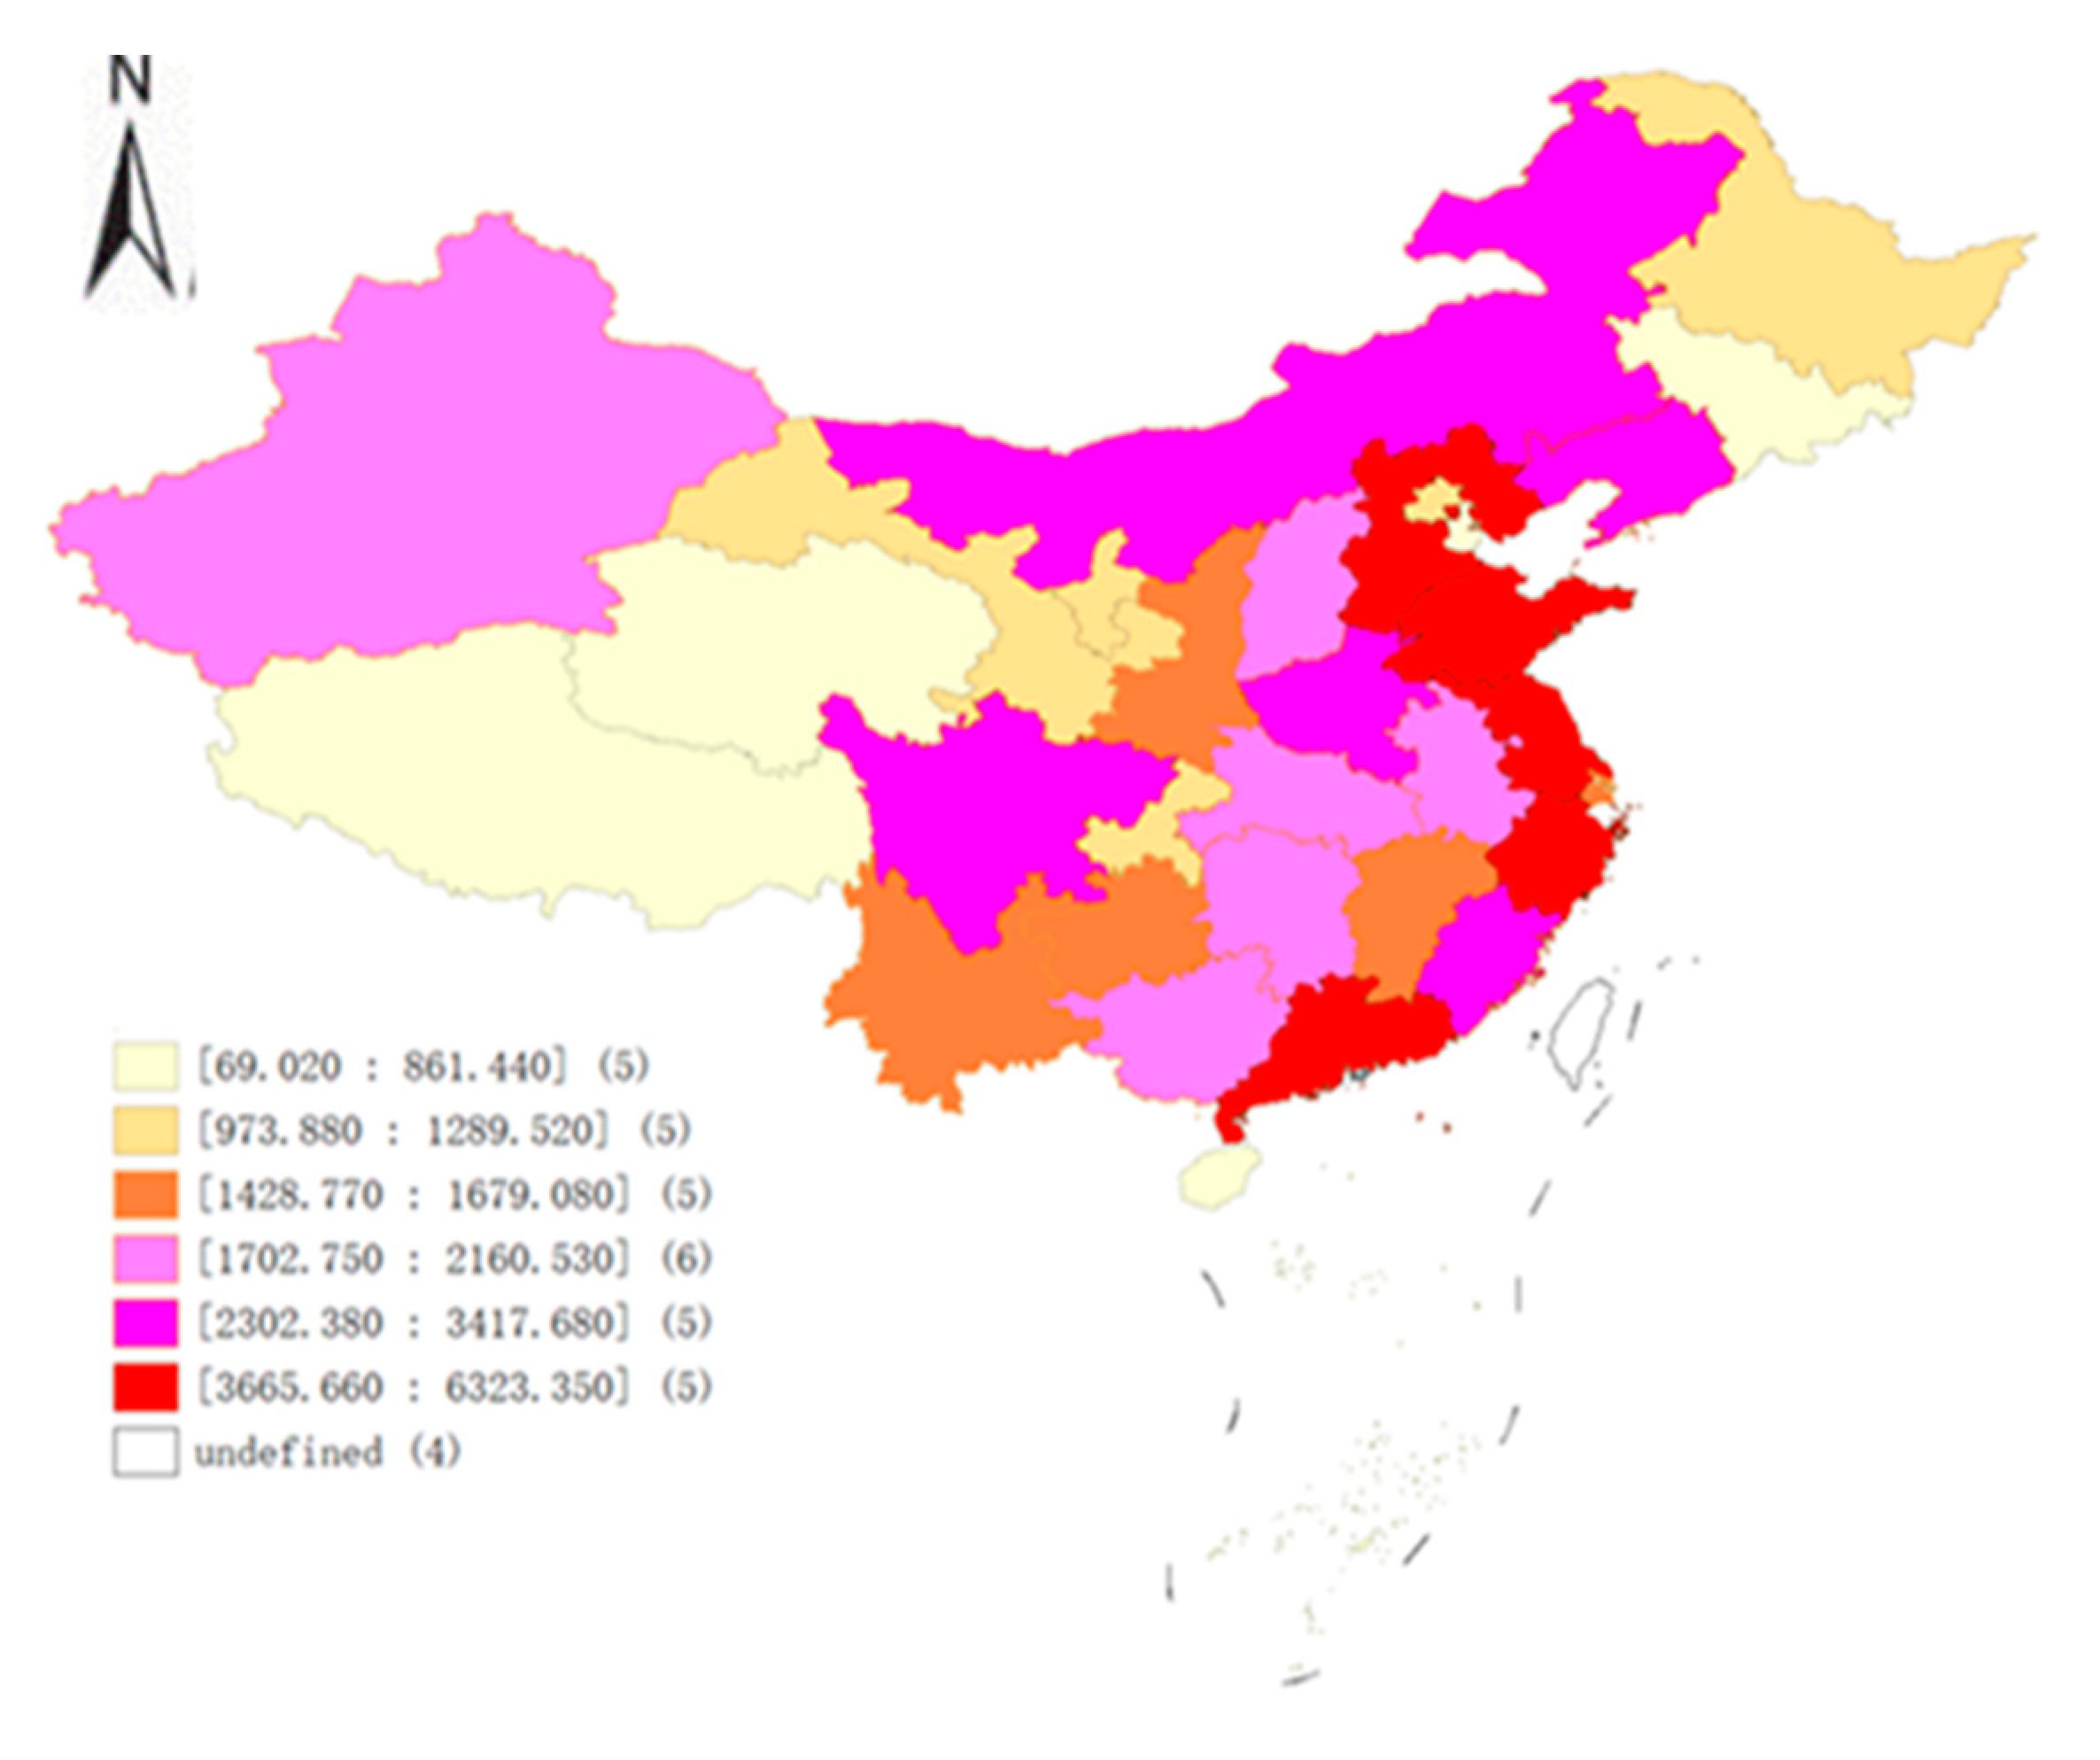
Electricity is the fastest-growing source of final energy consumption, and global electricity demand grows at 2.1% per year from 2018 to 2040, twice the rate of primary energy demand. The environmental implications of these patterns of energy use are stark, and energy-related CO2 emissions hit a record high since 2013 with a 1.9% increase in 2018 [1]. Due to the heavy dependence on fossil fuels, world electricity generation leads to massive carbon emissions, which accounts for 37.5% of total CO2 emissions [2]. China is the world’s largest CO2 emitter, with 9570.8 Mt of CO2 emissions in 2018, occupying 28.6% of world emissions [3]. China is actively pursuing a decarbonization transition, with the government committing to a carbon peak by 2030 and net-zero emissions by 2060. Figure 1 shows the regional distribution of electricity consumption based on six quantile maps in 2018. The five provinces with the highest value of electricity consumption are Hebei, Jiangsu, Zhejiang, Shandong, and Guangdong. The maximum value appeared in Guangdong province, where the corresponding electricity consumption is 632.34 billion kWh. Indeed, due to economic development, geographic environment, and consequent population distribution, the electricity consumptions of eastern provinces are higher than the central and western provinces. Specifically, the average electricity consumption in eastern, central, and western provinces is 216 billion kWh, 124.6 billion kWh, and 95.1 billion kWh, respectively (three regional division methods can be found in [4]).
Sustainability 13 10206 g001
Figure 1. Spatial distribution of China’s provincial electricity consumption in 2018. Note: Electricity consumption is expressed in units of 100 million kWh. Data source: the National Bureau of Statistics of China.
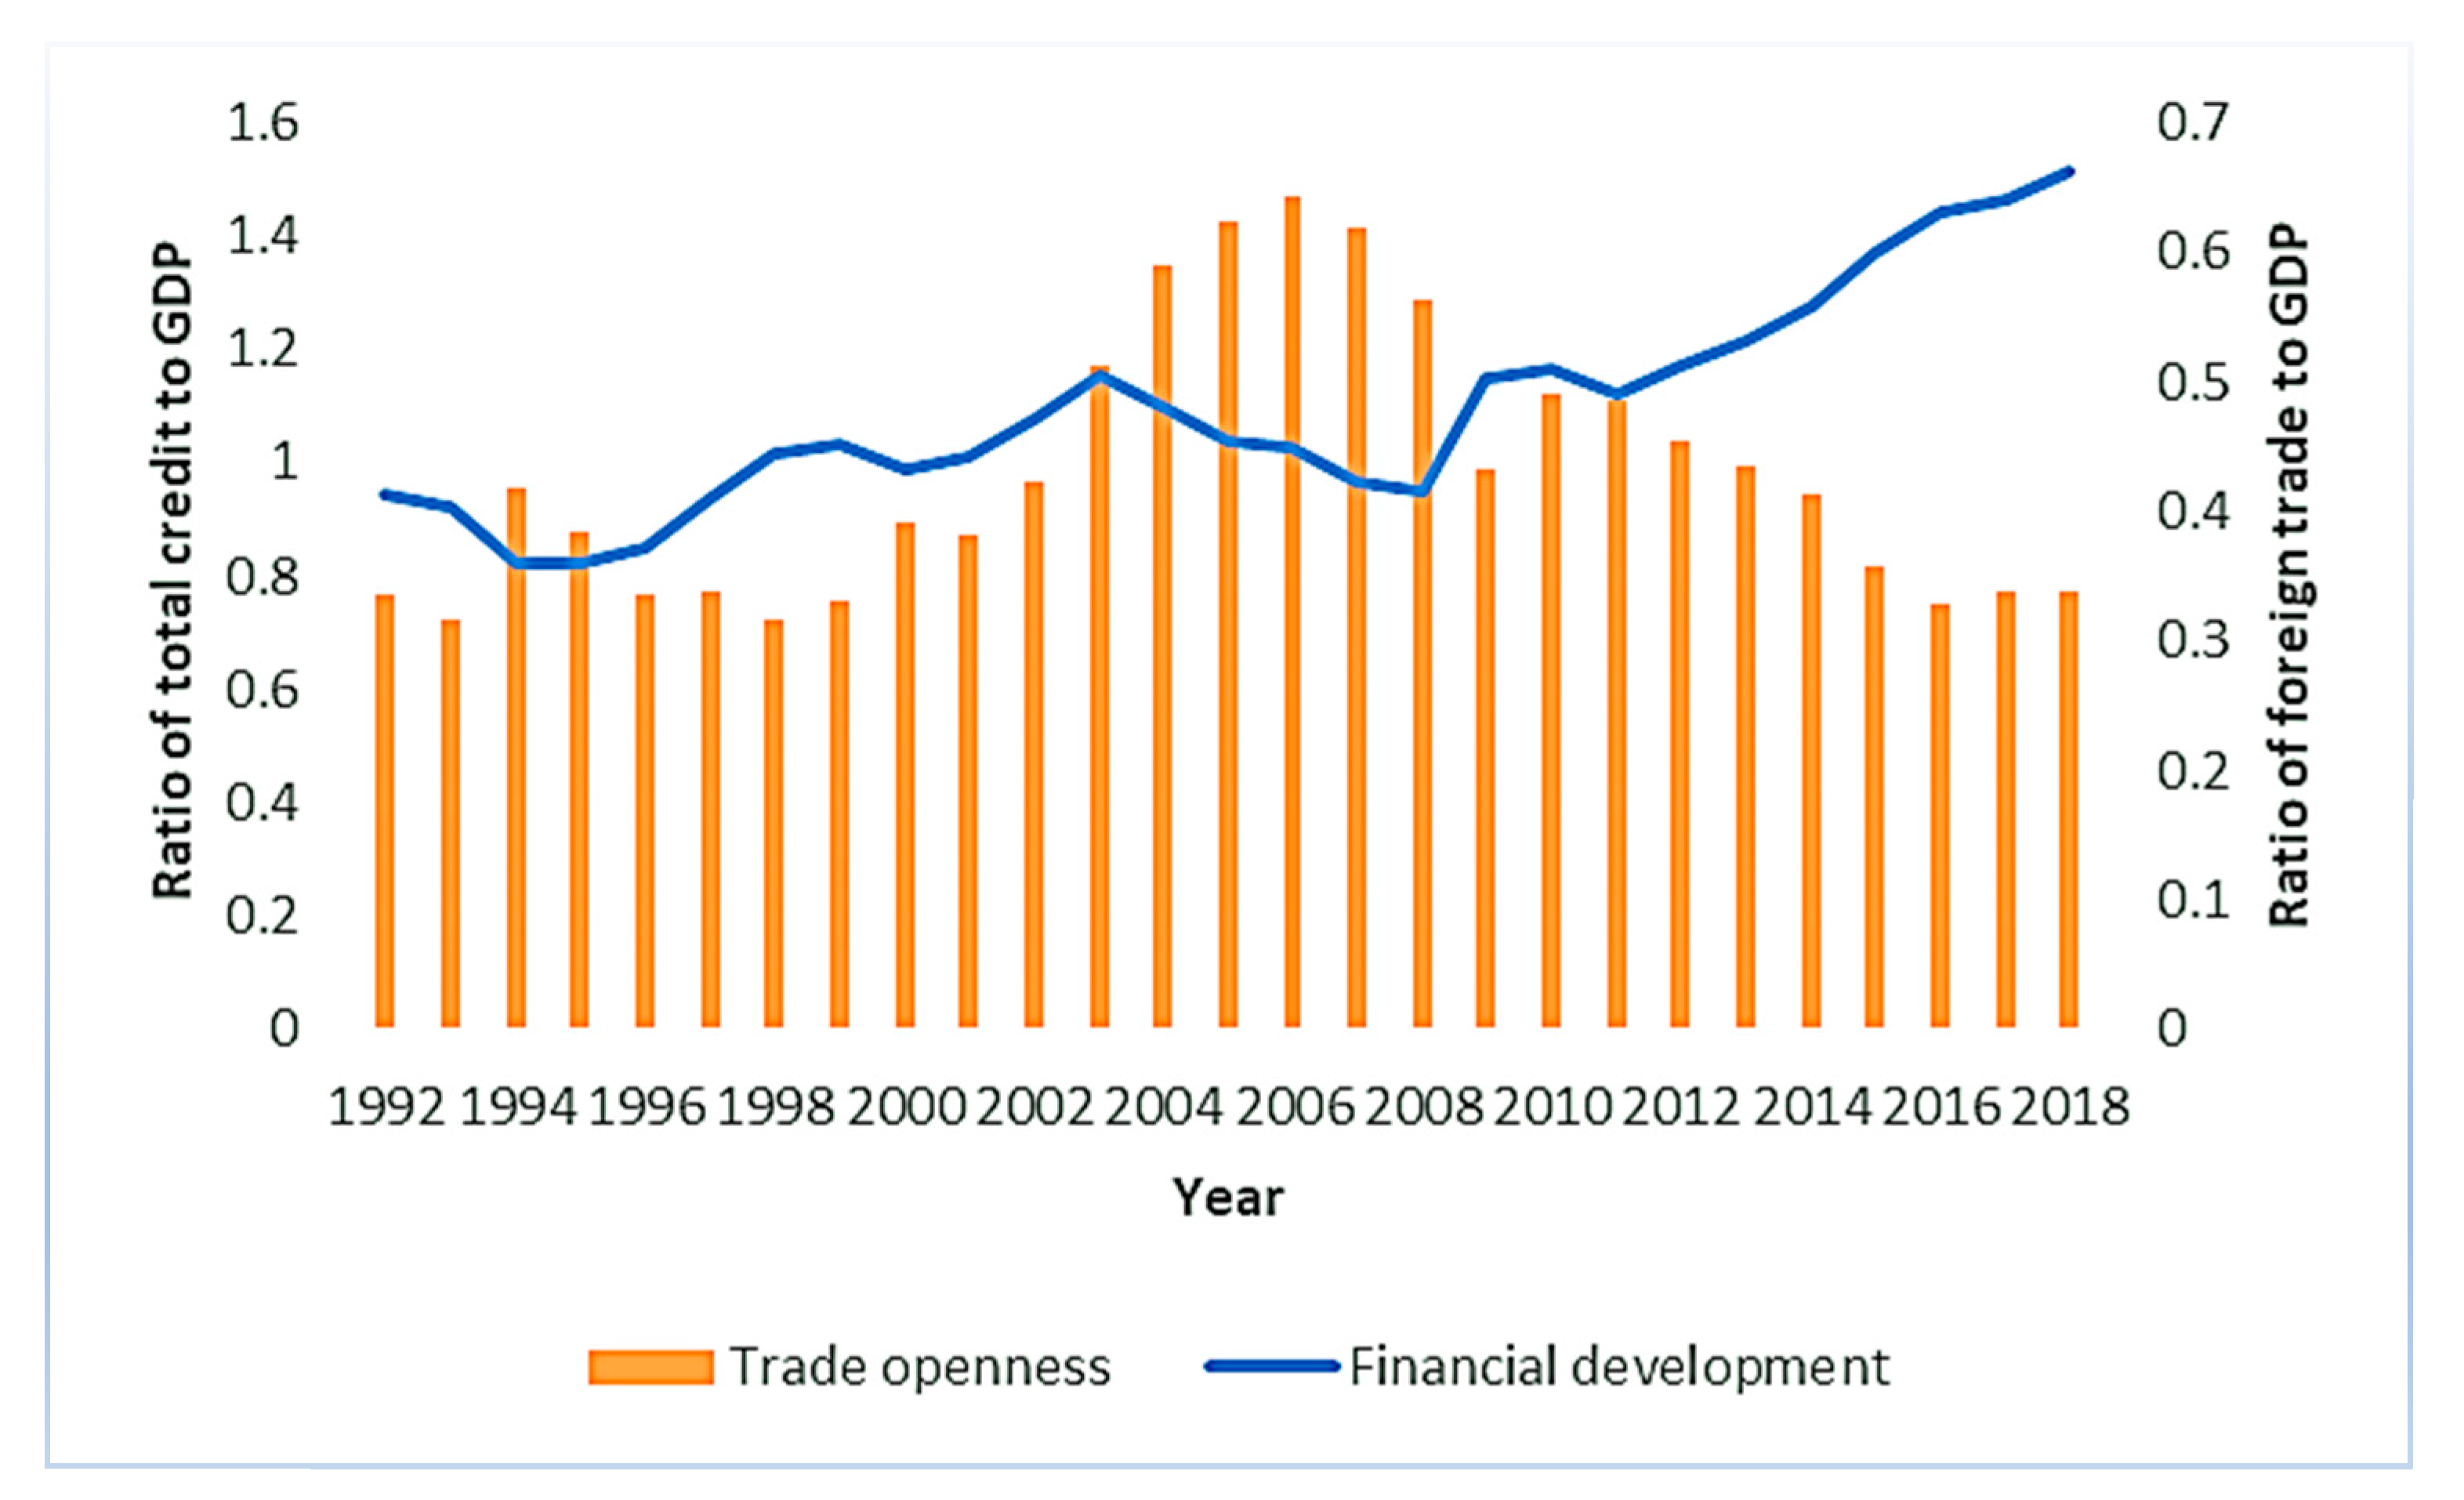
Financial development is one possible way to increase economic growth, and this will affect energy demand. After accession to the World Trade Organization (WTO), China has continued to improve its multi-level and multi-functional financial market system, and its banking transactions and information system services help increase the ratio of bank loans to GDP. Figure 2 shows that between 1992 and 2018, the ratio of total loans from financial institutions to GDP from 0.95 in 1992 to 1.51 in 2018. Financial development can impact the demand for electricity through four different channels. First, financial development can make it easier for consumers to borrow money to buy big ticket items such as cars, houses, refrigerators, air conditioners, and washing machines. These commodities typically consume large amounts of electricity, which can affect a country’s overall demand for electricity. Second, businesses also benefit from improved financial development because it makes it easier and less costly to gain access to financial capital to expand existing businesses or create new ones. Third, the stock market creates a wealth effect that boosts consumer and business confidence, and increased economic confidence stimulates the demand for energy-intensive products [5]. Fourth, financial development can promote technological innovation and improve power efficiency. A developed financial market can provide financing support for green power projects, thereby promoting the upgrading of electricity structure [6].
Sustainability 13 10206 g002
Figure 2. Financial development and trade openness in China, 1992–2018. Data source: the National Bureau of Statistics of China.
Regarding trade openness, after 1978, China gradually relaxed from central planning and opened up for trade [7]. China became a member of the WTO in 2001, which further accelerated the process of China’s integration into the global economy. Figure 2 indicates that foreign trade as a share of GDP improved dramatically from 33.53% in 1992 to 64.24% in 2006 before taking a dip to 33.88% in 2018. The common opinion about trade openness is that it leads to an increase in economic output and, therefore, to an increase in energy consumption. However, Sbia et al. [8] argued that free trade may lead to an increase in energy use efficiency because of larger energy markets and easier access to low-energy products. It revealed that a 0.3631% energy demand is declined by a 1% increase in trade openness in the United Arab Emirates.

2. The Effects of Financial Development and Trade Openness on Electricity Consumption 

The existing studies show that a great variety of factors can affect electricity consumption [6][9][10][11][12][13][14][15][16][17][18]. Sadorsky [10] explored the linkage between information communication technology and electricity consumption in emerging economies, finding that the use of information communication technology causes an upsurge in the demand for electricity consumption. Salahuddin and Alam [12] concluded that Internet usage and economic growth have no significant short-run relationship with electricity consumption, and there is a unidirectional causal relationship from Internet use to economic growth and electricity consumption. Al-Bajjali and Shamayleh [13] revealed that in Jordan GDP, urbanization, population, structure of economy and aggregate water consumption are significant and positively related to electricity consumption, while electricity prices are significant and negatively related to electricity consumption. Kumari and Sharma [14] analyzed the causal relationship among gross domestic product, foreign direct investment and electricity consumption in India. Lin and Wang [15] explained the inconsistency between electricity consumption and economic growth, pointing out that the feedback effect exists between electricity consumption and economic growth in most regions of China. An et al. [9] figured out that technological progress and optimization of industrial structure are two effective solutions to reduce electricity consumption in China. Zhang et al. [18] explored the impact of temperature on electricity consumption in the Yangtze River Delta Urban Agglomeration from the perspective of income growth, i.e., the moderating effect of income growth on the response of urban residential electricity to temperature changes.
Previous studies have explored the reasons for the rapid growth of electricity consumption from different perspectives, but the impact of financial development on electricity demand is a topic that has received little attention. Rafindadi and Ozturk [19] examined the relationship between economic growth, financial development, capital and trade openness, and electricity consumption in Japan from 1970 to 2012 using an ex-tended Cobb–Douglas production function. The results discover that in the long-run a 1% rise in the financial development will exert considerable pressure on the country’s electricity consumption by 0.2429%. Sbia et al. [20] investigated the relationship between economic growth, urbanization, financial development, and electricity consumption in the United Arab Emirates over the period 1975–2011 using the autoregressive distributed lag (ARDL) bounds test and the Granger causality vector error correction method (VECM). Their empirical findings confirm the existence of the bidirectional causality between financial development and electricity consumption, and financial development adds to electricity consumption. Faisal et al. [21] examined the relationship between internet usage, financial development, economic growth, capital, and electricity consumption by applying the structural break unit root test and the ARDL bounds test to quarterly data from 1993, Q1 to 2014, Q4. The long-run results confirm the existence of an inverted U-shaped relationship between financial development and electricity consumption. Solarin et al. [22] investigated the impact of information and communication technology, financial development and economic growth on electricity consumption by using the electricity demand function in case of Malaysia for the period of 1990–2015. The empirical results validate that financial development increases electricity consumption and the presence of bidirectional causality between financial development and electricity consumption. Adom [23] estimated the effect of financial development on electricity consumption for economies with above and below mean human capital index in 45 African countries using the simultaneous system generalized method of moments (GMM) estimator and the Aiken and West slope difference test. The results reveal that the direct effect of financial development increases electricity consumption, but the indirect effect of financial development reduces electricity consumption. Liu and Li [6] constructed two spatial panel models to explore the interaction between financial development and electricity consumption on the basic panel data of 278 cities in China from 2005 to 2016. The results show financial development is closely related to electricity consumption, urban industrial electricity consumption (IEC), and urban residential electricity consumption (REC), and the elasticity coefficients of financial development to electricity consumption, IEC, and REC are 0.079, 0.061, and 0.244, respectively. Meanwhile, financial development plays an important role in the increase of REC and IEC in eastern regions, western regions, small cities, large cities, and megacities of China.
A number of studies also explore the relationship between trade openness and electricity consumption. Lin et al. [24] employed the Johansen cointegration technique and vector error correction model to analyze the factors influencing renewable electricity consumption in China using data from 1980 to 2011. The results show that there is a long-term relationship between renewable electricity consumption and trade openness, and trade openness undermines renewable electricity consumption. Ohlan [25] explored the relationship between electricity consumption, trade openness, and economic growth in India utilizing ARDL model, Hatemi-J cointegration model, and Granger causality VECM for the period 1971–2016. The results indicate that electricity consumption and trade openness have a long-run association, and they find the existence of a long-term Granger causality flowing from electricity use to trade openness. Gregori and Tiwari [7] employed Pesaran’s CD test, the PANIC and PANICCA approaches, and Granger causality tests to analyze the short- and long-run linkages among electricity consumption, urbanization, GDP, and trade using data for 28 provinces during the period 1995–2016. The results reveal that trade openness displays feedback effects in the short-run, and there is a unidirectional long-run Granger causality running from trade openness to electricity consumption. Ghazouani et al. [26] applied ARDL approach to examine the nexus between trade openness, renewable electricity consumption, and economic growth for seven Asia-Pacific countries over the period 1980–2017. The results demonstrate that trade openness is an important long-run determinant of renewable electricity consumption in Indonesia, Malaysia, and Thailand, and there is evidence of Granger causality running from trade openness to renewable electricity consumption in Indonesia, Malaysia, Pakistan, and South Korea. Sahoo and Sethi [27] applied structural break and cointegration tests to examine the effects of remittance inflow, FDI, trade openness and urbanization on electricity consumption in India during the 1975–2017 period. The results reveal that 1% increase in trade openness leads to increase electricity consumption by 0.0884%.
In summary, the previous literature on financial development, trade openness, and electricity consumption shows that there are still some limitations in this area. First, the past literature has not included financial development, trade openness, and electricity consumption in the same analytical framework for empirical research. Second, most empirical studies on electricity consumption are based on the assumption of spatial independence. It is particularly important to take into account spatial dependencies, and ignoring them can produce biases, inaccuracies, and inconsistencies in the results [28][29]. Third, the previous studies are mostly static analyses, and the endogeneity problem caused by reverse causality could not be effectively addressed [30]. Therefore, this paper applies PVAR method to analyze the dynamic effects of financial development and trade openness on electricity consumption. The advantage of applying the PVAR method is that all variables can be simultaneously treated as endogenous, and thus the PVAR model can effectively address the potential endogeneity problem.

3. Conclusions and Policy Implications

Herein, we empirically analyze the direction and degree of the impact of financial development and trade openness on electricity consumption with China’s 2004–2018 provincial panel data using spatial econometric approaches and PVAR model. The following conclusions are drawn: First, China’s electricity consumption has a positive spatial correlation, and it shows a trend of agglomeration in spatial distribution. The spatial agglomeration of electricity consumption in local regions is mainly HH clusters, but over time, the HH clusters are gradually weakening. Second, according to the results of SDM with the geographic distance weight matrix, financial development is found to significantly increase electricity consumption within a province, and a 1% increase in financial development will lead to a corresponding increase of 0.089% in electricity consumption. This spatial spillover effect of financial development on electricity consumption is significantly negative, and a 1% rise in financial development reduces electricity consumption of neighboring regions by 0.051%. Third, the direct effect of trade openness on electricity consumption is significantly negative, with a 1% increase in trade openness decreasing electricity consumption by 0.051%, while the indirect effect of trade openness is not significant. Finally, regarding the impulse response results, our empirical findings show that the response of electricity consumption to one standard shock on financial development displays a positive sign, and the maximum positive impact occurs in the fourth period and then decreases slowly. The electricity consumption response to one standard deviation shock on trade openness shows a negative impact, and the maximum negative impact occurs in the first period and then increases gradually.
The findings provide valuable policy implications. First, policy makers should adjust and optimize the spatial correlation structure of electricity consumption and improve the regional allocation efficiency of electricity consumption. Second, financial development should be used as a policy tool to reduce electricity consumption. By accelerating green financial innovation, the financial sector is directed to sanction loans to those companies or industries that use advanced energy-efficient technologies in their production processes and who are environmentally friendly. Third, it should improve the structure of foreign trade, expand green trade, increase the proportion of energy-efficient import and export goods, and actively connect with the international frontier to learn and absorb advanced energy-saving technologies.

References

  1. IEA. World Energy Outlook 2019; International Energy Agency: Paris, France, 2019; Available online: https://www.iea.org/reports/world-energy-outlook-2019 (accessed on 14 August 2021).
  2. Lin, B.; Li, Z. Is more use of electricity leading to less carbon emission growth? An analysis with a panel threshold model. Energy Policy 2020, 137, 111121.
  3. IEA. Data-CO2 Emissions; International Energy Agency: Paris, France, 2021; Available online: https://www.iea.org/data-and-statistics (accessed on 7 August 2021).
  4. Zhou, G.; Chung, W.; Zhang, Y. Measuring energy efficiency performance of China’s transport sector: A data envelopment analysis approach. Expert Syst. Appl. 2014, 41, 709–722.
  5. Sadorsky, P. The impact of financial development on energy consumption in emerging economies. Energy Policy 2010, 38, 2528–2535.
  6. Liu, S.; Li, H. Does Financial Development Increase Urban Electricity Consumption? Evidence from Spatial and Heterogeneity Analysis. Sustainability 2020, 12, 7011.
  7. Gregori, T.; Tiwari, A.K. Do urbanization, income, and trade affect electricity consumption across Chinese provinces? Energy Economics 2020, 89, 104800.
  8. Sbia, R.; Shahbaz, M.; Hamdi, H. A contribution of foreign direct investment, clean energy, trade openness, carbon emissions and economic growth to energy demand in UAE. Econ. Model. 2014, 36, 191–197.
  9. An, H.; Xu, J.; Ma, X. Does technological progress and industrial structure reduce electricity consumption? Evidence from spatial and heterogeneity analysis. Struct. Chang. Econ. Dyn. 2020, 52, 206–220.
  10. Sadorsky, P. Information communication technology and electricity consumption in emerging economies. Energy Policy 2012, 48, 130–136.
  11. Shahbaz, M.; Feridun, M. Electricity consumption and economic growth empirical evidence from Pakistan. Qual. Quant. 2012, 46, 1583–1599.
  12. Salahuddin, M.; Alam, K. Internet usage, electricity consumption and economic growth in Australia: Time series evidence. Telemat. Inform. 2015, 32, 862–878.
  13. Al-Bajjali, S.K.; Shamayleh, A.Y. Estimating the determinants of electricity consumption in Jordan. Energy 2018, 147, 1311–1320.
  14. Kumari, A.; Sharma, A.K. Causal relationships among electricity consumption, foreign direct investment and economic growth in India. Electr. J. 2018, 31, 33–38.
  15. Lin, B.; Wang, Y. Inconsistency of economic growth and electricity consumption in China: A panel VAR approach. J. Clean. Prod. 2019, 229, 144–156.
  16. Taale, F.; Kyeremeh, C. Drivers of households’ electricity expenditure in Ghana. Energy Build. 2019, 205, 109546.
  17. Benjamin, N.I.; Lin, B. Influencing factors on electricity demand in Chinese nonmetallic mineral products industry: A quantile perspective. J. Clean. Prod. 2019, 243, 118584.
  18. Zhang, M.; Chen, Y.; Hu, W.; Deng, N.; He, W. Exploring the impact of temperature change on residential electricity consumption in China: The ‘crowding-out’ effect of income growth. Energy Build. 2021, 245, 111040.
  19. Rafindadi, A.A.; Ozturk, I. Effects of financial development, economic growth and trade on electricity consumption: Evidence from post-Fukushima Japan. Renew. Sustain. Energy Rev. 2016, 54, 1073–1084.
  20. Sbia, R.; Shahbaz, M.; Ozturk, I. Economic growth, financial development, urbanisation and electricity consumption nexus in UAE. Econ. Res.-Ekon. Istraživanja 2017, 30, 527–549.
  21. Faisal, F.; Tursoy, T.; Berk, N. Linear and non-linear impact of Internet usage and financial deepening on electricity consumption for Turkey: Empirical evidence from asymmetric causality. Environ. Sci. Pollut. Res. Int. 2018, 25, 11536–11555.
  22. Solarin, S.A.; Shahbaz, M.; Khan, H.N.; Razali, R.B. ICT, Financial Development, Economic Growth and Electricity Consumption: New Evidence from Malaysia. Glob. Bus. Rev. 2019, 22, 941–962.
  23. Adom, P.K. Financial depth and electricity consumption in Africa: Does education matter? Empir. Econ. 2020, 1–55.
  24. Lin, B.; Omoju, O.E.; Okonkwo, J.U. Factors influencing renewable electricity consumption in China. Renew. Sustain. Energy Rev. 2016, 55, 687–696.
  25. Ohlan, R. The relationship between electricity consumption, trade openness and economic growth in India. OPEC Energy Rev. 2018, 42, 331–354.
  26. Ghazouani, T.; Boukhatem, J.; Yan Sam, C. Causal interactions between trade openness, renewable electricity consumption, and economic growth in Asia-Pacific countries: Fresh evidence from a bootstrap ARDL approach. Renew. Sustain. Energy Rev. 2020, 133, 110094.
  27. Sahoo, M.; Sethi, N. Does remittance inflow stimulate electricity consumption in India? An empirical insight. South Asian J. Bus. Stud. 2020. ahead-of-print.
  28. Anselin, L.; Rey, S.J. Introduction to the Special Issue on Spatial Econometrics. Int. Reg. Sci. Rev. 1997, 20, 1–7.
  29. Jiang, L.; Ji, M. China’s Energy Intensity, Determinants and Spatial Effects. Sustainability 2016, 8, 544.
  30. Wu, H.; Xia, Y.; Yang, X.; Hao, Y.; Ren, S. Does environmental pollution promote China’s crime rate? A new perspective through government official corruption. Struct. Chang. Econ. Dyn. 2021, 57, 292–307.
More
Information
Subjects: Energy & Fuels
Contributor MDPI registered users' name will be linked to their SciProfiles pages. To register with us, please refer to https://encyclopedia.pub/register :
View Times: 570
Revision: 1 time (View History)
Update Date: 16 Sep 2021
1000/1000
Video Production Service