 +1 credit
| Version | Summary | Created by | Modification | Content Size | Created at | Operation |
|---|---|---|---|---|---|---|
| 1 | Wen-Hao Su | + 1884 word(s) | 1884 | 2021-09-13 06:03:14 | | | |
| 2 | Vicky Zhou | -4 word(s) | 1880 | 2021-09-14 05:08:34 | | | | |
| 3 | Wen-Hao Su | Meta information modification | 1880 | 2021-09-14 05:11:53 | | | | |
| 4 | Vicky Zhou | Meta information modification | 1880 | 2021-09-14 05:59:50 | | |
Video Upload Options
Imaging spectroscopy has emerged as a reliable analytical method for effectively characterizing and quantifying quality attributes of agricultural products. By providing spectral information relevant to food quality properties, imaging spectroscopy has been demonstrated to be a potential method for rapid and non-destructive classification, authentication, and prediction of quality parameters of various categories of tubers, including potato and sweet potato. The imaging technique has demonstrated great capacities for gaining rapid information about tuber physical properties (such as texture, water binding capacity, and specific gravity), chemical components (such as protein, starch, and total anthocyanin), varietal authentication, and defect aspects.
1. Introduction
Imaging spectroscopy integrates the main features of imaging and spectroscopic technologies, which can simultaneously acquire spatial and spectral information of an object [1][2][3][4][5]. This technology has been widely used in the quantitative determination and visualization of food physical and chemical values. In a hyperspectral image, each pixel contains a continuous spectrum composed of hundreds of wavebands [6][7][8]. The 3-dimension (3-D) spectral image with two spatial dimensions and one spectral dimension can be generated by area scan (tunable filter), line scan (pushbroom), or point scan (whiskbroom) [9]. As the successor of hyperspectral technology, multispectral technology can obtain several discrete spectral data from the test sample to characterize a certain characteristic parameter of the object of interest [10][11]. The Vis region (380–780 nm) contains spectral information related to color characteristics. The NIR spectrum is mainly in the range of 780–2500 nm, while the MIR spectrum is in the range of 2500–25,000 nm. The far infrared (FIR) spectrum is in the farther spectral range (25,000–300,000 nm). NIR and MIR spectra have higher energy than FIR spectra. These two spectra are more suitable for analyzing fingerprint information related to chemical components [12][13]. NIR spectrum is used to analyze the stretching and bending of chemical bonds, including O–H, S–H, N–H, and C–H [14]. MIR spectrum is mainly related to basic vibration and rotational vibration structure [15], which contains characteristic information related to chemical functional groups [16][17].
The spectral parameters of the detected object and its physical or chemical properties can be correlated by machine learning. Machine learning uses mathematical algorithms to explore the rules that exist in big data to assist decision-making, involving unsupervised learning and supervised learning. More information about machine learning can be found elsewhere [18]. Based on the establishment of the calibration model, the parameter values of unknown samples can be predicted. Machine learning methods, such as principal component regression (PCR), hierarchical cluster analysis (HCA), support vector machine (SVM), partial least squares regression (PLSR), multiple linear regression (MLR), locally weighted partial least squares regression (LWPLSR), artificial neural network (ANN), and least square support vector machine (LS-SVM), have been widely used in food analysis [19][20][21][22][23]. Feature variable selection based on genetic algorithm (GA) [24] , competitive adaptive reweighted sampling (CARS) [25][26], first-derivative and mean centering iteration algorithm (FMCIA) [27], regression coefficient (RC), successive projection algorithm (SPA) [28], and principal components analysis (PCA) [ 58] help to eliminate the feature overlap of continuous spectral information, which is conducive to the development of more robust and simplified machine learning models [29]. A high-performance model requires higher determination coefficients for cross-validation ( R 2CV ) and prediction ( R 2P ), correlation coefficients for prediction ( R P ), and lower root mean square errors for cross-validation (RMSECV) and prediction (RMSEP). Figure 1 shows the schematic of a general framework for tuber quality determination based on imaging spectroscopy. Detailed applications of the technology are given in the following section.
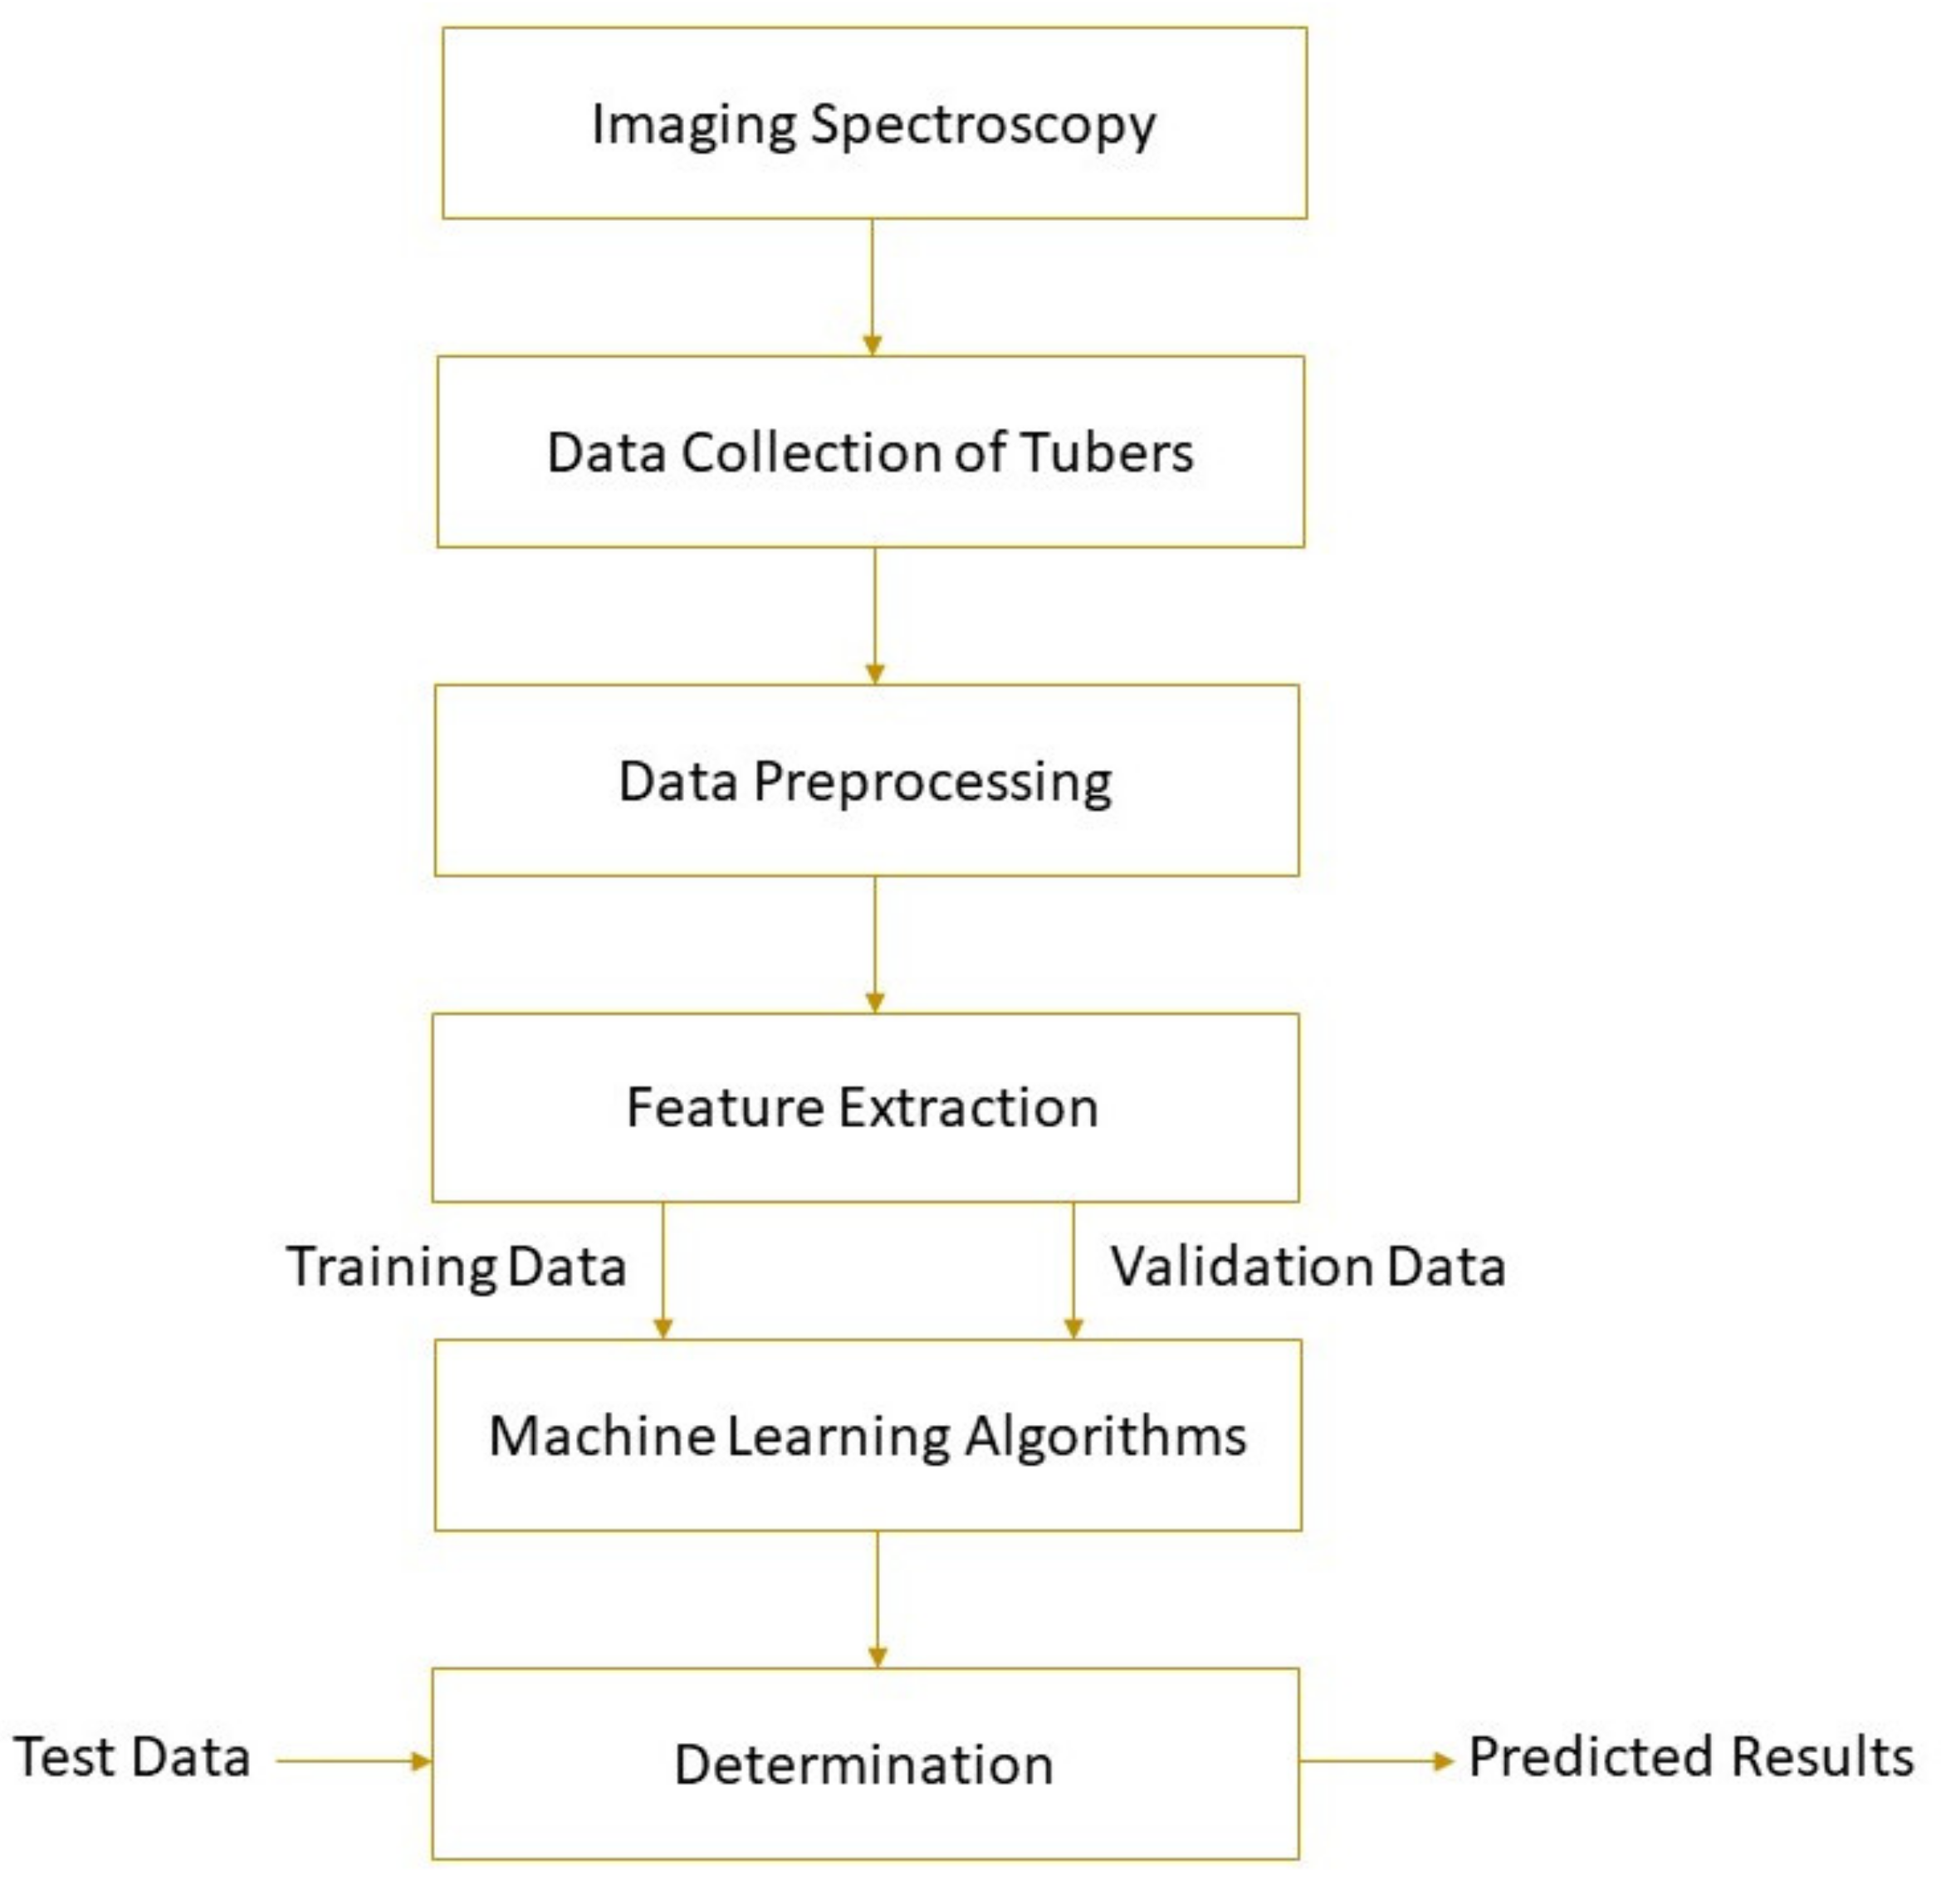
Figure 1. A typical schematic of imaging spectroscopy for tuber quality determinations.
2. Applications for Tuber Quality Assessment
The concept of agricultural intelligent sensing has attracted widespread attention. In the past few years, many scientists have studied the feasibility of imaging spectroscopy in rapid quality assessments of potato and sweet potato tubers. This section provides an overview of developments and applications of this technology as listed in Table 1 .
| Quality Parameter | Sample Type | Spectral Region | Optimal Model | Accuracy | Reference |
|---|---|---|---|---|---|
| Freshness, Cultivar | Potato | Vis-NIR | PLSR | 0.98 for freshness, 93% for cultivar discrimination |
[30] |
| Sprout | Potato | Vis-NIR | SMTSM | 89.28% | [31] |
| Sprouting activity | Potato | Vis-NIR | KNN, PLSDA | 90% | [32] |
| Root-knot nematodes | Potato | Vis-NIR | PLS-SVM | 100% | [33] |
| Zebra chip disease | Potato | Vis-NIR | PLSDA | 92% | [34] |
| Starch | Potato | Vis-NIR | SVR | RP = 0.93 | [35] |
| Starch | Potato | Vis-NIR | PLSR | RP = 0.94 | [36] |
| Escherichia coli | Potato | Vis-NIR | BPNN | 97.60% | [37] |
| Color, moisture content |
Potato | Vis-NIR | LSSVM | R2P = 0.84 for color, R2P = 0.77 for moisture content | [38] |
| TA, moisture content | Sweet potato |
Vis-NIR | PLSR | R2P = 0.87 for TA, R2P = 0.86 for moisture content | [39] |
| Moisture content | Sweet potato |
NIR | PLSR | R2P = 0.95 | [40] |
| SSC | Sweet potato | Vis-NIR | SVR | R2P = 0.86 | [41] |
| Sulfite dioxide residue | Potato | NIR | SVM | 95% | [42] |
| Glucose, sucrose | Potato | Vis-NIR | PLSR | RP = 0.90 glucose, RP = 0.82 for sucrose | [43] |
| Defects | Potato | Vis-NIR | LSSVM | 90.70% | [44] |
| Bruise | Potato | Vis-NIR | SVM | 100% | [45] |
| Hardness, resilience, springiness, cohesiveness, gumminess, chewiness | Potato, sweet potato |
MIR | LWPLSR | RP = 0.80, 0.88, 0.58, 0.57, 0.73 and 0.69 for hardness, resilience, springiness, cohesiveness, gumminess and chewiness |
[16] |
| Moisture content | Potato | Vis-NIR | PLSR | R2P = 0.98 for moisture content | [46] |
| Dry matter, starch | Potato, sweet potato |
NIR | MLR, PLSR | R2P = 0.96 for dry matter, RP2 = 0.96 for starch | [47] |
| Anthocyanin | Sweet potato |
Vis-NIR | MLR | R2P = 0.87 | [48] |
| Bruise | Potato | Vis-NIR | GLCM | 93.75% | [49] |
| Moisture content, FWC | Sweet potato |
Vis-NIR | MLR | R2P = 0.98 for moisture content, R2P = 0.93 for FWC |
[50] |
| Cultivar | Sweet potato |
NIR | PLSDA | 100% | [51] |
| Moisture content, color | Potato | Vis-NIR | PLSR | R2P = 0.99 for moisture content, R2P = 0.99 for colour |
[52] |
| VTC, TCD | Potato, sweet potato |
NIR | TBPANN | R2P = 0.97 for VTC, R2P = 0.98 for TCD | [53] |
| Variety | Potato, sweet potato |
NIR | PLSDA | ≥91.60% | [1] |
| WBC, SG | Potato, sweet potato |
NIR | LWPCR | R2P = 0.97 for WBC, R2P = 0.98 for SG | [54] |
| Moisture content | Potato, sweet potato | NIR | PLSR | R2P = 0.94 | [55] |
| Blackspot | Potato | Vis-NIR | PLSDA | 98.56% | [56] |
| Starch, glucose, asparagine |
Potato | Vis-NIR | PLSR | R2P = 0.70 for starch, R2P = 0.51 for glucose, R2P = 0.70 for asparagine |
[57] |
| Leaf counts, glucose, sucrose, soluble solids, specific gravity |
Potato | Vis-NIR | PLSR | RP = 0.95 for leaf counts, RP = 0.95 for glucose, RP = 0.55 for soluble solids, RP = 0.95 for sucrose, RP = 0.61 for specific gravity |
[58] |
| Sugar-end | Potato | NIR | PLSDA | 91.70% | [59] |
| Cooking time | Potato | Vis-NIR | PLSDA | R2P = 0.96 | [60] |
| Scab | Potato | NIR | SVM | 97.10% | [61] |
| Hollow heart | Potato | NIR | SVM | 89.10% | [62] |
| Moisture, fat content, color properties, maximum force | Taro chip | NIR | PLSR | R2P = 0.85–0.97 | [63] |
LWPLSR—locally weighted partial least squares regression; PLSR—partial least square regression; KNN—k-Nearest Neighbors; LSSVM—least squares support vector machine; PLS-SVM—partial least squares support vector machine; GLCM—gray level co-occurrence matrix; SSC—soluble solid content; SVR—support vector regression; PLSDA—partial least square discriminant analysis; VTC—volatility of tuber compositions; TCD—tuber cooking degree; SMTSM—supervised multiple threshold segmentation model; SVM—support vector machines; MLR—multiple linear regression; BPNN—back-propagation neural network; TBPANN—three-layer back propagation artificial neural network; TA—Total anthocyanin; FWC—freezable water content; RP—correlation coefficient for prediction; R2P—coefficient of determination for prediction.
3. Challenges and Future Prospects
- (a) the robustness of the models against group variability. This can be done by leaving an entire batch or cultivar out and testing if the models still provide good predictions. Other influencing factors with different variabilities, including samples from various batches, harvesting seasons, origins, and milling processes, should be considered;
- (b) the robustness of the selected set of wavebands. This can be done by performing the selection for different calibration and validation splits and evaluating if the same combination is always chosen. Additionally, different sources of samples can be used to validate the selected feature variables;
- (c) carefully benchmarking the new methods against state-of-the-art ones and evaluating whether the differences in prediction performance are significant.
- It has been implied that the existing spectral imaging systems are still in the developmental stage, and new strategies should be proposed to develop real-time and low-cost detection systems for food industry. With the further joint development of artificial intelligence and spectral imaging techniques, it could be anticipated that more advanced optical and imaging instruments will be established to simultaneously acquire spectral and spatial information of test specimens at laboratory and industrial scales.
References
- Su, W.-H.; Sun, D.-W. Potential of hyperspectral imaging for visual authentication of sliced organic potatoes from potato and sweet potato tubers and rapid grading of the tubers according to moisture proportion. Comput. Electron. Agric. 2016, 125, 113–124.
- Gómez-Sanchis, J.; Lorente, D.; Soria-Olivas, E.; Aleixos, N.; Cubero, S.; Blasco, J. Development of a hyperspectral computer vision system based on two liquid crystal tuneable filters for fruit inspection. Application to detect citrus fruits decay. Food Bioprocess Technol. 2014, 7, 1047–1056.
- Cen, H.; Lu, R.; Ariana, D.P.; Mendoza, F. Hyperspectral imaging-based classification and wavebands selection for internal defect detection of pickling cucumbers. Food Bioprocess Technol. 2014, 7, 1689–1700.
- Cheng, J.-H.; Sun, D.-W. Rapid quantification analysis and visualization of Escherichia coli loads in grass carp fish flesh by hyperspectral imaging method. Food Bioprocess Technol. 2015, 8, 951–959.
- Cheng, J.-H.; Sun, D.-W.; Pu, H.; Zeng, X.-A. Comparison of visible and long-wave near-infrared hyperspectral imaging for colour measurement of grass carp (Ctenopharyngodon idella). Food Bioprocess Technol. 2014, 7, 3109–3120.
- Su, W.-H.; Sun, D.-W.; He, J.-G.; Zhang, L.-B. Variation analysis in spectral indices of volatile chlorpyrifos and non-volatile imidacloprid in jujube (Ziziphus jujuba Mill.) using near-infrared hyperspectral imaging (NIR-HSI) and gas chromatograph-mass spectrometry (GC–MS). Comput. Electron. Agric. 2017, 139, 41–55.
- Yang, C.; Lee, W.S.; Gader, P. Hyperspectral band selection for detecting different blueberry fruit maturity stages. Comput. Electron. Agric. 2014, 109, 23–31.
- Tao, F.; Peng, Y. A nondestructive method for prediction of total viable count in pork meat by hyperspectral scattering imaging. Food Bioprocess Technol. 2015, 8, 17–30.
- ElMasry, G.M.; Nakauchi, S. Image analysis operations applied to hyperspectral images for non-invasive sensing of food quality—A comprehensive review. Biosyst. Eng. 2016, 142, 53–82.
- Su, W.H.; Sun, D.W. Multispectral imaging for plant food quality analysis and visualization. Compr. Rev. Food Sci. Food Saf. 2018, 17, 220–239.
- Lu, R. Multispectral imaging for predicting firmness and soluble solids content of apple fruit. Postharvest Biol. Technol. 2004, 31, 147–157.
- Su, W.-H.; Bakalis, S.; Sun, D.-W. NIR/MIR Spectroscopy in Tandem with Chemometrics for Rapid Identification and Evaluation of Potato Variety and Doneness Degree. In 2019 ASABE Annual International Meeting; American Society of Agricultural and Biological Engineers: St. Joseph, MI, USA, 2019; p. 1.
- Xue, H.; Su, W.-H. Non-Invasive Determination of Potato Breaking Strength by Mid-Infrared Microspectroscopy. Mod. Concepts Dev. Agron. 2019, 5, 525–528.
- Su, W.-H.; Arvanitoyannis, I.S.; Sun, D.-W. Trends in food authentication. In Modern Techniques for Food Authentication; Elsevier: Amsterdam, The Netherlands, 2018; pp. 731–758.
- Su, W.-H.; Bakalis, S.; Sun, D.-W. Chemometrics in tandem with near infrared (NIR) hyperspectral imaging and Fourier transform mid infrared (FT-MIR) microspectroscopy for variety identification and cooking loss determination of sweet potato. Biosyst. Eng. 2019, 180, 70–86.
- Su, W.-H.; Bakalis, S.; Sun, D.-W. Fourier transform mid-infrared-attenuated total reflectance (FTMIR-ATR) microspectroscopy for determining textural property of microwave baked tuber. J. Food Eng. 2018, 218, 1–13.
- Su, W.-H.; Bakalis, S.; Sun, D.-W. Fingerprinting study of tuber ultimate compressive strength at different microwave drying times using mid-infrared imaging spectroscopy. Dry. Technol. 2019, 37, 1113–1130.
- Su, W.-H. Advanced Machine Learning in Point Spectroscopy, RGB-and hyperspectral-imaging for automatic discriminations of crops and weeds: A review. Smart Cities 2020, 3, 767–792.
- Shahin, M.A.; Symons, S.J. Detection of Fusarium damaged kernels in Canada Western Red Spring wheat using visible/near-infrared hyperspectral imaging and principal component analysis. Comput. Electron. Agric. 2011, 75, 107–112.
- Lorente, D.; Aleixos, N.; Gómez-Sanchis, J.; Cubero, S.; Blasco, J. Selection of optimal wavelength features for decay detection in citrus fruit using the ROC curve and neural networks. Food Bioprocess Technol. 2013, 6, 530–541.
- Pu, H.; Sun, D.-W.; Ma, J.; Liu, D.; Cheng, J.-h. Using wavelet textural features of visible and near infrared hyperspectral image to differentiate between fresh and frozen–thawed pork. Food Bioprocess Technol. 2014, 7, 3088–3099.
- Nashat, S.; Abdullah, A.; Aramvith, S.; Abdullah, M. Support vector machine approach to real-time inspection of biscuits on moving conveyor belt. Comput. Electron. Agric. 2011, 75, 147–158.
- Su, W.-H.; Bakalis, S.; Sun, D.-W. Potato hierarchical clustering and doneness degree determination by near-infrared (NIR) and attenuated total reflectance mid-infrared (ATR-MIR) spectroscopy. J. Food Meas. Charact. 2019, 13, 1218–1231.
- Jarvis, R.M.; Goodacre, R. Genetic algorithm optimization for pre-processing and variable selection of spectroscopic data. Bioinformatics 2004, 21, 860–868.
- Li, H.; Liang, Y.; Xu, Q.; Cao, D. Key wavelengths screening using competitive adaptive reweighted sampling method for multivariate calibration. Anal. Chim. Acta 2009, 648, 77–84.
- He, H.-J.; Wu, D.; Sun, D.-W. Potential of hyperspectral imaging combined with chemometric analysis for assessing and visualising tenderness distribution in raw farmed salmon fillets. J. Food Eng. 2014, 126, 156–164.
- Su, W.-H.; Sun, D.-W. Evaluation of spectral imaging for inspection of adulterants in terms of common wheat flour, cassava flour and corn flour in organic Avatar wheat (Triticum spp.) flour. J. Food Eng. 2017, 200, 59–69.
- Araújo, M.C.U.; Saldanha, T.C.B.; Galvao, R.K.H.; Yoneyama, T.; Chame, H.C.; Visani, V. The successive projections algorithm for variable selection in spectroscopic multicomponent analysis. Chemom. Intell. Lab. Syst. 2001, 57, 65–73.
- Pu, H.; Kamruzzaman, M.; Sun, D.-W. Selection of feature wavelengths for developing multispectral imaging systems for quality, safety and authenticity of muscle foods-a review. Trends Food Sci. Technol. 2015, 45, 86–104.
- Kasampalis, D.S.; Tsouvaltzis, P.; Ntouros, K.; Gertsis, A.; Moshou, D.; Siomos, A.S. Rapid Nondestructive Postharvest Potato Freshness and Cultivar Discrimination Assessment. Appl. Sci. 2021, 11, 2630.
- Yang, Y.; Zhao, X.; Huang, M.; Wang, X.; Zhu, Q. Multispectral image based germination detection of potato by using supervised multiple threshold segmentation model and Canny edge detector. Comput. Electron. Agric. 2021, 182, 106041.
- Rady, A.M.; Guyer, D.E.; Donis-González, I.R.; Kirk, W.; Watson, N.J. A comparison of different optical instruments and machine learning techniques to identify sprouting activity in potatoes during storage. J. Food Meas. Charact. 2020, 14, 3565–3579.
- Žibrat, U.; Gerič Stare, B.; Knapič, M.; Susič, N.; Lapajne, J.; Širca, S. Detection of root-knot nematode meloidogyne luci infestation of potato tubers using hyperspectral remote sensing and real-time PCR molecular methods. Remote Sens. 2021, 13, 1996.
- Garhwal, A.S.; Pullanagari, R.R.; Li, M.; Reis, M.M.; Archer, R. Hyperspectral imaging for identification of Zebra Chip disease in potatoes. Biosyst. Eng. 2020, 197, 306–317.
- Wang, F.; Wang, C.; Song, S.; Xie, S.; Kang, F. Study on starch content detection and visualization of potato based on hyperspectral imaging. Food Sci. Nutr. 2021, 9, 4420–4430.
- Wang, F.; Wang, C.; Song, S. A study of starch content detection and the visualization of fresh-cut potato based on hyperspectral imaging. RSC Adv. 2021, 11, 13636–13643.
- Li, D.; Zhang, F.; Yu, J.; Chen, X.; Liu, B.; Meng, X. A rapid and non-destructive detection of Escherichia coli on the surface of fresh-cut potato slices and application using hyperspectral imaging. Postharvest Biol. Technol. 2021, 171, 111352.
- Xiao, Q.; Bai, X.; He, Y. Rapid screen of the color and water content of fresh-cut potato tuber slices using hyperspectral imaging coupled with multivariate analysis. Foods 2020, 9, 94.
- Tian, X.Y.; Aheto, J.H.; Bai, J.W.; Dai, C.; Ren, Y.; Chang, X. Quantitative analysis and visualization of moisture and anthocyanins content in purple sweet potato by Vis–NIR hyperspectral imaging. J. Food Process. Preserv. 2021, 45, e15128.
- Heo, S.; Choi, J.-Y.; Kim, J.; Moon, K.-D. Prediction of moisture content in steamed and dried purple sweet potato using hyperspectral imaging analysis. Food Sci. Biotechnol. 2021, 9, 1–9.
- Shao, Y.; Liu, Y.; Xuan, G.; Wang, Y.; Gao, Z.; Hu, Z.; Han, X.; Gao, C.; Wang, K. Application of hyperspectral imaging for spatial prediction of soluble solid content in sweet potato. RSC Adv. 2020, 10, 33148–33154.
- Bai, X.; Xiao, Q.; Zhou, L.; Tang, Y.; He, Y. Detection of sulfite dioxide residue on the surface of fresh-cut potato slices using near-infrared hyperspectral imaging system and portable near-infrared spectrometer. Molecules 2020, 25, 1651.
- Rady, A.M.; Guyer, D.E.; Watson, N.J. Near-infrared spectroscopy and hyperspectral imaging for sugar content evaluation in potatoes over multiple growing seasons. Food Anal. Methods 2021, 14, 581–595.
- Zhang, W.; Zhu, Q.; Huang, M.; Guo, Y.; Qin, J. Detection and classification of potato defects using multispectral imaging system based on single shot method. Food Anal. Methods 2019, 12, 2920–2929.
- Ye, D.; Sun, L.; Tan, W.; Che, W.; Yang, M. Detecting and classifying minor bruised potato based on hyperspectral imaging. Chemom. Intell. Lab. Syst. 2018, 177, 129–139.
- Amjad, W.; Crichton, S.O.; Munir, A.; Hensel, O.; Sturm, B. Hyperspectral imaging for the determination of potato slice moisture content and chromaticity during the convective hot air drying process. Biosyst. Eng. 2018, 166, 170–183.
- Su, W.-H.; Sun, D.-W. Chemical imaging for measuring the time series variations of tuber dry matter and starch concentration. Comput. Electron. Agric. 2017, 140, 361–373.
- Liu, Y.; Sun, Y.; Xie, A.; Yu, H.; Yin, Y.; Li, X.; Duan, X. Potential of hyperspectral imaging for rapid prediction of anthocyanin content of purple-fleshed sweet potato slices during drying process. Food Anal. Methods 2017, 10, 1–11.
- Ye, D.; Sun, L.; Yang, Z.; Che, W.; Tan, W. Determination of bruised potatoes by GLCM based on hyperspectral imaging technique. In Proceedings of the 2017 International Conference on Service Systems and Service Management (ICSSSM), Dalian, China, 16–18 June 2017; pp. 1–6.
- Sun, Y.; Liu, Y.; Yu, H.; Xie, A.; Li, X.; Yin, Y.; Duan, X. Non-destructive prediction of moisture content and freezable water content of purple-fleshed sweet potato slices during drying process using hyperspectral imaging technique. Food Anal. Methods 2017, 10, 1535–1546.
- Su, W.-H.; Sun, D.-W. Hyperspectral imaging as non-destructive assessment tool for the recognition of sweet potato cultivars. Biosyst. Eng. Res. Rev. 2017, 22, 21.
- Moscetti, R.; Sturm, B.; Crichton, S.O.; Amjad, W.; Massantini, R. Postharvest monitoring of organic potato (cv. Anuschka) during hot-air drying using visible–NIR hyperspectral imaging. J. Sci. Food Agric. 2017, 98, 2507–2517.
- Su, W.-H.; Sun, D.-W. Multivariate analysis of hyper/multi-spectra for determining volatile compounds and visualizing cooking degree during low-temperature baking of tubers. Comput. Electron. Agric. 2016, 127, 561–571.
- Su, W.-H.; Sun, D.-W. Comparative assessment of feature-wavelength eligibility for measurement of water binding capacity and specific gravity of tuber using diverse spectral indices stemmed from hyperspectral images. Comput. Electron. Agric. 2016, 130, 69–82.
- Su, W.-H.; Sun, D.-W. Rapid visualization of moisture migration in tuber during dehydration using hyperspectral imaging. In Proceedings of the CIGR-AgEng Conference, Aarhus, Denmark, 26–29 June 2016; pp. 1–8.
- López-Maestresalas, A.; Keresztes, J.C.; Goodarzi, M.; Arazuri, S.; Jarén, C.; Saeys, W. Non-destructive detection of blackspot in potatoes by Vis-NIR and SWIR hyperspectral imaging. Food Control 2016, 70, 229–241.
- Kjær, A.; Nielsen, G.; Stærke, S.; Clausen, M.R.; Edelenbos, M.; Jørgensen, B. Prediction of starch, soluble sugars and amino acids in potatoes (Solanum tuberosum L.) using hyperspectral imaging, dielectric and LF-NMR methodologies. Potato Res. 2016, 59, 357–374.
- Rady, A.M.; Guyer, D.E.; Kirk, W.; Donis-González, I.R. The potential use of visible/near infrared spectroscopy and hyperspectral imaging to predict processing-related constituents of potatoes. J. Food Eng. 2014, 135, 11–25.
- Groinig, M.; Burgstaller, M.; Pail, M. Industrial application of a new camera system based on hyperspectral imaging for inline quality control of potatoes. In Proceedings of the OAGM, FH Upper Austria, Wels Campus, Vienna, 11–13 May 2011; pp. 1–8.
- Do Trong, N.N.; Tsuta, M.; Nicolaï, B.; De Baerdemaeker, J.; Saeys, W. Prediction of optimal cooking time for boiled potatoes by hyperspectral imaging. J. Food Eng. 2011, 105, 617–624.
- Dacal-Nieto, A.; Formella, A.; Carrión, P.; Vazquez-Fernandez, E.; Fernández-Delgado, M. Common scab detection on potatoes using an infrared hyperspectral imaging system. In International Conference on Image Analysis and Processing; Springer: Berlin/Heidelberg, Germany, 2011; pp. 303–312.
- Dacal-Nieto, A.; Formella, A.; Carrión, P.; Vazquez-Fernandez, E.; Fernández-Delgado, M. Non–destructive Detection of Hollow Heart in Potatoes Using Hyperspectral Imaging. In Computer Analysis of Images and Patterns; Springer: Berlin/Heidelberg, Germany, 2011; pp. 180–187.
- Areekij, S.; Ritthiruangdej, P.; Kasemsumran, S.; Therdthai, N.; Haruthaithanasan, V.; Ozaki, Y. Rapid and nondestructive analysis of deep-fried taro chip qualities using near infrared spectroscopy. J. Near Infrared Spectrosc. 2017, 25, 127–137.
- Su, W.-H.; Zhang, J.; Yang, C.; Page, R.; Szinyei, T.; Hirsch, C.D.; Steffenson, B.J. Evaluation of mask RCNN for learning to detect fusarium head blight in wheat images. In 2020 ASABE Annual International Virtual Meeting; American Society of Agricultural and Biological Engineers: St. Joseph, MI, USA, 2020; p. 1.
- Liu, Y.; Pu, H.; Sun, D.-W. Efficient extraction of deep image features using convolutional neural network (CNN) for applications in detecting and analysing complex food matrices. Trends Food Sci. Technol. 2021, 113, 193–204.
- Su, W.-H.; Zhang, J.; Yang, C.; Page, R.; Szinyei, T.; Hirsch, C.D.; Steffenson, B.J. Automatic evaluation of wheat resistance to fusarium head blight using dual mask-RCNN deep learning frameworks in computer vision. Remote Sens. 2021, 13, 26.

