Your browser does not fully support modern features. Please upgrade for a smoother experience.
Submitted Successfully!
 +1 credit
Thank you for your contribution! You can also upload a video entry or images related to this topic.
For video creation, please contact our Academic Video Service.
| Version | Summary | Created by | Modification | Content Size | Created at | Operation |
|---|---|---|---|---|---|---|
| 1 | Gustavo Jacob Lourenço | + 7649 word(s) | 7649 | 2021-08-25 08:05:20 | | | |
| 2 | Bruce Ren | -2123 word(s) | 5526 | 2021-09-09 03:25:38 | | | | |
| 3 | Bruce Ren | -2123 word(s) | 5526 | 2021-09-09 03:34:31 | | |
Video Upload Options
We provide professional Academic Video Service to translate complex research into visually appealing presentations. Would you like to try it?
Cite
If you have any further questions, please contact Encyclopedia Editorial Office.
Lourenço, G. Pseudogene Transcripts in Head/Neck Cancer. Encyclopedia. Available online: https://encyclopedia.pub/entry/14010 (accessed on 28 July 2026).
Lourenço G. Pseudogene Transcripts in Head/Neck Cancer. Encyclopedia. Available at: https://encyclopedia.pub/entry/14010. Accessed July 28, 2026.
Lourenço, Gustavo. "Pseudogene Transcripts in Head/Neck Cancer" Encyclopedia, https://encyclopedia.pub/entry/14010 (accessed July 28, 2026).
Lourenço, G. (2021, September 08). Pseudogene Transcripts in Head/Neck Cancer. In Encyclopedia. https://encyclopedia.pub/entry/14010
Lourenço, Gustavo. "Pseudogene Transcripts in Head/Neck Cancer." Encyclopedia. Web. 08 September, 2021.
Copy Citation
Once considered nonfunctional, pseudogene transcripts are now known to provide valuable information for cancer susceptibility, including head and neck cancer (HNC), a serious health problem worldwide, with about 50% unimproved overall survival over the last decades. The present review focuses on the role of pseudogene transcripts involved in HNC risk and prognosis. Our study can guide new research to HNC understanding and development of new target therapies.
head and neck cancer
pseudogene transcripts
SNV
co-expression network
gene ontology enrichment
1. Introduction
Head and neck cancer (HNC) is the eighth most common cancer worldwide, with more than 835,000 new cases and 431,000 deaths due to the disease per year [1]. HNC comprises tumors in the oral cavity, pharynx, and larynx, and nearly 95% of them are squamous cell carcinoma histological type tumors [2]. The classical risk factors for developing HNC are smoking habits and alcohol consumption [3]. The human papillomavirus (HPV), in particular HPV16, is detected in approximately 25% of HNC cases, especially in tumors located at the oropharynx, and serves as a favorable prognostic factor for these patients [4]. Most HNC patients are diagnosed with measurable locally advanced disease, and only about half of these patients achieve complete or partial responses after treatment [5]. Besides surgery, cisplatin (CDDP), combined or not with radiotherapy (RT), has been used in HNC patients’ treatment [6], but therapy resistance has been reported [7].
Genetic and epigenetic alterations also play an important role in HNC progression [8][9]. Single-nucleotide polymorphism, copy number variation, loss of heterozygosity, and post-transcriptional expression modulation (somatic or inherited) have already been described in HNC [8][9]. However, few or no biomarkers are currently used in clinical practice. Patients’ therapy resistance and poor survival rates highlight the need to find novel molecular biomarkers in HNC and investigate their potential mechanism in tumor initiation and progression.
2. Pseudogenes
In 1977, Jacq and his colleagues first established the term “pseudogene” to describe DNA sequences similar to a functional gene but with mutations (e.g., frameshifts, premature stop codon) that render their RNA or protein products nonfunctional [10][11]. The label of “junk DNA” fell apart many years ago, as research evidence indicating pseudogenes’ role in many biological processes has grown steadily [12]. Although most pseudogenes are too deteriorated to perform a biological function, it has been shown that at least 20% of them show transcriptional activity and that pseudogenic RNAs can be translated into proteins [13].
Pseudogenes can be categorized as unprocessed (unitary or duplicated) or processed [11]. The unprocessed pseudogenes feature a loss of productivity, expression of RNA or protein-coding ability, and are generated by point mutation, insertion, deletion, misplaced stop codon, or frameshift from the parental gene. The unitary unprocessed pseudogenes differ from the duplicated ones in that the former had an established function (no parental gene) rather than being a more recent copy of a functional gene that was disabled [11]. In addition, the duplicated pseudogenes maintain the intron–exon structure [11]. The processed pseudogenes are formed by integrating the parental gene reverse-transcribed mRNA transcript into the genome by retro-transposition [11]. The processed pseudogenes lack introns, 5’ promoter sequence, and have flanking direct repeats and a 3’ polyadenylation tag [11]. In general, processed pseudogenes found within introns are more frequently expressed than processed pseudogenes found in intergenic regions due to the transcriptional process of their host genes [14].
Many pseudogenes hold conserved mutations in different species, indicating a common descent or evolutionary ancestry [11]. Moreover, established pseudogenes are passed from generation to generation, and they may be partially duplicated to create a new pseudogene [11]. Although nucleotides within the pseudogenes are conserved to maintain the original genetic elements, some cases of polymorphic pseudogenes have been identified and associated with cancer, such as E2F3P1 (E2F transcription factor 3 pseudogene 1) in liver cancer [15], MYLKP1 (myosin light-chain kinase pseudogene 1) in colon cancer [16], and GBAP1 (glucosylceramidase beta pseudogene 1) in gastric cancer [17].
3. Pseudogene Transcripts
The transcription of pseudogenes depends on their genomic location, and it could be processed mainly into antisense RNAs, endogenous small interfering (endo-si)RNAs, or micro (mi)RNA sponges [18], acting as negative or positive gene regulators [19]. Pseudogene antisense RNAs can bind directly into sense RNA from the parental gene and inhibit its translation and protein production [20]. Pseudogene-derived endo-siRNAs are produced by cleaved pseudogene sense or antisense transcripts of double-stranded RNA or by the inverted repeat region of pseudogenes transcribed into hairpin-shaped RNA and sliced by the ribonuclease Dicer [20]. They are then separated into single strands and incorporated into the RNA-induced silencing complex to bind and degrade target mRNAs, inhibiting protein production [20]. Pseudogene transcripts can also act as competing endogenous RNAs (ceRNA) [21]. They may share miRNA response elements with other genes, especially parental ones, and positively regulate their expression by competing for the same pool of miRNAs, acting as miRNAs sponges [20]. In this process, pseudogene transcripts inhibit miRNA-target gene binding, allowing gene expression and modulating biological processes and tumor progression [22][23]. In addition, pseudogene transcripts in sense orientation may compete for miRNAs, RNA-binding proteins, and translational machinery with the parental gene [18].
Pseudogene transcriptome can vary during physiological and pathological processes, such as cancer [19]. Pseudogene transcripts have been described in diverse types of human cancer, acting as tumor promotors, facilitating cancer development, or as tumor suppressors, inhibiting cancer progression [19]. Moreover, pseudogene transcripts have also shown a prognostic role in HNC, highlighting its importance in patient prognosis and treatment outcomes [24].
4. Pseudogene Transcripts in HNC
Although largely understudied, some pseudogene transcripts have been described in HNC. Here, we divided the literature information by tumor location (HNC in general with mixed patients, oral cancer, and laryngeal cancer studies) and provided a summary of pseudogenes associated with HNC described in the literature in Table 1. To the best of our knowledge, there is no study of pseudogene transcripts in the pharynx only. Additionally, it is possible that some real pseudogenes are named as genes in certain studies, meaning that we may have missed some information while searching the literature for pseudogenes only.
4.1. HNC in General
In HNC tumor cells, loss of PTENP1 (phosphatase and tensin homolog pseudogene 1) pseudogene transcript modulated malignant behavior and worst survival of HNC patients, leading to tumor cell proliferation, colony formation, and migration, possibly by interacting with its parental gene PTEN (phosphatase and tensin homolog) [25].
In HNC tumor cells and cell lines (FaDu, Cal-27, SCC4, and SCC9), FKBP9P1 (FKBP prolyl isomerase 9 pseudogene 1) pseudogene transcript abundance was found to correlate with advanced tumor stage and poor prognosis of patients by enhancing tumor cell proliferation, migration, and invasion, possibly by interacting with the PI3K/AKT signaling pathway [26].
Using RNA-seq data of HNC patients, Xing et al. [24] predicted a pseudogene signature, including LILRP1 (leukocyte immunoglobulin-like receptor pseudogene 1), RP6-191P20.5 (retinitis pigmentosa 6 191P20.5 pseudogene), RPL29P19 (ribosomal protein L29 pseudogene 19), TAS2R2P (taste 2 receptor member 2 pseudogene), and ZBTB45P1 (zinc finger and BTB domain-containing 45 pseudogene 1) pseudogenes, related with poor patients’ prognosis, possibly explained by a pseudogene transcript–parental gene interaction, increasing angiogenesis, tumor cell proliferation, and migration [24].
Based on The Cancer Genome Atlas (TCGA) data and the University of Alabama Cancer Database (UALCAN), Grzechowiak et al. [27] described that PTTG3P (pituitary tumor-transforming 3 pseudogene) pseudogene transcript abundance was correlated with HNC lower T-stage (T1 or T2), positive HPV16 status, and poor prognosis [27]. Gene Set Enrichment Analysis indicated that PTTG3P was correlated with genes involved in DNA repair, oxidative phosphorylation, and peroxisome pathways [27].
Several pseudogenes (AC010677.5, TCEB2P2, RPL37P2, PPIAP26, WTAPP1, UNGP3, UBA52P8, RP11-490K7.4, UBA52P6, EIF4HP2, AC114737.3, RP1-89D4.1, POLR2KP1, CD8BP, RP11-54C4.1, UNGP1, YWHAEP7, and NPM1P25) and their parental genes were involved in HPV16 viral infection in HNC patients, indicating their potential involvement in ribosomal activation control and increased protein synthesis during HPV16-alternated cell cycle [28].
4.2. Oral Cancer
In oral cancer cells, based on bioinformatics methods, FTH1P3 (ferritin heavy-chain 1 pseudogene 3), GTF2IRD2P1 (GTF2I repeat domain-containing 2 pseudogene 1), and PDIA3P (disulfide isomerase family A, member 3 pseudogene) pseudogene transcripts were associated with oral pathogenesis and metastasis by interacting with their targets, MMP1 (matrix metallopeptidase 1), MMP3 (matrix metallopeptidase 3), MMP9 (matrix metallopeptidase 9), PLAU (plasminogen activator urokinase), and IL8 (interleukin 8) genes, involved in tumor cell proliferation, migration, and metastasis [29].
FTH1P3 pseudogene transcript was also associated with oral cancer risk and prognosis by becoming a miRNA sponge for miR-224-5p and thereby modulating the expression of the FZD5 (frizzled class receptor 5) gene, facilitating cell proliferation and colony formation [30]. Moreover, the FTH1P3 transcript was associated with advanced tumor stage and poor prognosis in oral cancer [31]. FTH1P3 could promote proliferation, migration, and invasion of tumor cells, possibly by PI3K/Akt/GSK3β/Wnt/β-catenin signaling [31].
In addition, the PTENP1 transcript was found to act as a ceRNA, protecting the parental gene PTEN from miR-21 binding and therefore inhibiting tumor cell proliferation and colony formation [32].
4.3. Laryngeal Cancer
In laryngeal cancer, HMGA1P6 (high mobility group at-hook 1 pseudogene 6) and HMGA1P7 (high mobility group at-hook 1 pseudogene 7) pseudogene transcripts were identified as possible miRNA sponges, allowing the increase of HMGA2 expression (high mobility group at-hook 2) and other oncogenic genes involved in proliferation and cell cycle progression, such as CCNB2 (cyclin B2) and WNT (proto-oncogene WNT) family member genes, and epithelial–mesenchymal transition, such as SNAIL (snail family transcriptional repressor) and TWIST1 (twist family BHLH transcription factor 1) genes [33].
In a laryngeal cancer patient, the HLA-A (major histocompatibility complex class I A) processed pseudogene (HLA-A*31012) was identified from retro-transposition of the parental gene within a clonal tumor cell [34]. The HLA-A*31012 pseudogene transcript was restricted to tumor cells since it was not amplified in normal laryngeal tissue nor peripheral blood leucocytes [34]. This transcript may have contributed to laryngeal tumor progression by providing tumor cells with the immune system escape [34].
In addition, the FTH1P3 pseudogene transcript was associated with advanced tumor stage and worst overall survival in laryngeal cancer by enhancing cell proliferation, migration, and invasion, and inhibiting cell apoptosis, although the exact mechanism was not elucidated [35]. Using clinical materials from TCGA, a five-gene signature predicting survival of laryngeal cancer patients was established by Zhang et al. [36], where the pseudogene DPY19L2P1 was included. However, the exact mechanism was not investigated further [36].
Since pseudogene transcripts identified in HNC are largely unexplored in the literature, we performed an in silico analysis to predict potential biomarkers and their pathways for future validation with functional analysis.
Table 1. Pseudogene transcript, pseudogene–gene interaction, tumor effect, clinical outcome, tumor localization, and human papillomavirus status in head and neck cancer described in the literature.
| Pseudogene Transcript | Pseudogene–Gene Interaction | Tumor Effect | Clinical Outcome | Tumor Localization | Tumor HPV Status | Reference |
|---|---|---|---|---|---|---|
| PTENP1 | PTEN | Facilitates the aggressiveness of tumor | Poor prognosis | HN | Not specified | [25] |
| FKBP9P1 | PI3K/AKT | Facilitates the aggressiveness of tumor | Poor prognosis | HN | Not specified | [26] |
| LILRP1 | LILRB1 | Not specified | Poor prognosis | HN | Not specified | [24] |
| RP6-191P20.5 | VSIG | Not specified | Poor prognosis | HN | Not specified | [24] |
| RPL29P19 | PMEPA1 | Not specified | Poor prognosis | HN | Not specified | [24] |
| TAS2R2P | KLK5 | Not specified | Poor prognosis | HN | Not specified | [24] |
| ZBTB45P1 | HEATR1 | Not specified | Poor prognosis | HN | Not specified | [24] |
| PTTG3P | PTTG1 and PTTG2 | Facilitates the aggressiveness of tumor | Tumor development and progression | HN | Mixed | [27] |
| AC010677.5 | RPL23 | Facilitates HPV16 infection | Tumor development | HN | Mixed | [28] |
| TCEB2P2 | TCEB2 | Facilitates HPV16 infection | Tumor development | HN | Mixed | [28] |
| RPL37P2 | RPL37 | Facilitates HPV16 infection | Tumor development | HN | Mixed | [28] |
| PPIAP26 | PPIA | Facilitates HPV16 infection | Tumor development | HN | Mixed | [28] |
| WTAPP1 | MMP1 | Facilitates HPV16 infection | Tumor development | HN | Mixed | [28] |
| UNGP3 | UNG | Facilitates HPV16 infection | Tumor development | HN | Mixed | [28] |
| UBA52P8 | UBA52 | Facilitates HPV16 infection | Tumor development | HN | Mixed | [28] |
| RP11-490K7.4 | GTF2A2 | Facilitates HPV16 infection | Tumor development | HN | Mixed | [28] |
| UBA52P6 | UBA52 | Facilitates HPV16 infection | Tumor development | HN | Mixed | [28] |
| EIF4HP2 | EIF4H | Facilitates HPV16 infection | Tumor development | HN | Mixed | [28] |
| AC114737.3 | FDPS | Facilitates HPV16 infection | Tumor development | HN | Mixed | [28] |
| RP1-89D4.1 | RPS24 | Facilitates HPV16 infection | Tumor development | HN | Mixed | [28] |
| POLR2KP1 | POLR2K | Facilitates HPV16 infection | Tumor development | HN | Mixed | [28] |
| CD8BP | CD8B | Facilitates HPV16 infection | Tumor development | HN | Mixed | [28] |
| RP11-54C4.1 | RPLP1 | Facilitates HPV16 infection | Tumor development | HN | Mixed | [28] |
| UNGP1 | UNG | Facilitates HPV16 infection | Tumor development | HN | Mixed | [28] |
| YWHAEP7 | YWHAE | Facilitates HPV16 infection | Tumor development | HN | Mixed | [28] |
| NPM1P25 | NPM1 | Facilitates HPV16 infection | Tumor development | HN | Mixed | [28] |
| FTH1P3 | MMP1, PLAU, MMP3 and IL8 | Increased cell proliferation and migration | Tumor development and progression | Oral cavity | Not specified | [29] |
| FTH1P3 | miR-224-5p (FZD5) | Increased cell proliferation | Tumor development and progression | Oral cavity | Not specified | [30] |
| FTH1P3 | PI3K/Akt/GSK3β/Wnt/β-catenin | Increased cell proliferation and migration | Tumor development and progression | Oral cavity | Not specified | [31] |
| GTF2IRD2P1 | MMP1, PLAU, IL8 and MMP9 | Increased cell proliferation and migration | Tumor development and progression | Oral cavity | Not specified | [29] |
| PDIA3P | PLAU | Increased cell proliferation and migration | Tumor development and progression | Oral cavity | Not specified | [29] |
| PTENP1 | miR-21 (PTEN) | Increased cell proliferation | Tumor development | Oral cavity | Not specified | [32] |
| HMGA1P6 | HMGA2 | Facilitates the aggressiveness of tumor | Tumor development and progression | Larynx | Not specified | [33] |
| HMGA1P7 | HMGA2 | Facilitates the aggressiveness of tumor | Tumor development and progression | Larynx | Not specified | [33] |
| HLA-A*31012 | Not specified | Facilitates immune system escape | Tumor development | Larynx | Not specified | [34] |
| FTH1P3 | Not specified | Increased cell proliferation and migration | Tumor development and progression | Larynx | Not specified | [35] |
| DPY19L2P1 | Not specified | Not specified | Poor prognosis | Larynx | Not specified | [36] |
5. Materials and Methods
The in silico analysis consisted of acquiring and evaluating TCGA data from HNC patients to identify potential pseudogenes enrolled in tumor development. TCGA is a comprehensive public database for key genomic changes in various types of cancers, and we can obtain deregulated pseudogenes from the available transcriptome profiles.
Next, we constructed co-expression networks to identify pairs of genes (or pseudogenes) showing similar expression patterns across samples and performed gene ontology (GO) enrichment analysis to map the relationship between pseudogenes and other genes involved in the same biological process. A workflow of the methodology used in this study is shown in Figure 1.
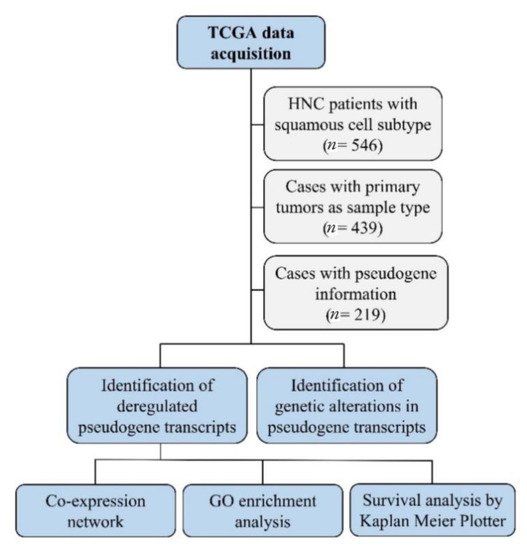
Figure 1. The workflow of the in silico analysis. This strategy detected deregulated pseudogene transcripts in head and neck cancer, their genetic alteration, gene interactions and pathways, and their role in patients’ survival.
5.1. TCGA Data Analysis
To identify potential pseudogene transcripts in HNC, we used the TCGA database (https://portal.gdc.cancer.gov; accessed on 21 May 2021) to download pseudogene transcript data on patients with HNC with squamous cell subtype and corresponding tumor location (oral cavity, oropharynx, hypopharynx, and larynx). We selected genomic information of patients with tumors located at the lip, gum, palate, floor of mouth, tonsil, base of tongue, oropharynx, nasopharynx, hypopharynx, and larynx (n = 546). Tumors in ill-defined sites and with complex mixed, stromal, adenomas, or adenocarcinomas subtypes were excluded. Next, we selected only those cases with primary tumors as sample type (n = 439). From those 439 HNC patients, we selected the cases with pseudogene information. We included only the transcript classification (biotypes) denominated, transcribed unprocessed pseudogene, processed pseudogene, unprocessed pseudogene, transcribed processed pseudogene, polymorphic pseudogene, immunoglobulin variable region pseudogene, and unitary pseudogene. From the 439 HNC patients, 220 did not present pseudogene expression information, which reduced our sample size to 219 HNC patients. From the 219 HNC patients selected, we also downloaded the somatic genomic alterations pseudogene data, such as single-nucleotide variation (SNV), deletions, and insertions, due to their potential of altering pseudogene transcription.
5.2. Co-Expression Networks and GO Enrichment Analysis
We built co-expression networks to better understand the relationship between pseudogenes and other genes in the genome. In a co-expression network, genes that have similar expression variation among samples are clustered in the same module, and they are generally thought to be involved in the same biological process [37]. Using RNAseq data from 213 HNC patients available in TGCA, we built a tumor co-expression network using the Weighted Correlation Network Analysis (WGCNA) R software package from gene expression values (log2-converted FPKM) [38]. It was not possible to obtain RNAseq data from six HNC patients. We kept only protein-coding genes from the human genome assembly reference GRCh38.p13 and the ten most deregulated pseudogenes of each HNC location (HNC in general, oral cavity, oropharynx, hypopharynx, and larynx). We then removed genes and pseudogenes not expressed in at least half of the samples and built the network with 19,406 protein-coding genes and 31 pseudogenes identified in the TCGA data analysis. Additional parameters used to build the network with WGCNA were a soft thresholding power of 8 and a minimum number of 30 genes allowed in a module [39]. The modules were then classified in colors.
To gain more insights about the possible functions of the pseudogenes described above, we performed a GO enrichment analysis for all gene modules containing at least one of most deregulated pseudogenes from HNC using the GOATOOLS Python library [40] (false discovery rate (FDR) adjusted p-values < 0.05) and subsequently summarized and visualized using the web tool REVIGO [41].
5.3. Survival Analysis
The Kaplan–Meier Plotter (https://kmplot.com/analysis/; accessed on 25 May 2021), an online database established from gene expression data and survival information of cancer patients from the TCGA database [42], was assessed to evaluate the prognostic value of the pseudogene transcripts identified in our study in a cohort of 500 HNC patients. Unfortunately, patients’ clinicopathological aspects were not available. A Kaplan–Meier survival plot, log-rank p-value, and confidence interval (CI) were directly determined and displayed by the database. Patients were split by the expression median. Relapse-free survival (RFS) consists of the date of diagnosis to the date of relapse or last follow-up. Overall survival (OS) consists of the date of diagnosis until the date of death, due to any cause, or last follow-up.
6. Results and Discussion
6.1. TCGA Data Analysis
We identified 370 pseudogene transcripts associated with HNC, where SPATA31D5P (SPATA31 subfamily D member 5 pseudogene), HERC2P3 (hect domain and RLD2 pseudogene 3), SPATA31C2 (SPATA31 subfamily C member 2), MAGEB6P1 (melanoma antigen family B6 pseudogene 1), SLC25A51P1 (solute carrier family 25 member 51 pseudogene 1), BAGE2 (B melanoma antigen family member 2), DNM1P47 (DNM1 pseudogene 47), SPATA31C1 (SPATA31 subfamily C member 1), ZNF733P (zinc finger protein 733 pseudogene), and OR2W5 (olfactory receptor, family 2, subfamily W, member 5) were found to be the most deregulated in HNC. The ten most deregulated pseudogene transcripts, chromosome location, gene family function, and involvement in cancer can be found in Table 2.
When we stratified patients’ information by tumor location, we found a few differences in pseudogene transcripts’ pattern that could be explained by different cancer behaviors [43], but some of the identified pseudogenes were present in more than one tumor location.
In oral cancer (n = 62), SPATA31D5P, NBPF25P (neuroblastoma breakpoint family member 25 pseudogene), HSP90AB2P (heat shock protein 90 alpha class B member 2 pseudogene), NXF4 (nuclear RNA export factor 4 pseudogene), FOLH1B (folate hydrolase 1B), DNM1P47, BNIP3P1 (BCL2/adenovirus E1B 19 interacting protein 3 pseudogene 1), PKD1L2 (polycystin 1-like 2 pseudogene), BAGE2, and ZNF658B (zinc finger protein 658B, pseudogene) were found to be the 10 most deregulated of 154 pseudogene transcripts identified (Table 2).
In oropharyngeal cancer (n = 51), POTEA (POTE ankyrin domain family, member A), MROH5 (maestro heat-like repeat family member 5), MSL3P1 (male-specific lethal 3 homolog pseudogene 1), HLA-H (major histocompatibility complex class I, H pseudogene), TUBB8P7 (tubulin beta 8 class VIII pseudogene 7), SLC7A5P2 (solute carrier family 7 member 5 pseudogene 2), DPY19L2P1 (DPY19L2 pseudogene 1), TSSC2 (tumor suppressing sub-transferable candidate 2 pseudogene), SPATA31C2, and NXF4 were found to be the 10 most deregulated of 109 pseudogene transcripts identified (Table 2 ).
In hypopharyngeal cancer (n = 8), DPY19L2P3 (DPY19L2 pseudogene 3), SPATA31D5P, GBA3 (glucosidase beta acid 3), PLEKHM1P (pleckstrin homology domain containing, family M member 1 pseudogene), DPY19L2P1, MST1P2 (macrophage-stimulating 1 pseudogene 2), RP11-44F14.1, ADAM21P1 (ADAM metallopeptidase domain 21 pseudogene 1), MAGEB6P1, and OR12D2 (olfactory receptor family 12 subfamily D member 2) were found to be the 10 most deregulated of 21 pseudogene transcripts identified (Table 2 ).
In laryngeal cancer (n = 98), HERC2P3, SPATA31D5P, SPATA31C2, SLC25A51P1, MAGEB6P1, SPATA31C1, BAGE2, PNLIPRP2 (pancreatic lipase-related protein 2), ZNF733P and DNM1P47 were found to be the 10 most deregulated of 287 pseudogene transcripts identified (Table 2 ).
Only one pseudogene identified in our analysis, DPY19L2P1, has already been associated with HNC. DPY19L2P1 was considered an independent prognosis predictor of laryngeal cancer, where its higher expression was associated with the worst OS, although the exact mechanism was not explored [36]. In our analysis, DPY19L2P1 was included in the ten most deregulated pseudogenes in oropharyngeal and hypopharyngeal cancers. However, it was identified only as the 54th most deregulated pseudogene in laryngeal cancer, and its prognostic value could not be evaluated. Other described pseudogenes have already been associated with carcinogenesis, although the exact mechanisms were not reported or detailed in most studies. HERC2P3 upregulation was associated with gastric cancer cell growth and migration by interacting with the Akt signaling pathway [44]. BAGE2 was related to the tumor-specific antigen profile [45]. FOLH1B was found to be involved in metallopeptidase activity, and its upregulation was associated with aggressiveness and metastasis in prostate cancer [46]. BNIP3P1 upregulation was found in breast cancer brain metastases [47]. PKD1L2 upregulation was associated with a good prognosis in breast cancer patients [48] and colorectal cancer risk and poor survival in obese patients [49]. POTEA upregulation was associated with increased colorectal cancer risk [50]. MSL3P1 upregulation was considered a non-invasive biomarker of renal cell carcinoma [51]. HLA-H upregulation was associated with cervical [52] and lung [53] carcinomas. GBA3 lower expression was associated with poor prognosis of hepatocellular carcinoma patients [54]. MST1P2, binding to miR-133b, affected the chemoresistance of bladder cancer cells to cisplatin-based therapy [55] and promoted cervical cancer progression [56]. PNLIPRP2 lower expression was found in pancreatic ductal adenocarcinoma [57].
We also identified 993 somatic genetic alterations in the 370 pseudogene transcripts identified in HNC, and SNV was the most common type (96.8%), followed by deletions (1.9%) and insertions (1.3%). The genetic variations of the 31 most deregulated pseudogenes from HNC and its subtypes. The pseudogenes SPATA31D5P, HERC2P3, MAGEB6P1, SPATA31C2, SPATA31C1, SLC25A51P1, BAGE2, HSP90AB2P, OR2W5 and REG1P were the most genetically altered by several SNVs in the HNC patients.
From these identified pseudogenes, only BAGE2 was already studied for genomic mutation profile and its copy number variation may be associated with the Robertsonian Down syndrome [58]. Pseudogenes’ genetic alterations, their potential of interfering in pseudogene transcription, and carcinogenesis have not been explored in the literature yet.
Table 2. Most deregulated pseudogene transcripts in head and neck cancer patients identified from The Cancer Genome Atlas (TCGA) database, chromosome location, gene family function, and studies in cancer.
| Tumor Location and Pseudogene Transcript | Chromosome Location | Gene Family Function | Studies in Cancer | Reference |
|---|---|---|---|---|
| Head and neck (n = 219) | ||||
| SPATA31D5P | 9q21.32 | UV response and DNA repair | None | [59] |
| HERC2P3 | 15q11.1 | Cell growth and migration | Gastric | [44] |
| SPATA31C2 | 9q22.1 | UV response and DNA repair | None | [59] |
| MAGEB6P1 | Xp21.3 | Tumor-specific antigen | None | [60] |
| SLC25A51P1 | 6q12 | Mitochondrial NAD+ transporter | None | [61] |
| BAGE2 | 21p11.2 | Tumor-specific antigen | Lung, colon, and breast | [62] |
| DNM1P47 | 15q26.3 | Mitochondrial division | None | [63] |
| SPATA31C1 | 9q22.1 | UV response and DNA repair | None | [59] |
| ZNF733P | 7q11.21 | Transcription factor | None | [64] |
| OR2W5 | 1q44 | Cellular signaling | None | [65] |
| Oral cavity (n = 62) | ||||
| SPATA31D5P | 9q21.32 | UV response and DNA repair | None | [59] |
| NBPF25P | 1q21.1 | Neuronal modulation | None | [66] |
| HSP90AB2P | 4p15.33 | Cell proteostasis | None | [67] |
| NXF4 | Xq22.1 | RNA export from nucleus | None | [68] |
| FOLH1B | 11q14.3 | Metallopeptidase activity | Prostate | [46] |
| DNM1P47 | 15q26.3 | Mitochondrial division | None | [63] |
| BNIP3P1 | 14q12 | Autophagy and apoptosis | Breast cancer brain metastases | [47] |
| PKD1L2 | 16q23.2 | Transmembrane protein | Colorectal and breast | [48][49] |
| BAGE2 | 21p11.2 | Tumor-specific antigen | Lung, colon, and breast | [62] |
| ZNF658B | 9p12 | Transcription factor | None | [69] |
| Oropharynx (n = 51) | ||||
| POTEA | 8p11.1 | Apoptosis | Colorectal | [50] |
| MROH5 | 8q24.3 | Uncertain | None | |
| MSL3P1 | 2q37.1 | Transcription regulation | Renal and gastric | [51][70] |
| HLA-H | 6p22.1 | Immune homeostasis | Cervical and lung | [52][53] |
| TUBB8P7 | 16q24.3 | Oocyte maturation | None | [71] |
| SLC7A5P2 | 16p12.2 | Amino acid transporter | None | [72] |
| DPY19L2P1 | 7p14.2 | Transmembrane protein | Larynx | [36] |
| TSSC2 | 11p15.4 | Tumor suppressor | None | [73] |
| SPATA31C2 | 9q22.1 | UV response and DNA repair | None | [59] |
| NXF4 | Xq22.1 | RNA export from nucleus | None | [68] |
| Hypopharynx (n = 8) | ||||
| DPY19L2P3 | 7p14.3 | Transmembrane protein | None | [36] |
| SPATA31D5P | 9q21.32 | UV response and DNA repair | None | [59] |
| GBA3 | 4p15.2 | Glucosylceramide hydrolysis | Liver | [54] |
| PLEKHM1P | 17q24.1 | Autophagy | None | [74] |
| DPY19L2P1 | 7p14.2 | Transmembrane protein | Larynx | [36] |
| MST1P2 | 1p36.13 | Cell invasion and apoptosis | Bladder and cervical | [55][56] |
| RP11-44F14.1 | 16q12.2 | Unknown | None | |
| ADAM21P1 | 14q24.2 | Cell adhesion and proliferation | None | [75] |
| MAGEB6P1 | Xp21.3 | Tumor-specific antigen | None | [60] |
| OR12D2 | 6p22.1 | Cellular signaling | None | [65] |
| Larynx (n = 98) | ||||
| HERC2P3 | 15q11.1 | Cell growth and migration | Gastric | [44] |
| SPATA31D5P | 9q21.32 | UV response and DNA repair | None | [59] |
| SPATA31C2 | 9q22.1 | UV response and DNA repair | None | [59] |
| SLC25A51P1 | 6q12 | Mitochondrial NAD+ transporter | None | [61] |
| MAGEB6P1 | Xp21.3 | Tumor-specific antigen | None | [60] |
| SPATA31C1 | 9q22.1 | UV response and DNA repair | None | [59] |
| BAGE2 | 21p11.2 | Tumor-specific antigen | Lung, colon, and breast | [62] |
| PNLIPRP2 | 10q25.3 | Lipase activity | Pancreas | [57] |
| ZNF733P | 7q11.21 | Transcription factor | None | [64] |
| DNM1P47 | 15q26.3 | Mitochondrial division | None | [63] |
6.2. Co-Expression Networks and GO Enrichment Analysis
We performed co-expression network and GO enrichment analyses to map the relationship between pseudogenes and other genes in the genome. After analyzing 19,406 protein-coding genes and 31 pseudogenes, our co-expression networks contained 14,379 genes organized in 36 modules, with an average of 399 genes per module (median: 140 genes; range: 35–3645 genes;).
From the 31 most deregulated pseudogenes from HNC and its subtypes, 14 of them (SPATA31D5P, SPATA31C2, DNM1P47, NBPF25P, HSP90AB2P, NXF4, ZNF658B, POTEA, MROH5, HLA-H, DPY19L2P1, DPY19L2P3, GBA3, and PNLIPRP2) were present in our network across 8 modules (light yellow, red, dark magenta, orange, black, salmon, ivory, and dark olive green). Although the other pseudogenes of interest did not show a co-expression profile similar enough to other genes to be assigned to a module according to the parameters used to build this network, they are still important for further studies in HNC based on our previous TCGA data analysis.
We chose to highlight three modules (light yellow, red, and dark magenta) that contain genes well-known to be involved in head and neck carcinogenesis based on two important reviews [76][77]. However, the other five modules also presented relevant gene associations that should be evaluated in further studies.
The light-yellow module contained the greatest number of pseudogenes (NBPF25P, HSP90AB2P, ZNF658B, and DPY19L2P3). Interestingly, this module also contains 12 genes known to participate in head and neck carcinogenesis (CASP8, involved in apoptosis; NOTCH2 and NOTCH3, involved in cell differentiation; TRAF3, involved in antiviral response; RB1 and HRAS, involved in cell cycle control and proliferation; PTEN, involved in apoptosis and cell cycle control; CUL3 and NFE2L2, involved in oxidative stress response; EP300, involved in chromatin remodeling, and the transcription factors IGF1R and TP63) [76][77], suggesting that these genes may directly or indirectly interact with the pseudogenes in this module and play a role in HNC (Figure 2A). In addition, the light-yellow module is enriched in GO terms related to tumor development, such as regulation of cell communication, cellular response to stress, and intracellular transport (Figure 2B). The potential relationship between the described pseudogenes and genes in this module has not been explored in the literature yet.
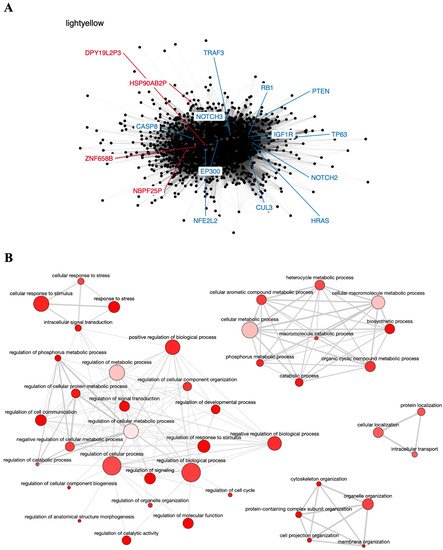
Figure 2. Co-expression network and GO enrichment analysis. Light-yellow module containing NBPF25P, HSP90AB2P, ZNF658B and DPY19L2P3 pseudogenes from co-expression network of 213 head and neck cancer (HNC) patients and gene ontology (GO) enrichment analysis. (A) Network highlighting pseudogenes (red letter) and HNC-related genes (blue letter) constructed using the Weighted Correlation Network Analysis (WGCNA) R software package. (B) Enriched GO terms identified by GOATOOLS Python library and summarized by the web tool REVIGO. Circles colored with darker red indicate GO terms with lower p-values in our enrichment analysis, while the size of the circles indicates the frequency of a GO term in the GO annotation database. GO terms that are highly similar have thicker lines.
The red module contains the pseudogene DNM1P47 and the tumor suppressor TP53 gene, mainly involved in cell cycle control and apoptosis [76][77] (Figure 3A), and is enriched in GO terms associated with regulation of cell proliferation, response to stress, and cell death (Figure 3B). The potential relationship between the DNM1P47 pseudogene and the TP53 gene has not been explored in the literature yet.
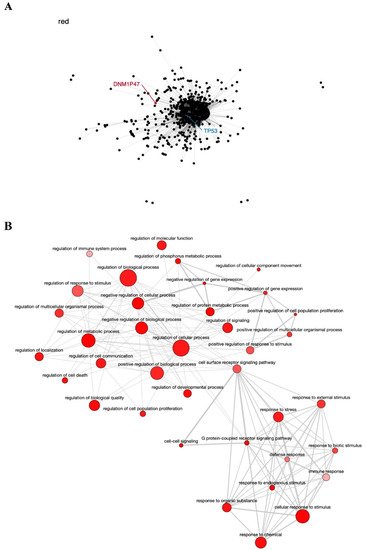
Figure 3. Co-expression network and GO enrichment analysis. Red module containing DNM1P47 pseudogene from co-expression network of 213 head and neck cancer (HNC) patients and gene ontology (GO) enrichment analysis. (A) Network highlighting pseudogene (red letter) and HNC-related gene (blue letter) constructed using the Weighted Correlation Network Analysis (WGCNA) R software package. (B) Enriched GO terms identified by GOATOOLS Python library and summarized by the web tool REVIGO. Circles colored with darker red indicate GO terms with lower p-values in our enrichment analysis, while the size of the circles indicates the frequency of a GO term in the GO annotation database. GO terms that are highly similar have thicker lines.
The dark magenta module contains the known tumor genes HLA-A and HLA-B, involved in immune response [77], very closely associated with the HLA-H pseudogene (Figure 4A), and is also enriched in GO terms important to cancer biology, such as cell proliferation, regulation of the immune system, regulation of gene expression, and Wnt signaling pathway (Figure 4B). The relationship of the HLA-H pseudogene and HLA-A and HLA-B genes has been described in the literature, and even related to lung cancer in the Asian population [53]. The SNV rs12333226, capable of modulating HLA-A and HLA-H expression levels, was suggested to exert an effect on lung cancer through these two immune-related genes and the pseudogene [53].
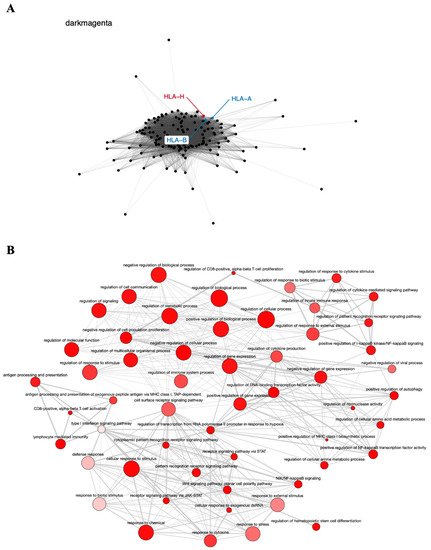
Figure 4. Co-expression network and GO enrichment analysis. Dark magenta module containing HLA-H pseudogene from co-expression network of 213 head and neck cancer (HNC) patients and gene ontology (GO) enrichment analysis. (A) Network highlighting pseudogene (red letter) and HNC-related genes (blue letter) constructed using the Weighted Correlation Network Analysis (WGCNA) R software package. (B) Enriched GO terms identified by GOATOOLS Python library and summarized by the web tool REVIGO. Circles colored with darker red indicate GO terms with lower p-values in our enrichment analysis, while the size of the circles indicates the frequency of a GO term in the GO annotation database. GO terms that are highly similar have thicker lines.
The other five modules consist of an orange module containing DPY19L2P1, a black module containing NXF4, MROH5, and SPATA31D5P, a salmon module containing PNLIPRP2, an ivory module containing SPATA31C2, and a dark olive-green module containing POTEA and GBA3 pseudogenes.
6.3. Survival Analysis
To investigate the prognostic value of the pseudogenes identified by the TCGA database in HNC, we assessed the online database The Kaplan–Meier Plotter. In this analysis, only the prognostic value of the ten most deregulated pseudogenes identified in HNC general samples was assessed (SPATA31D5P, HERC2P3, SPATA31C2, MAGEB6P1, SLC25A51P1, BAGE2, DNM1P47, SPATA31C1, ZNF733P and OR2W5) because the online database does not allow to stratify the patients by tumor location.
We observed that lower expression of SPATA31D5P, SPATA31C2, BAGE2, SPATA31C1, ZNF733P and OR2W5 pseudogene transcripts was associated with the worst RFS of HNC patients. Patients with lower expression presented 2.56, 2.63, 2.33, 3.57, 3.03, and 3.03 more chances respectively, to relapse, compared to other patients (Figure 5A).
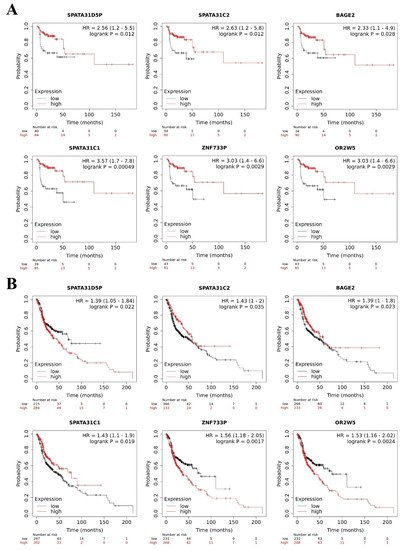
Figure 5. Pseudogene transcripts and head and neck cancer (HNC) patients’ survival. Prognostic value of deregulated pseudogene transcripts in HNC patients by Kaplan–Meier Plotter online database. (A) Lower expression of SPATA31D5P, SPATA31C2, BAGE2, SPATA31C, ZNF733P and OR2W5 pseudogene transcripts indicated worst relapse-free survival in HNC patients. (B) Higher expression of SPATA31D5P, ZNF733P, and OR2W5 pseudogene transcripts and lower expression of SPATA31C2, BAGE2 and SPATA31C1 pseudogene transcripts were associated with worst overall survival of HNC patients.
In addition, we observed that higher expression of SPATA31D5P, ZNF733P and OR2W5 pseudogene transcripts was associated with the worst OS of HNC patients. Patients with higher expression presented 1.39, 1.56, and 1.53 more chances respectively, of dying, compared to other patients. Moreover, lower expression of SPATA31C2, BAGE2 and SPATA31C1 pseudogene transcripts was associated with the worst OS of HNC patients. Patients with lower expression presented 1.43, 1.39, and 1.43 more chances respectively, of dying, compared to other patients (Figure 5B). MAGEB6P1, SLC25A51P1 and DNM1P47 pseudogene transcripts were not available in The Kaplan–Meier Plotter database, so we could not perform survival analysis. The HERC2P3 pseudogene transcript did not influence RFS or OS in the HNC patients. However, in the literature, HERC2P3 upregulation was associated with cell migration in gastric cancer, an independent prognosis factor [44]. The prognostic values of SPATA31D5P, SPATA31C2, BAGE2, SPATA31C1, ZNF733P and OR2W5 have not been explored in the literature yet.
7. Conclusions
The biology of cancer is complex and not fully understood so far. Pseudogenes lost the label of “junk DNA” and are now known to be modulators of gene expression and potential biomarkers for cancer risk and prognosis [12]. Pseudogene transcripts regulate gene expression by directly binding at the target mRNA or by functioning as miRNA sponges, impeding miRNA–target mRNA binding [20]. Thus, pseudogene transcripts can function as negative or positive gene regulators [20].
In HNC, some pseudogene transcripts have been studied and associated with tumor aggressiveness, HPV16 infection, and prognosis [24][25][26][27][28]. However, their role in HNC remains poorly explored, while patients’ therapy resistance and poor survival rates highlight the need of finding novel molecular biomarkers. In our in silico analysis, we identified potential pseudogene transcripts, their genetic alterations, their interactions, and potential pathways in HNC progression and prognostics. Therefore, this study can guide new research to HNC understanding and development of new target therapies.
References
- Bray, F.; Me, J.F.; Soerjomataram, I.; Siegel, R.L.; Torre, L.A.; Jemal, A. Global cancer statistics 2018: GLOBOCAN estimates of incidence and mortality worldwide for 36 cancers in 185 countries. CA A Cancer J. Clin. 2018, 68, 394–424.
- Belcher, R.; Hayes, K.; Fedewa, S.; Chen, A.Y. Current treatment of head and neck squamous cell cancer. J. Surg. Oncol. 2014, 110, 551–574.
- Mendenhall, W.; Werning, J.; Pfister, D. Treatment of head and neck cancers. In Cancer: Principles & Practice of Oncology, 9th ed.; DeVita, V.T., Lawrence, T.S., Rosenberg, S.A., Eds.; Lippincott Williams & Wilkins: Philadelphia, PA, USA, 2011; pp. 729–780.
- Dayyani, F.; Etzel, C.J.; Liu, M.; Ho, C.-H.; Lippman, S.M.; Tsao, A.S. Meta-analysis of the impact of human papillomavirus (HPV) on cancer risk and overall survival in head and neck squamous cell carcinomas (HNSCC). Head Neck Oncol. 2010, 2, 15.
- O’Sullivan, B.; Huang, S.H.; Su, J.; Garden, A.; Sturgis, E.M.; Dahlstrom, K.; Lee, N.; Riaz, N.; Pei, X.; Koyfman, S.A.; et al. Development and validation of a staging system for HPV-related oropharyngeal cancer by the International Collaboration on Oropharyngeal cancer Network for Staging (ICON-S): A multicentre cohort study. Lancet Oncol. 2016, 17, 440–451.
- Siu, L.L.; Waldron, J.N.; Chen, B.E.; Winquist, E.; Wright, J.R.; Nabid, A.; Parulekar, W.R. Effect of Standard Radiotherapy With Cisplatin vs Accelerated Radiotherapy With Panitumumab in Locoregionally Advanced Squamous Cell Head and Neck Carcinoma: A Randomized Clinical Trial. JAMA Oncol. 2017, 3, 220–226.
- Bussmann, L.; Busch, C.-J.; Lörincz, B.B.; Rieckmann, T.; Block, A.R.; Knecht, R. Perspectives in chemosensitivity and chemoresistance assays and their implementation in head and neck cancer. Eur. Arch. Otorhinolaryngol. 2016, 273, 4073–4080.
- Lacko, M.; Braakhuis, B.J.; Sturgis, E.M.; Boedeker, C.C.; Suárez, C.; Rinaldo, A.; Ferlito, A.; Takes, R.P. Genetic Susceptibility to Head and Neck Squamous Cell Carcinoma. Int. J. Radiat. Oncol. 2014, 89, 38–48.
- Bakhtiar, S.M.; Ali, A.; Barh, D. Epigenetics in Head and Neck Cancer. Methods Mol. Biol. 2014, 1238, 751–769.
- Jacq, C.; Miller, J.R.; Brownlee, G.G. A pseudogene structure in 5S DNA of Xenopus laevis. Cell 1977, 12, 109–120.
- Tutar, Y. Pseudogenes. Comp. Funct. Genomics 2012, 2012, 424526.
- Singh, R.K.; Singh, D.; Yadava, A.; Srivastava, A.K. Molecular fossils “pseudogenes” as functional signature in biological system. Genes Genom. 2020, 42, 619–630.
- Balakirev, E.S.; Ayala, F.J. Pseudogenes: Are they “junk” or functional DNA? Annu. Rev. Genet. 2003, 37, 123–151.
- Vinckenbosch, N.; Dupanloup, I.; Kaessmann, H. Evolutionary fate of retroposed gene copies in the human genome. Proc. Natl. Acad. Sci. USA 2006, 103, 3220–3225.
- Pan, Y.; Sun, C.; Huang, M.; Liu, Y.; Qi, F.; Liu, L.; Wen, J.; Liu, J.; Xie, K.; Ma, H.; et al. A genetic variant in pseudogene E2F3P1 contributes to prognosis of hepatocellular carcinoma. J. Biomed. Res. 2014, 28, 194–200.
- Lynn, H.; Sun, X.; Ayshiev, D.; Siegler, J.H.; Rizzo, A.N.; Karnes, J.H.; Gonzalez-Garay, M.; Wang, T.; Casanova, N.; Camp, S.M.; et al. Single nucleotide polymorphisms in the MYLKP1 pseudogene are associated with increased colon cancer risk in African Americans. PLoS ONE 2018, 13, e0200916.
- Ma, G.; Liu, H.; Du, M.; Zhang, G.; Lin, Y.; Ge, Y.; Wang, M.; Jin, G.; Zhao, Q.; Chu, H.; et al. A genetic variation in the CpG island of pseudogene GBAP1 promoter is associated with gastric cancer susceptibility. Cancer 2019, 125, 2465–2473.
- Poliseno, L. Pseudogenes: Newly Discovered Players in Human Cancer. Sci. Signal. 2012, 5, re5.
- Hu, X.; Yang, L.; Mo, Y.-Y. Role of Pseudogenes in Tumorigenesis. Cancers 2018, 10, 256.
- Xiao-Jie, L.; Ai-Mei, G.; Li-Juan, J.; Jiang, X. Pseudogene in cancer: Real functions and promising signature. J. Med. Genet. 2014, 52, 17–24.
- Poliseno, L.; Salmena, L.; Zhang, J.; Carver, B.; Haveman, W.J.; Pandolfi, P.P. A coding-independent function of gene and pseudogene mRNAs regulates tumour biology. Nat. Cell Biol. 2010, 465, 1033–1038.
- Russo, F.; Fiscon, G.; Conte, F.; Rizzo, M.; Paci, P.; Pellegrini, M. Interplay Between Long Noncoding RNAs and MicroRNAs in Cancer. Methods Mol. Biol. 2018, 1819, 75–92.
- Conte, F.; Fiscon, G.; Sibilio, P.; Licursi, V.; Paci, P. An Overview of the Computational Models Dealing with the Regulatory ceRNA Mechanism and ceRNA Deregulation in Cancer. Breast Cancer 2021, 2324, 149–164.
- Xing, L.; Zhang, X.; Guo, M.; Zhang, X.; Liu, F. Application of Machine Learning in Developing a Novelty Five-Pseudogene Signature to Predict Prognosis of Head and Neck Squamous Cell Carcinoma: A New Aspect of “Junk Genes” in Biomedical Practice. DNA Cell Biol. 2020, 39, 709–723.
- Liu, J.; Xing, Y.; Xu, L.; Chen, W.; Cao, W.; Zhang, C. Decreased expression of pseudogene PTENP1 promotes malignant behaviours and is associated with the poor survival of patients with HNSCC. Sci. Rep. 2017, 7, 41179.
- Yang, Y.-F.; Feng, L.; Shi, Q.; Ma, H.-Z.; He, S.-Z.; Hou, L.-Z.; Wang, R.; Fang, J.-G. Silencing novel long non-coding RNA FKBP9P1 represses malignant progression and inhibits PI3K/AKT signaling of head and neck squamous cell carcinoma in vitro. Chin. Med. J. 2020, 133, 2037–2043.
- Grzechowiak, I.; Graś, J.; Szymańska, D.; Biernacka, M.; Guglas, K.; Poter, P.; Kolenda, T. The oncogenic roles of PTTG1 and PTTG2 Genes and Pseudogene PTTG3P in Head and Neck Squamous Cell Carcinomas. Diagnostics 2020, 10, 606.
- Salyakina, D.; Tsinoremas, N.F. Non-coding RNAs profiling in head and neck cancers. Npj. Genom. Med. 2016, 1, 15004.
- Zhang, S.; Tian, L.; Ma, P.; Sun, Q.; Zhang, K.; Wang, G.; Liu, H.; Xu, B. Potential role of differentially expressed lncRNAs in the pathogenesis of oral squamous cell carcinoma. Arch. Oral Biol. 2015, 60, 1581–1587.
- Zhang, C.-Z. Long non-coding RNA FTH1P3 facilitates oral squamous cell carcinoma progression by acting as a molecular sponge of miR-224-5p to modulate fizzled 5 expression. Gene 2017, 607, 47–55.
- Liu, M.; Gao, X.; Liu, C.-L. Increased expression of lncRNA FTH1P3 promotes oral squamous cell carcinoma cells migration and invasion by enhancing PI3K/Akt/GSK3b/ Wnt/β-catenin signaling. Eur. Rev. Med. Pharmacol. Sci. 2018, 22, 8306–8314.
- Gao, L.; Ren, W.; Zhang, L.; Li, S.; Kong, X.; Zhang, H.; Dong, J.; Cai, G.; Jin, C.; Zheng, D.; et al. PTENp1, a natural sponge of miR-21, mediates PTEN expression to inhibit the proliferation of oral squamous cell carcinoma. Mol. Carcinog. 2016, 56, 1322–1334.
- Palumbo, A., Jr.; De Martino, M.; Esposito, F.; Fraggetta, F.; Neto, P.N.; Fernandes, P.V.; Santos, I.C.; Dias, F.L.; Nasciutti, L.E.; Da Costa, N.M.; et al. HMGA2, but not HMGA1, is overexpressed in human larynx carcinomas. Histopathology 2017, 72, 1102–1114.
- Feenstra, M.; Bakema, J.; Verdaasdonk, M.; Rozemuller, E.; Tweel, J.V.D.; Slootweg, P.; de Weger, R.; Tilanus, M. Detection of a putativeHLA-A*31012 processed (intronless) pseudogene in a laryngeal squamous cell carcinoma. Genes Chromosom. Cancer 2000, 27, 26–34.
- Yuan, H.; Jiang, H.; Wang, Y.; Dong, Y. Increased expression of lncRNA FTH1P3 predicts a poor prognosis and promotes aggressive phenotypes of laryngeal squamous cell carcinoma. Biosci. Rep. 2019, 39.
- Zhang, G.; Fan, E.; Yue, G.; Zhong, Q.; Shuai, Y.; Wu, M.; Feng, G.; Chen, Q.; Gou, X. Five genes as a novel signature for predicting the prognosis of patients with laryngeal cancer. J. Cell. Biochem. 2019, 121, 3804–3813.
- Eisen, M.; Spellman, P.T.; Brown, P.O.; Botstein, D. Cluster analysis and display of genome-wide expression patterns. Proc. Natl. Acad. Sci. USA 1998, 95, 14863–14868.
- Langfelder, P.; Horvath, S. WGCNA: An R package for weighted correlation network analysis. BMC Bioinform. 2008, 9, 1–13.
- Zhang, B.; Horvath, S. A General Framework for Weighted Gene Co-Expression Network Analysis. Stat. Appl. Genet. Mol. Biol. 2005, 4, 1–43.
- Klopfenstein, D.V.; Zhang, L.; Pedersen, B.S.; Ramírez, F.; Vesztrocy, A.W.; Naldi, A.; Mungall, C.J.; Yunes, J.M.; Botvinnik, O.; Weigel, M.; et al. GOATOOLS: A Python library for Gene Ontology analyses. Sci. Rep. 2018, 8, 1–17.
- Supek, F.; Bošnjak, M.; Škunca, N.; Smuc, T. REVIGO summarizes and visualizes long lists of gene ontology terms. PLoS ONE 2011, 6, e21800.
- Nagy, Á.; Munkácsy, G.; Győrffy, B. Pancancer survival analysis of cancer hallmark genes. Sci. Rep. 2021, 11, 1–10.
- Johnson, D.E.; Burtness, B.; Leemans, C.R.; Lui, V.W.Y.; Bauman, J.E.; Grandis, J.R. Head and neck squamous cell carcinoma. Nat. Rev. Dis. Primers 2020, 6, 92.
- Chen, J.; Cai, H.; Xie, Y.; Jiang, H. Targeting long non-coding RNA HERC2P3 inhibits cell growth and migration in human gastric cancer cells. Int. J. Clin. Exp. Pathol. 2017, 10, 7632–7639.
- Brun, M.-E.; Ruault, M.; Ventura, M.; Roizès, G.; De Sario, A. Juxtacentromeric region of human chromosome 21: A boundary between centromeric heterochromatin and euchromatic chromosome arms. Gene 2003, 312, 41–50.
- Zhang, Z.; Wu, H.; Zhou, H.; Gu, Y.; Bai, Y.; Yu, S.; An, R.; Qi, J. Identification of potential key genes and high-frequency mutant genes in prostate cancer by using RNA-Seq data. Oncol. Lett. 2018, 15, 4550–4556.
- Schulten, H.-J.; Bangash, M.; Karim, S.; Dallol, A.; Hussein, D.; Merdad, A.; Althoubaity, F.; Al-Maghrabi, J.; Jamal, A.; Al-Ghamdi, F.; et al. Comprehensive molecular biomarker identification in breast cancer brain metastases. J. Transl. Med. 2017, 15, 1–20.
- Qi, L.; Yao, Y.; Zhang, T.; Feng, F.; Zhou, C.; Xu, X.; Sun, C. A four-mRNA model to improve the prediction of breast cancer prognosis. Gene 2019, 721, 144100.
- Park, C.; Kim, J.-I.; Hong, S.N.; Jung, H.M.; Kim, T.J.; Lee, S.; Kim, S.J.; Kim, H.C.; Kim, D.-H.; Cho, B.; et al. A copy number variation in PKD1L2 is associated with colorectal cancer predisposition in korean population. Int. J. Cancer 2016, 140, 86–94.
- Jiao, X.; Liu, W.; Mahdessian, H.; Bryant, P.; Ringdahl, J.; Timofeeva, M.; Farrington, S.M.; Dunlop, M.; Lindblom, A. Recurrent, low-frequency coding variants contributing to colorectal cancer in the Swedish population. PLoS ONE 2018, 13, e0193547.
- Chen, B.; Wang, C.; Zhang, J.; Zhou, Y.; Hu, W.; Guo, T. New insights into long noncoding RNAs and pseudogenes in prognosis of renal cell carcinoma. Cancer Cell Int. 2018, 18, 1–12.
- Roychowdhury, A.; Samadder, S.; Das, P.; Mazumder, D.I.; Chatterjee, A.; Addya, S.; Mondal, R.; Roy, A.; Roychoudhury, S.; Panda, C.K. Deregulation of H19 is associated with cervical carcinoma. Genomics 2019, 112, 961–970.
- Qin, N.; Wang, C.; Zhu, M.; Lu, Q.; Ma, Z.; Huang, M.; Dai, J.; Ma, H.; Jin, G.; Hu, Z.; et al. Fine-mapping the MHC region in Asian populations identified novel variants modifying susceptibility to lung cancer. Lung Cancer 2017, 112, 169–175.
- Ying, J.F.; Zhang, Y.N.; Song, S.S.; Hu, Z.M.; He, X.L.; Pan, H.Y.; Zhang, C.W.; Wang, H.J.; Li, W.F.; Mou, X.Z. Decreased expression of GBA3 correlates with a poor prognosis in hepatocellular carcinoma patients. Neoplasma 2020, 67.
- Chen, J.; Li, Y.; Li, Z.; Cao, L. LncRNA MST1P2/miR-133b axis affects the chemoresistance of bladder cancer to cisplatin-based therapy via Sirt1/p53 signaling. J. Biochem. Mol. Toxicol. 2020, 34, e22452.
- Xu, R.; Zhang, X.; Xu, Y.; Wang, J.; Li, Z.; Cui, X. Long noncoding RNA MST1P2 promotes cervical cancer progression by sponging with microRNA miR-133b. Bioengineered 2021, 12, 1851–1860.
- Li, Y.; Zhu, Y.; Dai, G.; Wu, D.; Gao, Z.; Zhang, L.; Fan, Y. Screening and validating the core biomarkers in patients with pancreatic ductal adenocarcinoma. Math. Biosci. Eng. 2020, 17, 910–927.
- Shaw, S.-W.; Chen, C.-P.; Cheng, P.-J.; Wang, T.-H.; Hou, J.-W.; Lin, C.-T.; Chang, S.-D.; Hwa, H.-L.; Lin, J.-L.; Chao, A.-S.; et al. Gene dosage change of TPTE and BAGE2 and breakpoint analysis in Robertsonian Down syndrome. J. Hum. Genet. 2007, 53, 136–143.
- Bekpen, C.; Xie, C.; Nebel, A.; Tautz, D. Involvement of SPATA31 copy number variable genes in human lifespan. Aging 2018, 10, 674–688.
- Zamunér, F.T.; Karia, B.T.; de Oliveira, C.Z.; Santos, C.R.; Carvalho, A.L.; Vettore, A.L. A Comprehensive Expression Analysis of Cancer Testis Antigens in Head and Neck Squamous Cell Carcinoma Revels MAGEA3/6 as a Marker for Recurrence. Mol. Cancer Ther. 2015, 14, 828–834.
- Luongo, T.S.; Eller, J.M.; Lu, M.-J.; Niere, M.; Raith, F.; Perry, C.; Bornstein, M.R.; Oliphint, P.; Wang, L.; McReynolds, M.R.; et al. SLC25A51 is a mammalian mitochondrial NAD. Nat. Cell Biol. 2020, 588, 174–179.
- Yamada, R.; Takahashi, A.; Torigoe, T.; Morita, R.; Tamura, Y.; Tsukahara, T.; Kanaseki, T.; Kubo, T.; Watarai, K.; Kondo, T.; et al. Preferential expression of cancer/testis genes in cancer stem-like cells: Proposal of a novel sub-category, cancer/testis/stem gene. Tissue Antigens 2013, 81, 428–434.
- Imoto, Y.; Itoh, K.; Fujiki, Y. Molecular Basis of Mitochondrial and Peroxisomal Division Machineries. Int. J. Mol. Sci. 2020, 21, 5452.
- Cassandri, M.; Smirnov, A.; Novelli, F.; Pitolli, C.; Agostini, M.; Malewicz, M.; Melino, G.; Raschellà, G. Zinc-finger proteins in health and disease. Cell Death Discov. 2017, 3, 17071.
- Flegel, C.; Manteniotis, S.; Osthold, S.; Hatt, H.; Gisselmann, G. Expression Profile of Ectopic Olfactory Receptors Determined by Deep Sequencing. PLoS ONE 2013, 8, e55368.
- Wu, H.; Zhai, L.T.; Guo, X.X.; Rety, S.; Xi, X.G. The N-terminal of NBPF15 causes multiple types of aggregates and mediates phase transition. Biochem. J. 2020, 477, 445–458.
- Gulla, A.; Kazlauskas, E.; Liang, H.; Strupas, K.; Petrauskas, V.; Matulis, D.; Eshleman, J.R. Heat Shock Protein 90 Inhibitor Effects on Pancreatic Cancer Cell Cultures. Pancreas 2021, 50, 625–632.
- Tan, W.; Zolotukhin, A.S.; Tretyakova, I.; Bear, J.; Lindtner, S.; Smulevitch, S.V.; Felber, B.K. Identification and characterization of the mouse nuclear export factor (Nxf) family members. Nucleic Acids Res. 2005, 33, 3855–3865.
- Francis, M.; Cheng, H.; Ma, P.; Grider, A. Genomic Characterization of the Zinc Transcriptional Regulatory Element Reveals Potential Functional Roles of ZNF658. Biol. Trace Element Res. 2019, 192, 83–90.
- Tanabe, S.; Quader, S.; Ono, R.; Cabral, H.; Aoyagi, K.; Hirose, A.; Yokozaki, H.; Sasaki, H. Molecular Network Profiling in Intestinal—and Diffuse—Type Gastric Cancer. Cancers 2020, 12, 3833.
- Zheng, W.; Hu, H.; Zhang, S.; Xu, X.; Gao, Y.; Gong, F.; Lu, G.; Lin, G. The comprehensive variant and phenotypic spectrum of TUBB8 in female infertility. J. Assist. Reprod. Genet. 2021, 1–12.
- Nachef, M.; Ali, A.K.; Almutairi, S.M.; Lee, S.-H. Targeting SLC1A5 and SLC3A2/SLC7A5 as a Potential Strategy to Strengthen Anti-Tumor Immunity in the Tumor Microenvironment. Front. Immunol. 2021, 12, 624324.
- Hu, R.-J.; Lee, M.P.; Connors, T.D.; Johnson, L.A.; Burn, T.C.; Sub, K.; Landes, G.M.; Feinberg, A. A 2.5-Mb Transcript Map of a Tumor-Suppressing Subchromosomal Transferable Fragment from 11p15.5, and Isolation and Sequence Analysis of Three Novel Genes. Genomics 1997, 46, 9–17.
- Gubas, A.; Karantanou, C.; Popovic, D.; Tascher, G.; Hoffmann, M.E.; Platzek, A.; Dawe, N.; Dikic, I.; Krause, D.S.; McEwan, D.G. The endolysosomal adaptor PLEKHM1 is a direct target for both mTOR and MAPK pathways. FEBS Lett. 2021, 595, 864–880.
- Rocks, N.; Paulissen, G.; El Hour, M.; Quesada, F.; Crahay, C.; Gueders, M.; Foidart, J.; Noel, A.; Cataldo, D. Emerging roles of ADAM and ADAMTS metalloproteinases in cancer. Biochimie 2008, 90, 369–379.
- Riaz, N.; Morris, L.G.; Lee, W.; Chan, T.A. Unraveling the molecular genetics of head and neck cancer through genome-wide approaches. Genes Dis. 2014, 1, 75–86.
- Network CGA. Comprehensive genomic characterization of head and neck squamous cell carcinomas. Nature 2015, 517, 576–582.
More
Information
Subjects:
Genetics & Heredity; Oncology
Contributor
MDPI registered users' name will be linked to their SciProfiles pages. To register with us, please refer to https://encyclopedia.pub/register
:
View Times:
728
Revisions:
3 times
(View History)
Update Date:
29 Mar 2022
Table of Contents


Notice
You are not a member of the advisory board for this topic. If you want to update advisory board member profile, please contact office@encyclopedia.pub.
OK
Confirm
Only members of the Encyclopedia advisory board for this topic are allowed to note entries. Would you like to become an advisory board member of the Encyclopedia?
Yes
No
${ textCharacter }/${ maxCharacter }
Submit
Cancel
Back
Comments
${ item }
|
${ item.createdUser.fullName }
${ item.createdAt }
${ item.vote }
${ item.reply }
Delete
${ reply.createdUser.fullName }
${ reply.createdAt }
${ reply.vote }
Delete
There is no reply to this comment~
${ item.replyTextCharacter }/${ item.replyMaxCharacter }
Submit
Cancel
More
No more~
There is no comment~
${ textCharacter }/${ maxCharacter }
Submit
Cancel
${ selectedItem.replyTextCharacter }/${ selectedItem.replyMaxCharacter }
Submit
Cancel
Confirm
Are you sure to Delete?
Yes
No