| Version | Summary | Created by | Modification | Content Size | Created at | Operation |
|---|---|---|---|---|---|---|
| 1 | Dennis A. Hansell | + 1420 word(s) | 1420 | 2021-09-03 08:38:25 | | | |
| 2 | Lindsay Dong | Meta information modification | 1420 | 2021-09-06 03:56:10 | | |
Video Upload Options
Marine dissolved organic matter (DOM) holds ~660 billion metric tons of carbon, making it one of Earth’s major carbon reservoirs that is exchangeable with the atmosphere on annual to millennial time scales. The global ocean scale dynamics of the pool have become better illuminated over the past few decades.
1. Introduction
2. DOC Concentrations and Reactivity

3. Global Distribution
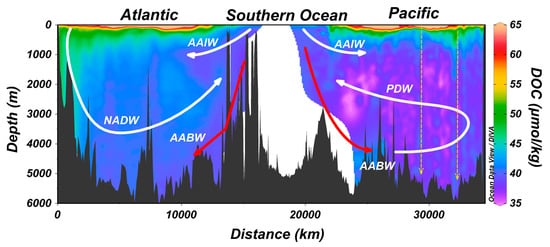
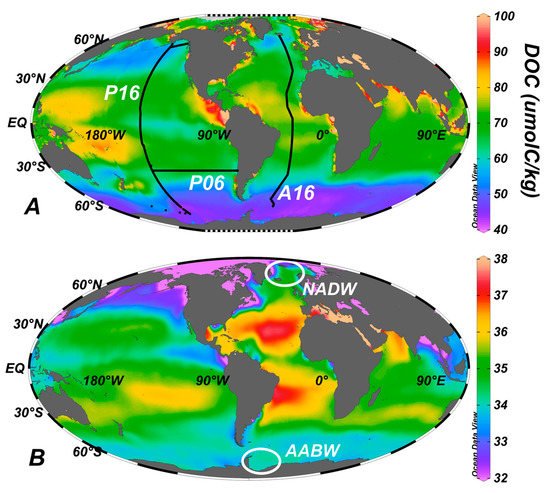
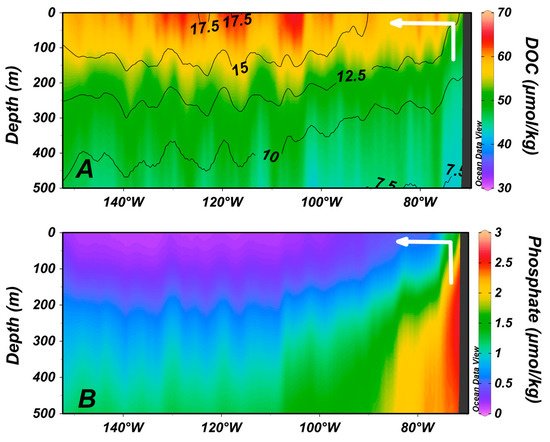
There are two important perspectives taken when considering the distribution of DOC in the global ocean [1]. The first is in the wind driven upper layers; the wind forcing of the water column is at its strongest up to ~200 m depth, but it is still significant to depths up of 1000 m in some locations. The second is at greater depths (the deep ocean).
The distribution of DOC in the upper ocean is given in Figure 2.

4. Zones of Net DOC Production

5. Export of Surface Accumulated DOC to Depth with the Ocean’s Overturning Circulation
6. Zones of Deep Ocean DOC Enrichment Due to Sinking Biogenic Particles
7. Composition of Ocean Dissolved Organic Matter
Dissolved organic matter (DOM) in the ocean can be categorized into two fractions based on radiocarbon ages and molecular composition. The first fraction is freshly produced, phytoplankton-derived DOM that is largely composed of classical biomolecules of known building blocks, such as polysaccharides, proteins, and lipids [24]. This is the material that is initially released by autotrophs in the euphotic zone, leading to accumulation there, and it is the material released into the deeper water column by sinking particles.
The balance of oceanic DOC (97%) has a much greater radiocarbon age (>4000 years) and is absent in the classical biochemical character of the modern fraction. Most of the dissolved organic compounds in this older fraction have low molecular mass (<1000 Da) [25], and the chemical diversity is analytically challenging to characterize; the molecular structure of only a minor fraction of all of the compounds present is known.
References
- Hansell, D.A.; Carlson, C.A.; Repeta, D.J.; Schlitzer, R. Dissolved organic matter in the ocean: A controversy stimulates new insights. Oceanography 2009, 22, 202–211.
- Carlson, C.A.; Hansell, D.A. DOC sources, sinks and fluxes. In Biogeochemistry of Marine Dissolved Organic Matter, 2nd ed.; Elsevier: London, UK, 2014; pp. 65–126.
- Chin, W.C.; Orellana, M.V.; Verdugo, P. Spontaneous assembly of marine dissolved organic matter into polymer gels. Nature 1998, 391, 568–572.
- Orellana, M.V.; Matrai, P.A.; Leck, C.; Rauschenberg, C.D.; Lee, A.M.; Coz, E. Marine microgels as a source of cloud condensation nuclei in the high Arctic. Proc. Natl. Acad. Sci. USA 2011, 108, 13612–13617.
- Verdugo, P. Marine Microgels. In Annual Review of Marine Science; Annual Reviews: San Mateo, CA, USA, 2012; Volume 4, pp. 375–400.
- Orellana, M.V.; Leck, C. Marine Microgels. In Biogeochemistry of Marine Dissolved Organic Matter, 2nd ed.; Academic Press: Boston, MA, USA, 2015; pp. 451–480.
- Hansell, D.A. Recalcitrant Dissolved Organic Carbon Fractions. In Annual Review of Marine Science; Annual Reviews: San Mateo, CA, USA, 2013; Volume 5, pp. 421–445.
- Bauer, J.E.; Williams, P.M.; Druffel, E.R.M. C-14 Activity of dissolved organic carbon fractions in the North-central Pacific and Sargasso Sea. Nature 1992, 357, 667–670.
- Roshan, S.; DeVries, T. Efficient dissolved organic carbon production and export in the oligotrophic ocean. Nat. Commun. 2017, 8, 8.
- Schlitzer, R. Ocean Data View; Alfred Wegener Institute: Bremerhaven, Germany, 2021.
- Hansell, D.A.; Carlson, C.A.; Amon, R.M.W.; Álvarez-Salgado, X.A.; Yamashita, Y.; Romera-Castillo, C.; Bif, M.B. Compilation of Dissolved Organic Matter (DOM) Data Obtained from Global Ocean Observations from 1994 to 2020; NOAA National Centers for Environmental Information: Washington, DC, USA, 2021.
- Hansell, D.A.; Carlson, C.A. Net community production of dissolved organic carbon. Glob. Biogeochem. Cycles 1998, 12, 443–453.
- Bif, M.B.; Hansell, D.A. Seasonality of dissolved organic carbon in the upper northeast Pacific Ocean. Glob. Biogeochem. Cycles 2019, 33, 526–539.
- Romera-Castillo, C.; Letscher, R.T.; Hansell, D.A. New nutrients exert fundamental control on dissolved organic carbon accumulation in the surface Atlantic Ocean. Proc. Natl. Acad. Sci. USA 2016, 113, 10497–10502.
- Carlson, C.A.; Hansell, D.A.; Nelson, N.B.; Siegel, D.A.; Smethie, W.M.; Khatiwala, S.; Meyers, M.M.; Halewood, E. Dissolved organic carbon export and subsequent remineralization in the mesopelagic and bathypelagic realms of the North Atlantic basin. Deep-Sea Res. Part Ii-Top. Stud. Oceanogr. 2010, 57, 1433–1445.
- Hansell, D.A.; Carlson, C.A.; Schlitzer, R. Net removal of major marine dissolved organic carbon fractions in the subsurface ocean. Glob. Biogeochem. Cycles 2012, 26, GB1016.
- Baetge, N.; Graff, J.R.; Behrenfeld, M.J.; Carlson, C.A. Net community production, dissolved organic carbon accumulation, and vertical export in the western North Atlantic. Front. Mar. Sci. 2020, 7, 227.
- Noji, T.T.; Borsheim, K.Y.; Rey, F.; Nortvedt, R. Dissolved organic carbon associated with sinking particles can be crucial for estimates of vertical carbon flux. Sarsia 1999, 84, 129–135.
- Orellana, M.V.; Hansell, D.A. Ribulose-1,5-bisphosphate carboxylase/oxygenase (RuBisCO): A long-lived protein in the deep ocean. Limnol. Oceanogr. 2012, 57, 826–834.
- Collins, J.R.; Edwards, B.R.; Thamatrakoln, K.; Ossolinski, J.E.; DiTullio, G.R.; Bidle, K.D.; Doney, S.C.; Van Mooy, B.A.S. The multiple fates of sinking particles in the North Atlantic Ocean. Glob. Biogeochem. Cycles 2015, 29, 1471–1494.
- Lopez, C.N.; Robert, M.; Galbraith, M.; Bercovici, S.K.; Orellana, M.V.; Hansell, D.A. High temporal variability of total organic carbon in the deep northeastern Pacific. Front. Earth Sci. 2020, 8, 80.
- Repeta, D.J.; Aluwihare, L.I. Radiocarbon analysis of neutral sugars in high-molecular-weight dissolved organic carbon: Implications for organic carbon cycling. Limnol. Oceanogr. 2006, 51, 1045–1053.
- Hansman, R.L.; Griffin, S.; Watson, J.T.; Druffel, E.R.M.; Ingalls, A.E.; Pearson, A.; Aluwihare, L.I. The radiocarbon signature of microorganisms in the mesopelagic ocean. Proc. Natl. Acad. Sci. USA 2009, 106, 6513–6518.
- Repeta, D.J. Chemical Characterization and Cycling of Dissolved Organic Matter. In Biogeochemistry of Marine Dissolved Organic Matter, 2nd ed.; Elsevier: London, UK, 2014; pp. 21–63.
- Riedel, T.; Dittmar, T. A method detection limit for the analysis of natural organic matter via Fourier Transform Ion Cyclotron Resonance Mass Spectrometry. Anal. Chem. 2014, 86, 8376–8382.


