 +1 credit
| Version | Summary | Created by | Modification | Content Size | Created at | Operation |
|---|---|---|---|---|---|---|
| 1 | Gösta Baganz | + 3764 word(s) | 3764 | 2021-07-25 10:52:25 | | | |
| 2 | Beatrix Zheng | + 1264 word(s) | 5028 | 2021-08-08 05:36:26 | | |
Video Upload Options
Aquaponics, the water-reusing production of fish and crops, is taken as an example to investigate the consequences of upscaling a nature-based solution in a circular city. We developed an upscaled-aquaponic scenario for the German metropolis of Berlin, analysed the impacts, and studied the system dynamics. To meet the annual fish, tomato, and lettuce demand of Berlin’s 3.77 million residents would require approximately 370 aquaponic facilities covering a total area of 224 hectares and the use of different combinations of fish and crops: catfish/tomato (56%), catfish/lettuce (13%), and tilapia/tomato (31%). As a predominant effect, in terms of water, aquaponic production would save about 2.0 million m3 of water compared to the baseline. On the supply-side, we identified significant causal link chains concerning the Food-Water-Energy nexus at the aquaponic facility level as well as causal relations of a production relocation to Berlin. On the demand-side, a ‘freshwater pescatarian diet’ is discussed. The new and comprehensive findings at different system levels require further investigations on this topic. Upscaled aquaponics can produce a relevant contribution to Berlin’s sustainability and to implement it, research is needed to find suitable sites for local aquaponics in Berlin, possibly inside buildings, on urban roofscape, or in peri-urban areas.
1. Introduction
2. Analysis on Results
2.1. Berlin: Balancing Demand and Yield
| Demand | Residents Berlin 2020: | 3,769,962 | ||||
|---|---|---|---|---|---|---|
| Fresh/Fillet | Products | Total | Netto | Not | Brutto | |
| (kg/PC) | (kg/PC) | (kg/PC) | (t) | Marketable | (t) | |
| Freshwater fish | 3.0 | 0.9 | 3.9 | 14,703 | 40% | 20,584 |
| Tomato | 9.3 | 17.9 | 27.2 | 102,543 | 5% | 107,670 |
| Lettuce | 6.8 | 6.8 | 25,636 | 5% | 26,918 | |
| fresh tomato only | 35,061 | 5% | 36,814 | |||
| Fish Demand Coverage | Aquaponic Setups (AP 1 … AP 4) | |||
|---|---|---|---|---|
| Tomato | Lettuce | |||
| Catfish | AP 1 | 56% | AP 2 | 13% |
| Tilapia | AP 3 | 31% | AP 4 | 0% |
| Yield | Fish Yield (t) | Plant Yield (t) | AP Facilities | |||||
|---|---|---|---|---|---|---|---|---|
| Aquaponic setup | Catfish | Tilapia | F/P* | Tomato | Lettuce | |||
| AP 1 | 11,527 | 3.3 | 37,508 | 118 | ||||
| AP 2 | 2676 | 10.2 | 27,381 | 27 | ||||
| AP 3 | 6381 | 11.1 | 70,912 | 223 | ||||
| AP 4 ** | 0 | 56.2 | 0 | 0 | ||||
| Total yield | 14,203 | 6381 | yield | 108,420 | 27,381 | required | 368 | |
| fish yield share | 69% | 31% | demand | 107,670 | 26,918 | |||
| delta | 750 | 464 | ||||||
| fish demand | 20,584 | |||||||
| fish yield | 20,584 | *) fish/plant harvest ratio | ||||||
| delta | 0 | **) AP 4 excluded because of the F/P ratio | ||||||
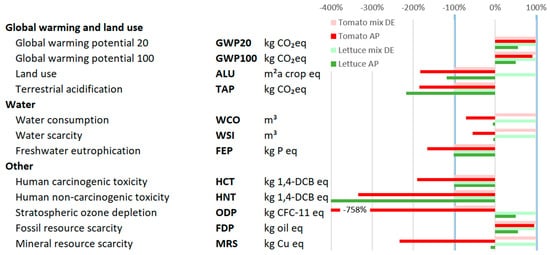
2.2. Supply-Side: Impact on Berlin FWE Nexus
| LCA Impact Category | Abbr. | Unit | Tomato, Fresh | mio. packs | 73.6 | Lettuce | mio. packs | 179.5 | Total Reduction |
|||
|---|---|---|---|---|---|---|---|---|---|---|---|---|
| Mix-DE | Rooftop AP | Delta | Less Impact |
Mix-DE | Rooftop AP | Delta | Less Impact |
|||||
| Global warming potential 100 |
GWP100 | kg CO2 eq | 0.5760 | 0.5261 | 0.0500 | 3679662 | 0.0769 | 0.0385 | 0.0383 | 2822799 | 6502 | t |
| Water consumption |
WCO | m3 | 0.0142 | −0.0101 | 0.0243 | 1786533 | 0.0033 | −0.0002 | 0.0035 | 261272 | 2,047,805 | m3 |
| Water scarcity |
WSI | m3 | 0.0109 | −0.0059 | 0.0168 | 1237314 | 0.0021 | −0.0001 | 0.0022 | 163054 | 1,400,368 | m3 |
2.3. Causalities: Aquaponic Variables and Production-Location Shift
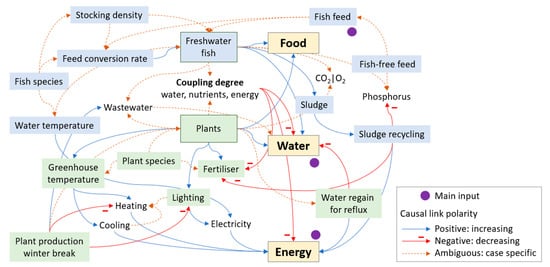
| Aquaponic Variables | Selected Causal Relationships |
|---|---|
| Cooling | Cooling lowers the greenhouse temperature, which requires energy and generates excess heat depending on the technology. |
| Coupling degree—energy | Thermal connections between the AP units can reduce the total energy demand of the AP. |
| Coupling degree—nutrient | In a well-balanced AP, a high nutrient coupling degree reduces fertiliser consumption to a minimum. |
| Coupling degree—water | The double use of water is at the core of the aquaponic principle and a high water coupling degree is the objective of a well-balanced AP. It reduces both the external water consumption of the HP and the wastewater generation of the facility. |
| Electricity | Electricity is mainly used for pumps, control systems, lighting, and heating of RAS process water. Thus, these components directly affect the energy sector of the nexus through their operating times and energetic efficiency. |
| Feed conversion rate | Feed conversion rate (FCR) describes the conversion of feed into biomass. |
| Fertiliser | Fertiliser is essential for optimal plant growth; over-fertilisation defects are not considered here. |
| Freshwater fish | Fish production contributes to the food sector; its farming generates sludge. The amount of wastewater should be as low as possible, but zero is a difficult goal to achieve. If the production of freshwater fish in RAS were to replace marine fish production in net-cages then the phosphorus flux into the sea could be reduced. |
| Fish feed | Fish feed is the prerequisite for fish growth and the type and quality of feed also affect FCR. |
| Fish species | Freshwater fish can be divided into three groups according to their temperature requirements: tropical, warm water, and cold-water fish, which determines the water temperature of the aquaculture unit. For different fish species, different stocking densities are allowed: e.g., tilapia max. 100 kg/m3 or catfish with up to 400 kg/m3. In addition, the species influences the FCR. |
| Fish-free feed | Fish feed without fish meal and fish oil reduces phosphorus removal from the oceans by wild fisheries among other positive environmental aspects [45]; insects can be part of fish diets [46]; and the impact on the quality of fish feed is case-specific. |
| Gas: CO2 and O2 | O2 is used in RAS to increase yield and ensure the minimum oxygen content in the water in critical situations. CO2 is used in HP greenhouse production to increase yield. The gases can be exchanged between both AP units [47]. |
| Greenhouse temperature | Greenhouse temperature influences plant growth with positive link polarity. |
| Heating | Heating is needed for tropical fish and greenhouses, especially in the colder season. |
| Lighting | Greenhouse lighting requires electrical energy; it can also contribute to heating if, e.g., heat-emitting sodium vapour lamps are used. LED lamps do not emit long-wave heat and contribute to greenhouse heating to a lesser extent. |
| Plant productionwinter break | In the winter season, plant production in the greenhouse can be suspended, which saves energy for lighting and heating, but at the same time reduces the yield of crop production. |
| Plant species | The plant species affects the type and quantity of fertiliser needed, the required greenhouse temperature, the water uptake, the harvest yield, and their dynamics. |
| Plants | Increased harvest contributes positively to the food sector. Plants take up water, transpire it, and the water vapour can be regained in modern greenhouse systems. Depending on the irrigation method, wastewater is produced, e.g., for flushing the plant troughs. |
| Sludge | The quantity and composition of the sludge determine how much of it can be recycled. |
| Sludge recycling | Sludge removal and mineralisation can save fertiliser and thus reduce the use of phosphorous as a supplemental fertiliser. |
| Stocking density | Stocking density affects both FCR and the amount of fish that can be harvested and the requirements for additional oxygen or improved water treatment. |
| Wastewater | Wastewater is the water leaving the facility. All internal water flows are not included. In particular, the nutrient water is not considered wastewater, as suggested by Baganz et al. [48]. |
| Water regain for reflux | The more plants are cultivated, the more energy is needed to regain the evapotranspired water in the greenhouse, which in turn saves the water needed in the aquaculture unit. |
| Water temperature | Fish are poikilothermic; unlike homoeothermic animals, they do not use their metabolisms to heat or cool themselves. They can therefore invest more energy into growth, resulting in a higher FCR. However, in a temperate climate zone, the water for tropical fish must be heated, which means that the energy saved internally by fish must be supplied externally. |
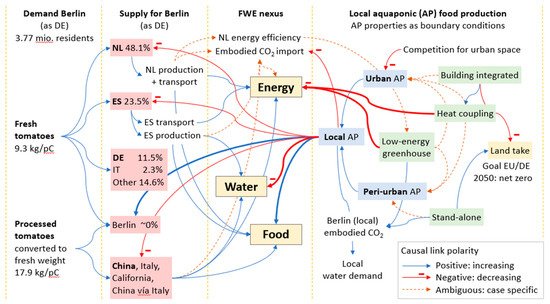
| Production Variables | Selected Causal Relationships |
|---|---|
| Demand Berlin | In 2018/2019, 9.3 kg/PC fresh tomatoes and 17.9 kg/PC processed tomatoes were consumed in Germany (DE); we assumed the same for Berlin. |
| Supply for Berlin | In 2019, the production shares on fresh tomatoes for Germany (DE) include the following: The Netherlands (NL) 48.1%, Spain (ES) 23.5%, DE 11.5%, and Italy (IT) 2.3% [55]. We assume that these values also apply to Berlin. The share of tomatoes produced in Berlin is not known. The footprint evaluation of processed tomato products is not the subject of this study; nevertheless, an LCA of packaged tomato puree exists in the literature [56]. All deliveries result in an import of embodied CO2. It should be noted that China is the globally most significant producer of tomatoes—some tomato products are distributed in the EU under an Italian label [57]. |
| FWE nexus | The FWE ranking in Figure 4 indicates the main dependencies of the sectors: the climate crisis (CO2, energy) is the greatest global challenge. If it is not solved, the global water balance will face significant problems and water scarcity will increase. Water, in turn, is the basis for all forms of food production. |
| Local aquaponic | Concerning urban AP, increasing building integration will reduce land consumption, which is required to achieve zero net land take by 2050 [58]. On the other hand, increasing competition for urban space will decrease urban AP applications. Peri-urban AP results in the conflict of objectives that, on the one hand, mitigates competition for use in the city but, on the other hand, is usually built as a standalone facility that results in increased land consumption. The high standard of the Dutch (NL) greenhouse production is the energy-related benchmark concerning greenhouse production in Berlin. Heat coupling and/or low-energy greenhouse are required for production in Berlin to have a lower impact on the energy sector than production in the Netherlands. Increasing local AP will induce the following: decrease imports, reduce embodied CO2, mitigate water scarcity in Almeria, and increase local food production. Due to the double use of water by AP, the overall water consumption will decrease (WCO in Table 5) but local water demand will increase. |
3. Current Insights
3.1. Food: Demand-Side Impact of Dietary Shifts
3.2. Water: Trans-Aquaponics
| Water 2040 | (Million m3) |
|---|---|
| Households | 551.0 |
| Industry and trade | 102.6 |
| Others | 140.6 |
| Environment | 11.4 |
| Total | 805.6 |
3.3. Energy: Low-Energy Greenhouses and Transport Trade-Offs
References
- UNEP. Making Peace with Nature—A Scientific Blueprint to Tackle the Climate, Biodiversity and Pollution Emergencies; UNEP: Nairobi, Kenya, 2021; ISBN 978-92-807-3837-7.
- UN. Transforming Our World: The 2030 Agenda for Sustainable Development. 2015. Available online: https://www.un.org/ga/search/view_doc.asp?symbol=A/RES/70/1&Lang=E (accessed on 10 May 2018).
- UN. The Sustainable Development Goals Report 2020; UN: New York City, NY, USA, 2020; ISBN 978-92-1-101425-9.
- UN. Decade of Action—Ten Years to Transform Our World. Available online: https://www.un.org/sustainabledevelopment/decade-of-action/ (accessed on 24 March 2021).
- BReg. Deutsche Nachhaltigkeitsstrategie—Weiterentwicklung 2021. 2021. Available online: https://www.bundesregierung.de/breg-de/service/publikationen/deutsche-nachhaltigkeitsstrategie-weiterentwicklung-2021-langfassung--1875178 (accessed on 26 March 2021).
- Willett, W.; Rockström, J.; Loken, B.; Springmann, M.; Lang, T.; Vermeulen, S.; Garnett, T.; Tilman, D.; DeClerck, F.; Wood, A.; et al. Food in the Anthropocene: The EAT–Lancet Commission on Healthy Diets from Sustainable Food Systems. Lancet 2019, 393, 447–492.
- Rockström, J.; Steffen, W.; Noone, K.; Persson, Å.; Chapin, F.S., III; Lambin, E.; Lenton, T.M.; Scheffer, M.; Folke, C.; Schellnhuber, H.J.; et al. Planetary Boundaries: Exploring the Safe Operating Space for Humanity. Ecol. Soc. 2009, 14, 1–33.
- Campbell, B.M.; Beare, D.J.; Bennett, E.M.; Hall-Spencer, J.M.; Ingram, J.S.; Jaramillo, F.; Ortiz, R.; Ramankutty, N.; Sayer, J.A.; Shindell, D. Agriculture Production as a Major Driver of the Earth System Exceeding Planetary Boundaries. Ecol. Soc. 2017, 22.
- Link, J.S.; Watson, R.A. Global Ecosystem Overfishing: Clear Delineation within Real Limits to Production. Sci. Adv. 2019, 5, eaav0474.
- FAO. The State of World Fisheries and Aquaculture 2018; FAO: Rome, Italy, 2018.
- Franks, B.; Ewell, C.; Jacquet, J. Animal Welfare Risks of Global Aquaculture. Sci. Adv. 2021, 7, eabg0677.
- Naylor, R.L.; Goldburg, R.J.; Primavera, J.H.; Kautsky, N.; Beveridge, M.C.M.; Clay, J.; Folke, C.; Lubchenco, J.; Mooney, H.; Troell, M. Effect of Aquaculture on World Fish Supplies. Nature 2000, 405, 1017–1024.
- Naylor, R.L.; Hardy, R.W.; Buschmann, A.H.; Bush, S.R.; Cao, L.; Klinger, D.H.; Little, D.C.; Lubchenco, J.; Shumway, S.E.; Troell, M. A 20-year Retrospective Review of Global Aquaculture. Nature 2021, 591, 551–563.
- Holmer, M. Environmental Issues of Fish Farming in Offshore Waters: Perspectives, Concerns and Research Needs. Aquac. Environ. Interact. 2010, 1, 57–70.
- Barrett, L.T.; Swearer, S.E.; Dempster, T. Impacts of Marine and Freshwater Aquaculture on Wildlife: A Global Meta-Analysis. Rev. Aquac. 2019, 11, 1022–1044.
- Huang, Y.; Ciais, P.; Goll, D.S.; Sardans, J.; Peñuelas, J.; Cresto-Aleina, F.; Zhang, H. The Shift of Phosphorus Transfers in Global Fisheries and Aquaculture. Nat. Commun. 2020, 11.
- Guzmán-Luna, P.; Gerbens-Leenes, P.W.; Vaca-Jiménez, S.D. The Water, Energy, and Land Footprint of Tilapia Aquaculture in Mexico, a Comparison of the Footprints of Fish and Meat. Resour. Conserv. Recycl. 2021, 165, 105224.
- UNESCO. The United Nations World Water Development Report. Wastewater: The Untapped Resource. 2017. Available online: https://unesdoc.unesco.org/ark:/48223/pf0000247153 (accessed on 27 April 2021).
- UN-Water. Summary Progress Update 2021: SDG 6—Water and Sanitation for All. 2021. Available online: File:///C:/Users/Research/AppData/Local/Temp/SDG-6-Summary-Progress-Update-2021_Version-2021-03-03-1.pdf (accessed on 27 April 2021).
- Naegel, L.C.A. Combined Production of Fish and Plants in Recirculating Water. Aquaculture 1977, 10, 17–24.
- Rakocy, J.E.; Masser, M.P.; Losordo, T.M. Recirculating Aquaculture Tank Production Systems: Aquaponics—Integrating Fish and Plant Culture. SRAC Publications. 454; Texas A&M University: College Station, TX, USA; Southern Regional Aquaculture Center: Stoneville, MS, USA, 2006; Available online: https://srac.tamu.edu/fact-sheets/serve/105 (accessed on 24 April 2018).
- Joyce, A.; Goddek, S.; Kotzen, B.; Wuertz, S. Aquaponics: Closing the Cycle on Limited Water, Land and Nutrient Resources. In Aquaponics Food Production Systems: Combined Aquaculture and Hydroponic Production Technologies for the Future; Goddek, S., Joyce, A., Kotzen, B., Burnell, G.M., Eds.; Springer International Publishing: Basel, Switzerland, 2019.
- UN. UN Deputy Secretary-General at Mayor’s Forum—Press Release. 2015. Available online: https://www.un.org/press/en/2015/dsgsm874.doc.htm (accessed on 14 December 2018).
- UN-Habitat. World Cities Report 2016. 2016. Available online: https://unhabitat.org/sites/default/files/download-manager-files/WCR-2016-WEB.pdf (accessed on 27 April 2021).
- IMM. Implementing the New Leipzig Charter through Multi-level Governance: Next Steps for the Urban Agenda for the EU. 2020. Available online: https://ec.europa.eu/regional_policy/sources/docgener/brochure/new_leipzig_charter/new_leipzig_charter_implem_en.pdf (accessed on 28 December 2020).
- IMM. The New Lepzig Charte—The Transformative Power of Cities for the Common Good. 2020. Available online: https://www.bmi.bund.de/SharedDocs/downloads/EN/eu-presidency/gemeinsame-erklaerungen/new-leipzig-charta-2020.pdf (accessed on 12 January 2021).
- CE, TNO, FABRIC. Amsterdam Circular—Vision and Roadmap for the City and Region. Available online: https://assets.website-files.com/5d26d80e8836af2d12ed1269/5ede5a03e4cd056426b86d8b_20152115%20-%20Amsterdam%20scan%20-%20report%20EN%20web%20single%20page%20-%20297x210mm.pdf (accessed on 4 April 2018).
- Sukhdev, A.; Vol, J.; Brandt, K.; Yeoman, R. Cities in the Circular Economy: The Role of Digital Technology. 2019. Available online: https://www.ellenmacarthurfoundation.org/assets/downloads/Cities-in-the-Circular-Economy-The-Role-of-Digital-Tech.pdf (accessed on 30 January 2020).
- Langergraber, G.; Pucher, B.; Simperler, L.; Kisser, J.; Katsou, E.; Buehler, D.; Mateo, M.C.G.; Atanasova, N. Implementing Nature-Based Solutions for Creating a Resourceful Circular City. Blue-Green Syst. 2020, 2, 173–185.
- Science for Environment Policy. The Solution is in Nature; Science Communication Unit, University of the West of England (UWE): Bristol, UK, 2021.
- IUCN. IUCN Global Standard for Nature-Based Solutions: A User-Friendly Framework for the Verification, Design and Scaling up of NbS, 1st ed.; IUCN: Gland, Switzerland, 2020.
- UNEP. Adaptation Gap Report 2020; UNEP: Nairobi, Kenya, 2021; ISBN 978-92-807-3834-6.
- Atanasova, N.; Castellar, J.A.C.; Pineda-Martos, R.; Nika, C.E.; Katsou, E.; Istenič, D.; Pucher, B.; Andreucci, M.B.; Langergraber, G. Nature-Based Solutions and Circularity in Cities. Circ. Econ. Sustain. 2021.
- Castellar, J.A.C.; Popartan, L.A.; Pueyo-Ros, J.; Atanasova, N.; Langergraber, G.; Säumel, I.; Corominas, L.; Comas, J.; Acuna, V. Nature-based Solutions in the Urban Context: Terminology, Classification and Scoring for Urban Challenges and Ecosystem Services. Sci. Total Environ. 2021, 779, 146237.
- Lohrberg, F.; Licka, L.; Scazzosi, L.; Timpe, A. Urban Agriculture Europe. 2015: 256. Architecture Urban Space. 2015. Available online: http://urban-agriculture-europe.org/files/urbanagricultureeurope_en.pdf (accessed on 16 February 2021).
- Canet-Martí, A.; Pineda-Martos, R.; Junge, R.; Paço, T.A.; Bohn, K.; Delgado, C.; Pedras, C.M.G.; Alencikiene, G.; Skar, S.L.G.; Baganz, G.F.M. Nature-based Solutions for Urban Agriculture in Circular Cities: Challenges, Gaps and Opportunities. Water 2021. Unpublished work.
- MUFPP. Milan Urban Food Policy Pact. 2015. Available online: https://www.milanurbanfoodpolicypact.org/wp-content/uploads/2020/12/Milan-Urban-Food-Policy-Pact-EN.pdf (accessed on 16 February 2021).
- BLE. SJT-4040300-2019.xlsx Versorgung mit Gemüse nach Arten. Federal Office of Agriculture and Food (BLE). 2020. Available online: https://www.bmel-statistik.de/ernaehrung-fischerei/tabellen-kapitel-d-und-hiv-des-statistischen-jahrbuchs/ (accessed on 14 November 2020).
- BLE. Ein- und Ausfuhr Tomaten Deutschland 2014–2018. 2019. Available online: https://www.bmel-statistik.de/fileadmin/daten/GBG-0050317-2018.pdf (accessed on 29 November 2020).
- FIZ. Fischereiwirtschaft, Daten und Fakten 2020. 2020. Available online: https://www.fischinfo.de/images/broschueren/pdf/FIZ_Daten_und_Fakten_2020.pdf (accessed on 6 February 2020).
- AfS. Berlins Einwohnerzahl stagniert 2020—Pressemitteilung Nr. 32. 2021. Available online: https://download.statistik-berlin-brandenburg.de/70fd75104b57d0fa/83cc240d450f/21-02-10.pdf (accessed on 10 February 2021).
- Körner, O.; Bisbis, M.B.; Baganz, G.F.M.; Baganz, D.; Staaks, G.B.O.; Monsees, H.; Goddek, S.; Keesman, K.J. Environmental Impact Assessment of Local Decoupled Multi-Loop Aquaponics in an Urban Context. J. Clean. Prod. 2021, 313, 127735.
- Castro, A.J.; López-Rodríguez, M.D.; Giagnocavo, C.; Gimenez, M.; Céspedes, L.; Calle, A.L.; Gallardo, M.; Pumares, P.; Cabello, J.; Rodriguez, E.; et al. Six Collective Challenges for Sustainability of Almería Greenhouse Horticulture. Int. J. Environ. Res. Public Health 2019, 16, 4097.
- De Graaf, F.; Goddek, S. Smarthoods: Aquaponics Integrated Microgrids. In Aquaponics Food Systems; Springer International Publishing: Basel, Switzerland, 2019; pp. 379–392.
- Meigs, H.; Barrows, F.; Sims, N.A.; Alfrey, K. Testing Diets without Fishmeal and Fish Oil for Kampachi. 2021. Available online: https://www.aquaculturealliance.org/advocate/testing-diets-without-fishmeal-and-fish-oil-for-kampachi/ (accessed on 26 April 2021).
- Tran, G.; Heuzé, V.; Makkar, H. Insects in Fish Diets. Anim. Front. 2015, 5, 37–45.
- Körner, O.; Gutzmann, E.; Kledal, P.R. A Dynamic Model Simulating the Symbiotic Effects in Aquaponic Systems; International Society for Horticultural Science (ISHS): Leuven, Belgium, 2017; pp. 309–316.
- Baganz, G.F.M.; Junge, R.; Portella, M.C. The Aquaponic Principle—It is all about Coupling. Rev. Aquac 2021, in press.
- BMU. Klimaschutz in Zahlen—Fakten, Trends und Impulse Deutscher Klimapolitik. 2020. Available online: https://www.bmu.de/fileadmin/Daten_BMU/Pools/Broschueren/klimaschutz_zahlen_2020_broschuere_bf.pdf (accessed on 4 December 2020).
- Fuchs, R.; Brown, C.; Rounsevell, M. Europe’s Green Deal Offshores Environmental Damage to Other Nations. Nature 2020, 586, 671–673.
- EC. European Green Deal: Commission Proposes Transformation of EU Economy and Society to Meet Climate Ambitions. 2021. Available online: https://ec.europa.eu/commission/presscorner/detail/en/ip_21_3541 (accessed on 14 July 2021).
- EC. Proposal for a Establishing a Carbon Border Adjustment Mechanism—COM(2021) 564 Final. 2021. Available online: https://ec.europa.eu/info/sites/default/files/carbon_border_adjustment_mechanism_0.pdf (accessed on 14 July 2021).
- Torrellas, M.; Antón, A.; López, J.C.; Baeza, E.J.; Parra, J.P.; Munoz, P.; Montero, J.I. LCA of a Tomato Crop in a Multi-Tunnel Greenhouse in Almeria. Int. J. Life Cycle Assess. 2012, 17.
- Baganz, G.F.M.; Proksch, G.; Kloas, W.; Lorleberg, W.; Baganz, D.; Staaks, G.; Lohrberg, F. Site Resource Inventories—A Missing Link in the Circular City’s Information Flow. Adv. Geosci. 2020, 54, 23–32.
- BLE. Tomaten Weiterhin Sehr Beliebt. 2020. Available online: https://www.ble.de/SharedDocs/Downloads/DE/Pressemitteilungen/2020/200702_Tomaten.pdf;jsessionid=D4D2B52C65146BF0FC9C62A479B15B84.2_cid325?__blob=publicationFile&v=2 (accessed on 4 July 2020).
- Vignali, G.; Manfredi, M. Life Cycle Assessment of a Packaged Tomato Puree: A Comparison of Environmental Impacts Produced by Different Life Cycle Phases. J. Clean. Prod. 2014, 73, 275–284.
- Bizzotto, M. Tomato Derivatives: Increased Imports from China, Endangering Consumers’ Health. Request for Mandatory Indication of Origin on Labels. Available online: https://www.europarl.europa.eu/doceo/document/E-8-2017-004794_EN.html (accessed on 29 November 2020).
- SEP. Science for Environment Policy (2016) No Net Land Take by 2050? Future Brief Produced for the European Commission DG Environment by the Science Communication Unit, UWE, Bristol. 2016. Available online: http://ec.europa.eu/science-environment-policy (accessed on 16 May 2018).
- Siscan, Z.; Kaim, M. Green In Proceedings of Entrepreneurship in the Republic of Moldova and European Circular Economy Trend. Presented at Conferinţei Știinţifice Internaţionale, Ediţia a XXII-a, 2020, Chişinău, ASEM, Moldova, 25–26 September 2020.
- Hoang, N.T.; Kanemoto, K. Mapping the Deforestation Footprint of Nations Reveals Growing Threat to Tropical Forests. Nat. Ecol. Evol. 2021.
- Benton, T.G.; Bieg, C.; Harwatt, H.; Pudasaini, R.; Wellesley, L. Food System Impacts on Biodiversity Loss. 2021. Available online: https://www.chathamhouse.org/sites/default/files/2021-02/2021-02-03-food-system-biodiversity-loss-benton-et-al_0.pdf (accessed on 30 March 2021).
- Bar-On, Y.M.; Phillips, R.; Milo, R. The Biomass Distribution on Earth. Proc. Natl. Acad. Sci. USA 2018, 115, 6506–6511.
- Poore, J.; Nemecek, T. Reducing food’s environmental impacts through producers and consumers. Science 2019, 360, 987–992.
- EC. New Consumer Agenda—Strengthening Consumer Resilience for Sustainable Recovery. Volume COM(2020) 696 Final. 2020. Available online: https://ec.europa.eu/transparency/documents-register/detail?ref=COM(2020)696&lang=en (accessed on 20 January 2021).
- EC. Farm to Fork Strategy—For a Fair, Healthy and Environmentally-Friendly Food System. 2020. Available online: https://ec.europa.eu/food/system/files/2020-05/f2f_action-plan_2020_strategy-info_en.pdf (accessed on 20 February 2021).
- Chemnitz, C.; Wenz, K. Fleischatlas 2021—Daten und Fakten über Tiere als Nahrungsmittel. Auflage, Januar 2021 ed. Heinrich-Böll-Stiftung, Bund für Umwelt und Naturschutz Deutschland & Le Monde Diplomatique. 2021. Available online: https://www.boell.de/sites/default/files/2021-01/Fleischatlas2021_0.pdf (accessed on 8 January 2021).
- Macleod, M.J.; Hasan, M.R.; Robb, D.H.F.; Mamun-Ur-Rashid, M. Quantifying Greenhouse Gas Emissions from Global Aquaculture. Sci. Rep. 2020, 10, 1–8.
- Brüggmann, A.; Gebauer, R.; Kloas, W. Towards Developement of Sustainable Aquaponic Fish Feed: Effect of Fish, Insect, Blood and Feather Meal Based Diets on Nutrients in RAS with Colossoma Macropomum. 2019. Available online: https://www.researchgate.net/publication/336651324_TOWARDS_DEVELOPMENT_OF_SUSTAINABLE_AQUAPONIC_FISH_FEED_EFFECT_OF_FISH-_INSECT-_BLOOD-_AND_FEATHER-_MEAL_BASED_DIETS_ON_NUTRIENTS_IN_RAS_WITH_COLOSSOMA_MACROPOMUM (accessed on 8 January 2021).
- EFSA Panel on Nutrition, Novel Foods and Food Allergens (NDA); Turck, D.; Castenmiller, J.; Henauw, S.D.; Hirsch-Ernst, K.I.; Kearney, J.; Maciuk, A.; Mangelsdorf, I.; McArdle, H.J.; Naska, A.; et al. Safety of Dried Yellow Mealworm (Tenebrio Molitor Larva) as a Novel Food Pursuant to Regulation (EU) 2015. EFSA J. 2021, 19, e06343.
- Zech, K.M.; Schneider, U.A. Carbon Leakage and Limited Efficiency of Greenhouse Gas Taxes on Food Products. J. Clean. Prod. 2019, 213, 99–103.
- IPCC. Climate Change and Land: An IPCC Special Report on Climate Change, Desertification, Land Degradation, Sustainable Land Management, Food Security, and Greenhouse Gas Fluxes in Terrestrial Ecosystems. 2019. Available online: https://www.ipcc.ch/site/assets/uploads/sites/4/2021/02/210202-IPCCJ7230-SRCCL-Complete-BOOK-HRES.pdf (accessed on 2 May 2021).
- Herforth, A.; Ahmed, S. The Food Environment, its Effects on Dietary Consumption, and Potential for Measurement Within Agriculture-Nutrition Interventions. Food Secur. 2015, 7, 505–520.
- McGill, S.M. ‘Peak’ Phosphorus? The Implications of Phosphate Scarcity for Sustainable Investors. J. Sustain. Financ. Invest. 2012, 2, 222–239.
- Schachtman, D.P.; Reid, R.J.; Ayling, S.M. Phosphorus Uptake by Plants: From Soil to Cell. Plant Physiol. 1998, 116, 447–453.
- Steffen, W.; Richardson, K.; Rockstrom, J.; Cornell, S.E.; Fetzer, I.; Bennett, E.M.; Biggs, R.; Carpenter, S.R.; Vries, W.d.; Wit, C.A.d.; et al. Planetary Boundaries: Guiding Human Development on a Changing Planet. Science 2015, 347, 1259855.
- Elser, J. Phosphorus: A Limiting Nutrient for Humanity? Curr. Opin. Biotechnol. 2012, 23, 833–838.
- Falkowski, P. The Global Carbon Cycle: A Test of Our Knowledge of Earth as a System. Science 2000, 290, 291–296.
- Weikard, H.-P. Phosphorus Recycling and Food Security in the Long Run: A Conceptual Modelling Approach. Food Secur. 2016, 8, 405–414.
- European Parliament. DECISION No 1386/2013/EU—General Union Environment Action Programme to 2020 ‘Living Well, within the Limits of our Planet’; Official Journal of the European Union: Brussels, Belgium, 2013; Available online: https://eur-lex.europa.eu/legal-content/EN/TXT/PDF/?uri=CELEX:32013D1386&from=EN (accessed on 8 March 2019).
- Neori, A.; Krom, M.D.; Rijn, J.v. Biogeochemical Processes in Intensive Zero-Effluent Marine Fish Culture with Recirculating Aerobic and Anaerobic Biofilters. J. Exp. Mar. Biol. Ecol. 2007, 349, 235–247.
- Barak, Y.; van Rijn, J. Biological Phosphate Removal in a Prototype Recirculating Aquaculture Treatment System. Aquac. Eng. 2000, 22, 121–136.
- Monsees, H.; Keitel, J.; Paul, M.; Kloas, W.; Wuertz, S. Potential of Aquacultural Sludge Treatment for Aquaponics: Evaluation of Nutrient Mobilization under Aerobic and Anaerobic Conditions. Aquac. Environ. Interact. 2017, 9, 9–18.
- Hua, K.; Bureau, D.P. Modelling Digestible Phosphorus Content Of Salmonid Fish Feeds. Aquaculture 2006, 254, 455–465.
- Beckers, S. Aquaponics: A Positive Impact Circular Economy Approach to Feeding Cities. Field Actions Sci. Rep. 2019. Special Issue 20. pp. 78–84. Available online: https://journals.openedition.org/factsreports/5757 (accessed on 8 March 2021).
- Weidema, B. Market Information in Life Cycle Assessment. 2003. Available online: https://lca-net.com/files/Market-information-in-life-cycle-assessment.pdf (accessed on 15 November 2018).
- Langergraber, G.; Castellar, J.A.C.; Pucher, B.; Baganz, G.; Milosevic, D.; Andreucci, M.B. A Framework for Addressing Circularity Challenges in Cities with Nature-based Solutions. Water 2021. submitted.
- Hoelscher, M.-T.; Nehls, T.; Jänicke, B.; Wessolek, G. Quantifying Cooling Effects of Facade Greening: Shading, Transpiration and Insulation. Energy Build. 2016, 114, 283–290.
- Hoffmann, K.A.; Šuklje, T.; Kozamernik, J.; Nehls, T. Modelling the Cooling Energy Saving Potential of Facade Greening in Summer for a Set of Building Typologies in Mid-Latitudes. Energy Build. 2021, 238, 110816.
- Saad, R.; Hoffmann, K.A.; Paton, E.; Nehls, T. Modelling the Water Demand of Urban Vertical Green—Verticalizing the Standard Evapotranspiration. Hydrol. Earth Syst. Sci. 2021. Unpublished work.
- Kloas, W.; Groß, R.; Baganz, D.; Graupner, J.; Monsees, H.; Schmidt, U.; Staaks, G.; Suhl, J.; Tschirner, M.; Wittstock, B.; et al. A New Concept for Aquaponic Systems to Improve Sustainability, Increase Productivity and Reduce Environmental Impacts. Aquac. Environ. Interact. 2015, 7, 179–192.
- Möller, K.; Burgschweiger, J. Wasserversorgungskonzept für Berlin und für das von den BWB versorgte Umland. 2008. Available online: https://digital.zlb.de/viewer/resolver?urn=urn:nbn:de:kobv:109-opus-133719 (accessed on 26 August 2018).
- BLN. BLN reicht Unterlassungsklage zum Berliner Moorschutz ein. Berliner Landesarbeitsgemeinschaft Naturschutz e.V. Available online: https://www.bund-berlin.de/service/meldungen/detail/news/bln-reicht-unterlassungsklage-zum-berliner-moorschutz-ein/ (accessed on 28 April 2021).
- SenUVK. Erarbeitung Masterplan Wasser—Berlin. Senate Department for the Environment, Transport and Climate Protection. Available online: https://www.berlin.de/sen/uvk/umwelt/wasser-und-geologie/masterplan-wasser/ (accessed on 28 April 2021).
- Cuce, E.; Harjunowibowo, D.; Cuce, P.M. Renewable and Sustainable Energy Saving Strategies for Greenhouse Systems: A Comprehensive Review. Renew. Sustain. Energy Rev. 2016, 64, 34–59.
- Hemming, S.; Balendonck, J.; Dieleman, J.A.; de Gelder, A.; Kempkes, F.L.K.; Swinkels, G.L.A.M.; de Visser, P.H.B.; de Zwart, H.F. Innovations in Greenhouse Systems—Energy Conservation by System Design, Sensors and Decision Support Systems. Acta Hortic. 2017, 1–16.
- Opdam, J.J.G.; Schoonderbeek, G.G.; Heller, E.M.B.; De Gelder, A. Closed Greenhouse: A Starting Point for Sustainable Entrepreneurship in Horticulture. Acta Hortic. 2005, 691, 517–524.
- Körner, O. Models, Sensors and Decision Support Systems in Greenhouse Cultivation. Achiev. Sustain. Greenh. Cultiv. 2019, 379–412.
- Williams, A. Mythical Food Miles? Planet Earth 2013, 18–19. Available online: https://issuu.com/nerc/docs/pe_spring_13/18 (accessed on 28 June 2019).
- Payen, S.; Basset-Mens, C.; Perret, S. LCA of Local and Imported Tomato: An Energy and Water Trade-Off. J. Clean. Prod. 2014, 87.
- Sommer, F.; Dietze, V.; Baum, A.; Sauer, J.; Gilge, S.; Maschowski, C.; Gieré, R. Tire Abrasion as a Major Source of Microplastics in the Environment. Aerosol Air Qual. Res. 2018, 18, 2014–2028.
- Evangeliou, N.; Grythe, H.; Klimont, Z.; Heyes, C.; Eckhardt, S.; Lopez-Aparicio, S.; Stohl, A. Atmospheric Transport is a Major Pathway of Microplastics to Remote Regions. Nat. Commun. 2020, 11.

